• 미리보기
  • 리뷰 (4)
  • 코멘트 (15)
  • 새 소식

MR Volume POC Levels 4

5
The most crucial price level in any "Volume Profile" is the "Point of Control". Is the price level with the highest traded volume. And mainly, is the level where the big guys start there their positions, so it's an accumulation/distribution level for smart money.

The idea of the indicator arose after the "MR Volume Profile Rectangles" indicator was made. When creating the "MR Volume Profile Rectangles" indicator, we spent a lot of time comparing the volumes with those from the volume profile in NinjaTrader 8 terminal with CQG datafeed. The settings of EURUSD-6E, GBPUSD-6B, AUDUSD-6A and other currency pairs were compared. After making sure that everything is working according to our requirements, we made the "MR Dynamic POC" indicator following the model used in NinjaTrader 8. Ultimately, we decided to take a step forward and create a new generation indicator that will track the actions of the "Big" players in the financial markets. This is how the "MR Volume POC Levels" indicator appeared. Over time, we further developed our idea...

Some of the most important benefits of the indicator are as follows:
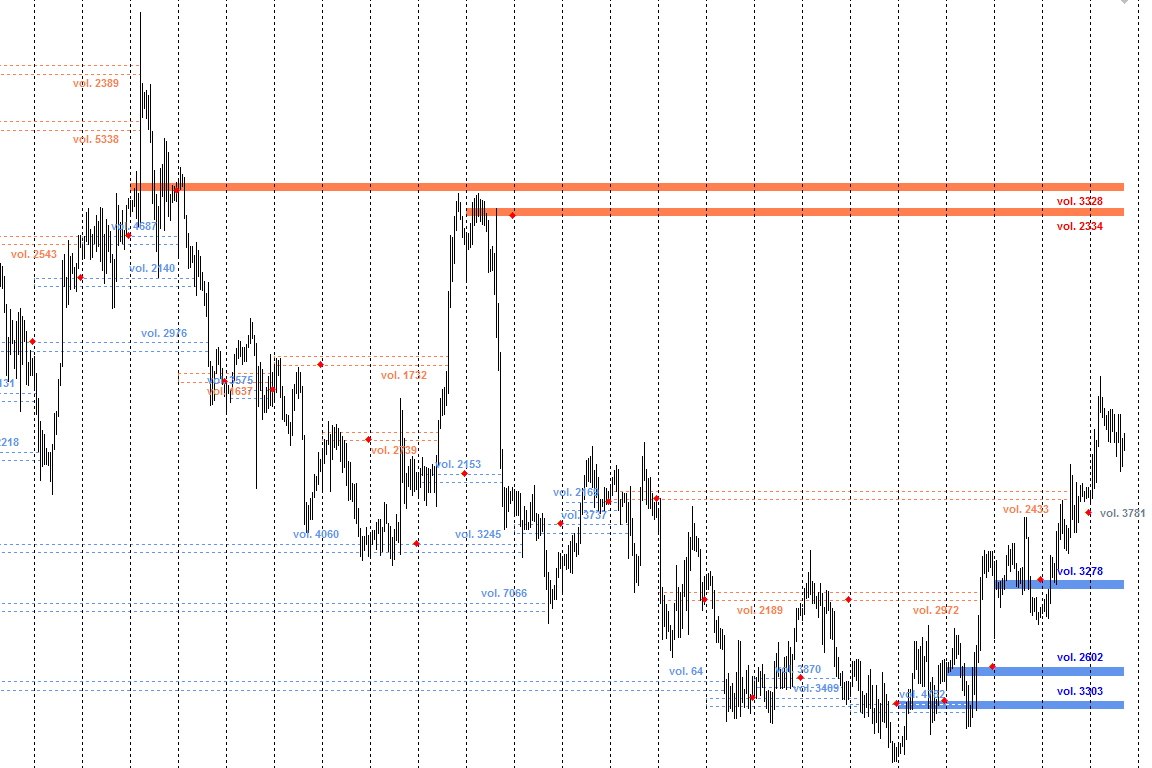
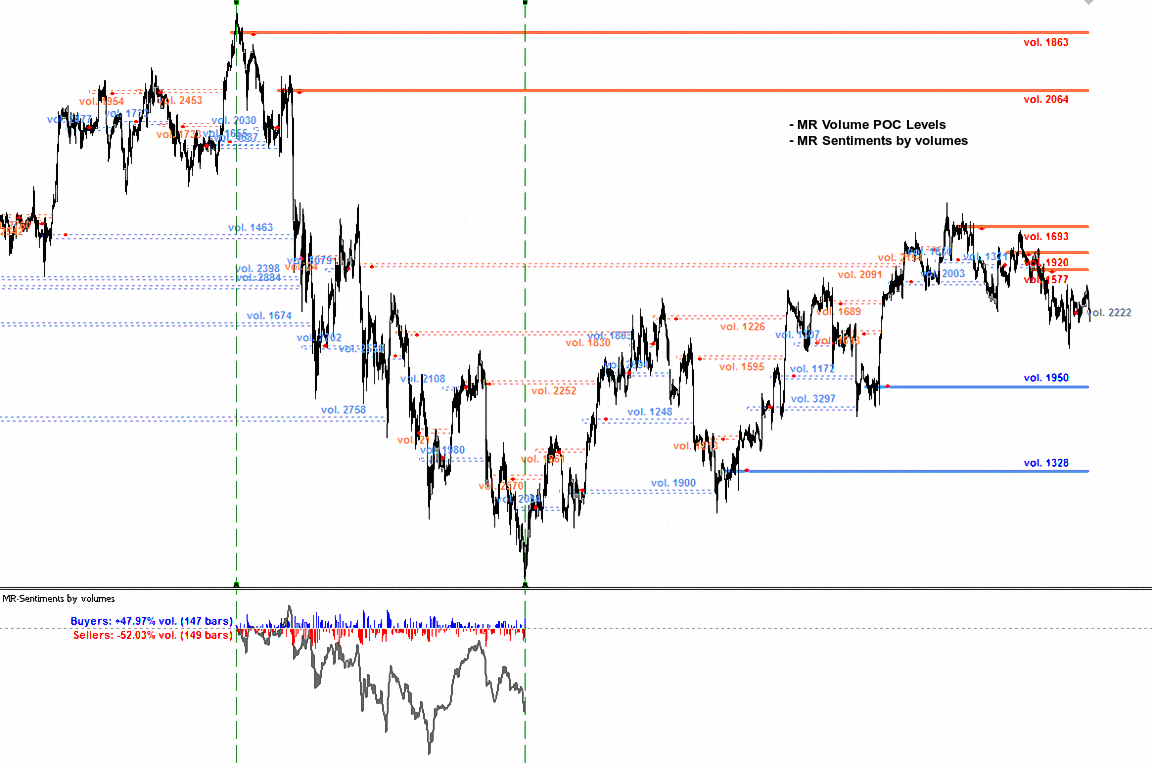
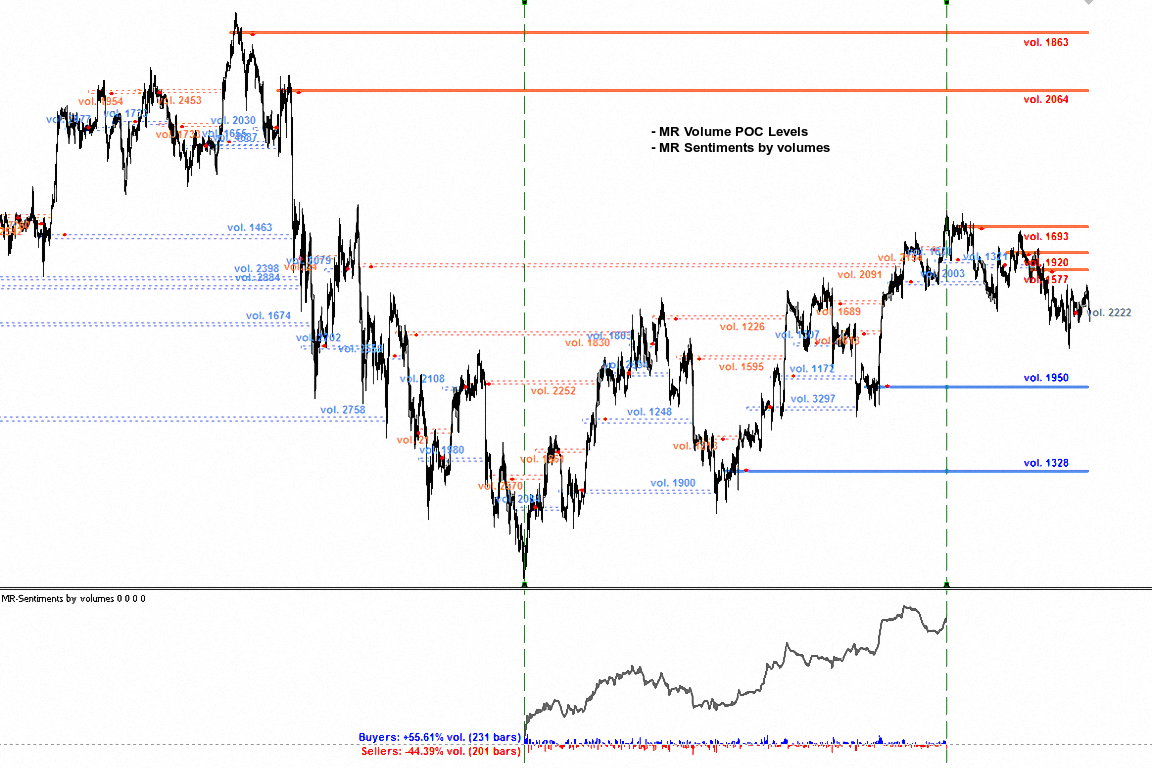
    • Indicator shows the POC (Point of Control) volume levels for the selected period of time.
    • "Point of Control" (POC) are not lines, they are zones.
    • Which zones are relevant and which are not, is determined by the author's methodology.
    • Using the indicator, you can track the actions of "Big" players in the market. At the extreme points of price movement (maximum, minimum), Market-Makers provide liquidity to "Big" players who change the direction of price movement.
    • At Volume POC Levels there is always a reaction. Whether the price movement will reverse its direction is decided only by the "Big" players in the market.
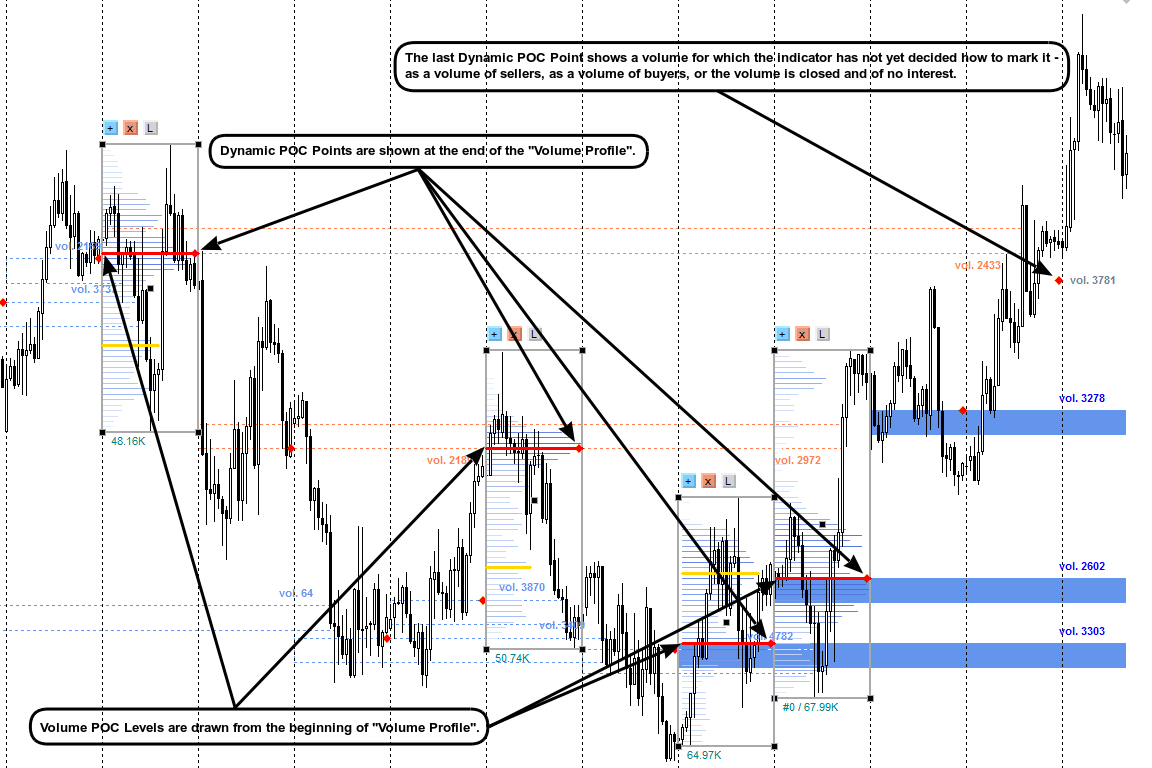
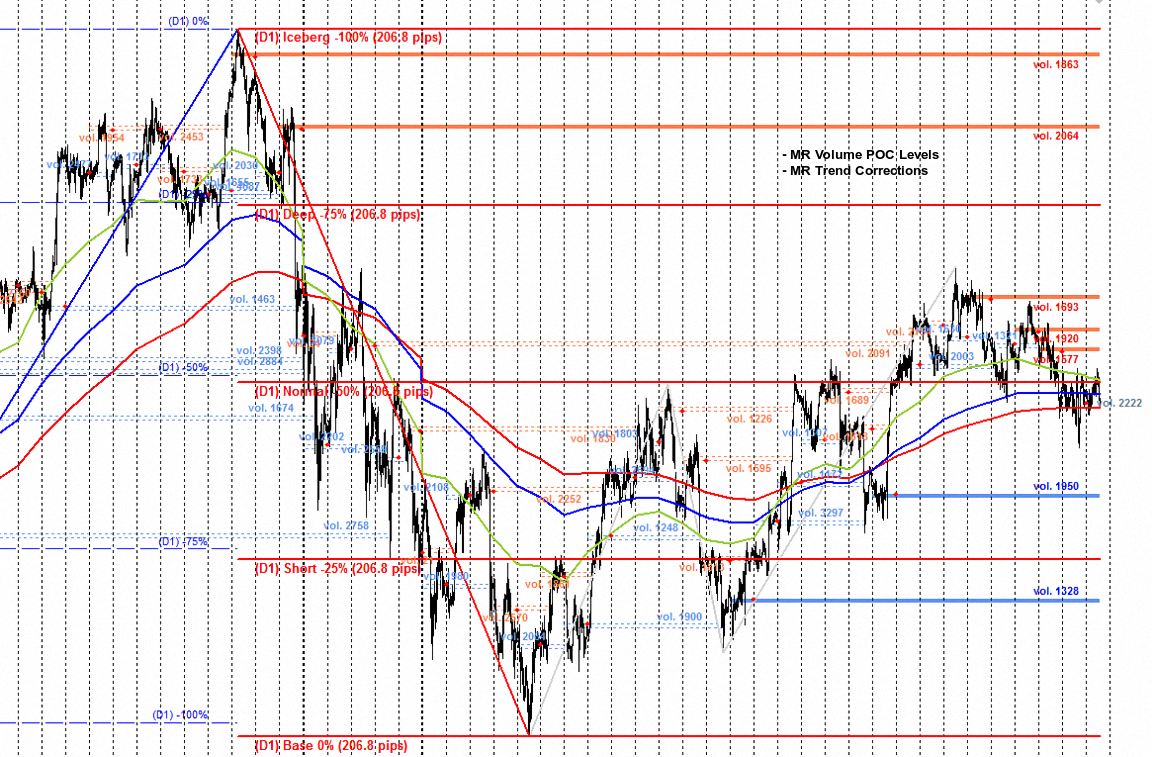
    • The indicator shows "points" from the new concept of the "MR Dynamic POC" indicator. Dynamic POC points are shown from the end of the "Volume Profile".
    • The last Dynamic POC Point (with gray text) shows a volume for which the indicator has not yet decided how to mark it - as a volume of sellers, as a volume of buyers, or the volume is closed and of no interest.
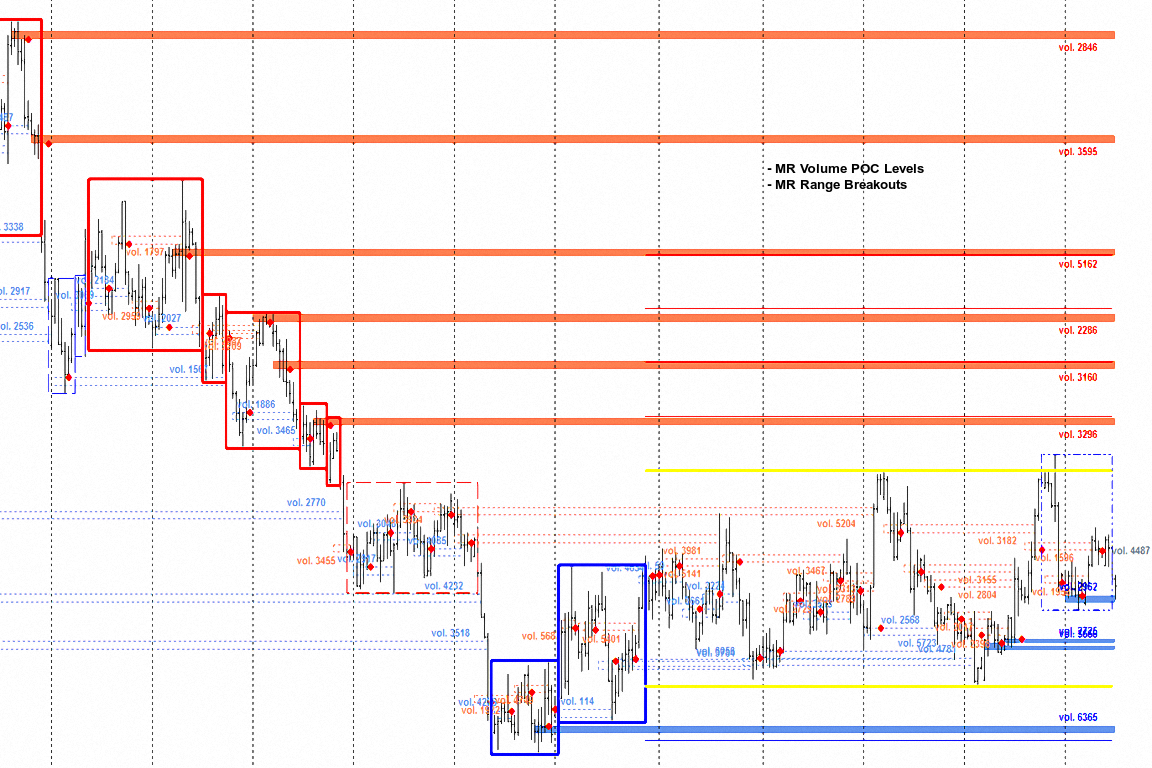
          • In combination with the "MR Range Breakouts" indicator, you can see where important volumes are left after the exit from the "Balances" and "Ranges". In addition, you can see how the volumes are absorbed in the "Range" and accumulate positions of buyers and sellers.
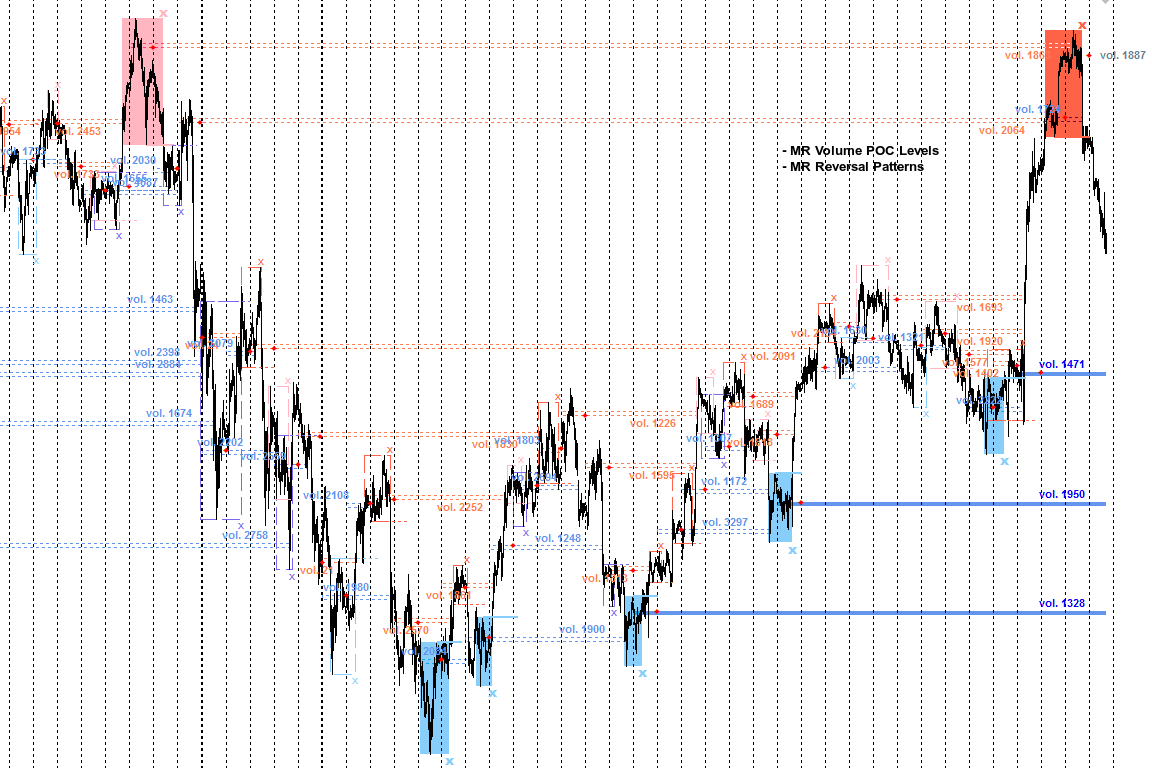
              • In combination with the "MR Reversal Patterns" indicator, you can track key places where volumes are absorbed and then new volumes appear in the opposite direction.
              • In combination with the "MR Sentiments by volumes" indicator, you can see when the volumes are used in the direction of the price movement and when the true reversal of the price movement occurs.
              • In combination with the "MR Trend Corrections" indicator, you can track the places where volumes are absorbed and accumulated. You will notice that in the "Impulse" movements, the volumes participate in the entrainment of the price movement in the direction of the "Impulse", and in the "Corrections" new places arise with volumes that keep the price movement in the range.
                • "MR Volume POC Levels 4" is based on indicator "VP: Volume Profile v6.0. © FXcoder".


                If you liked the indicator, please support our work by giving 5 stars!!!

                For MetaTrader 5 https://www.mql5.com/en/market/product/63565

                How to use indicators - Article


                Indicator settings:

                Points in 1 Pip - Offers you a choice of the number of Points in 1 Pip.
                Volume types - Offers you a choice to use tic volumes or real volumes. Note: To use real volumes, your Broker must provide them in the MetaTrader terminal.

                Section "Visual Trading Styles Settings"
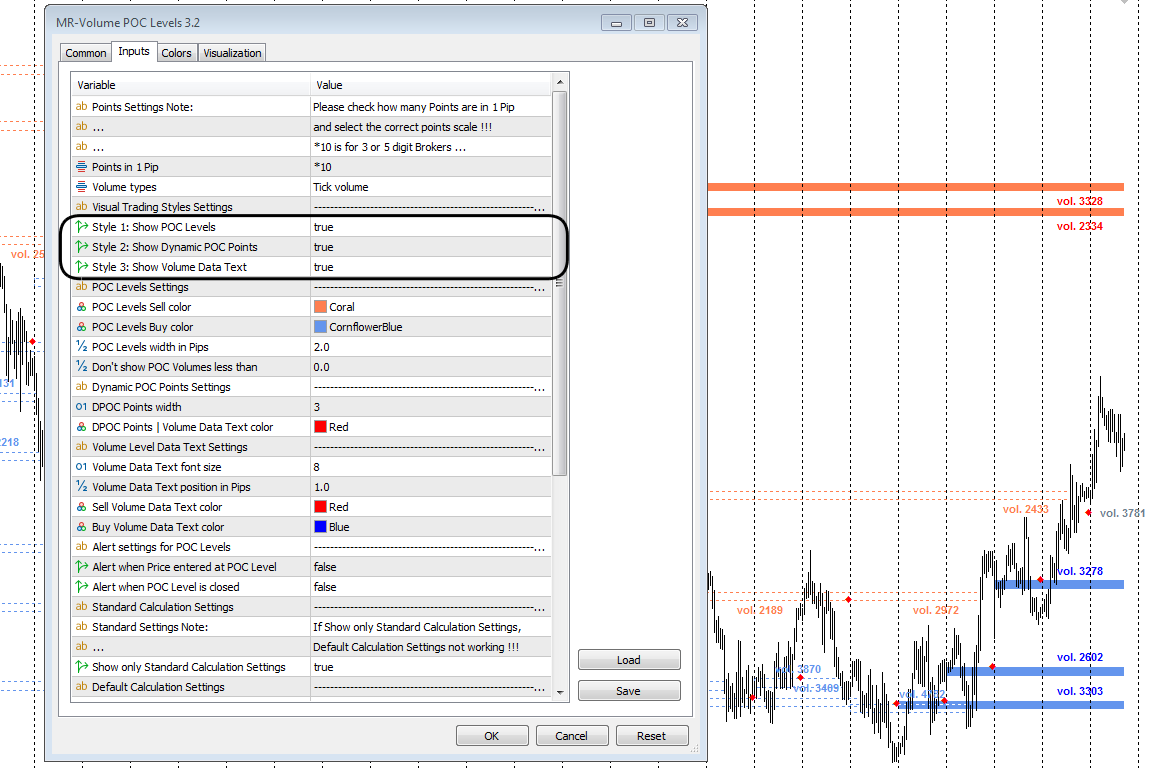
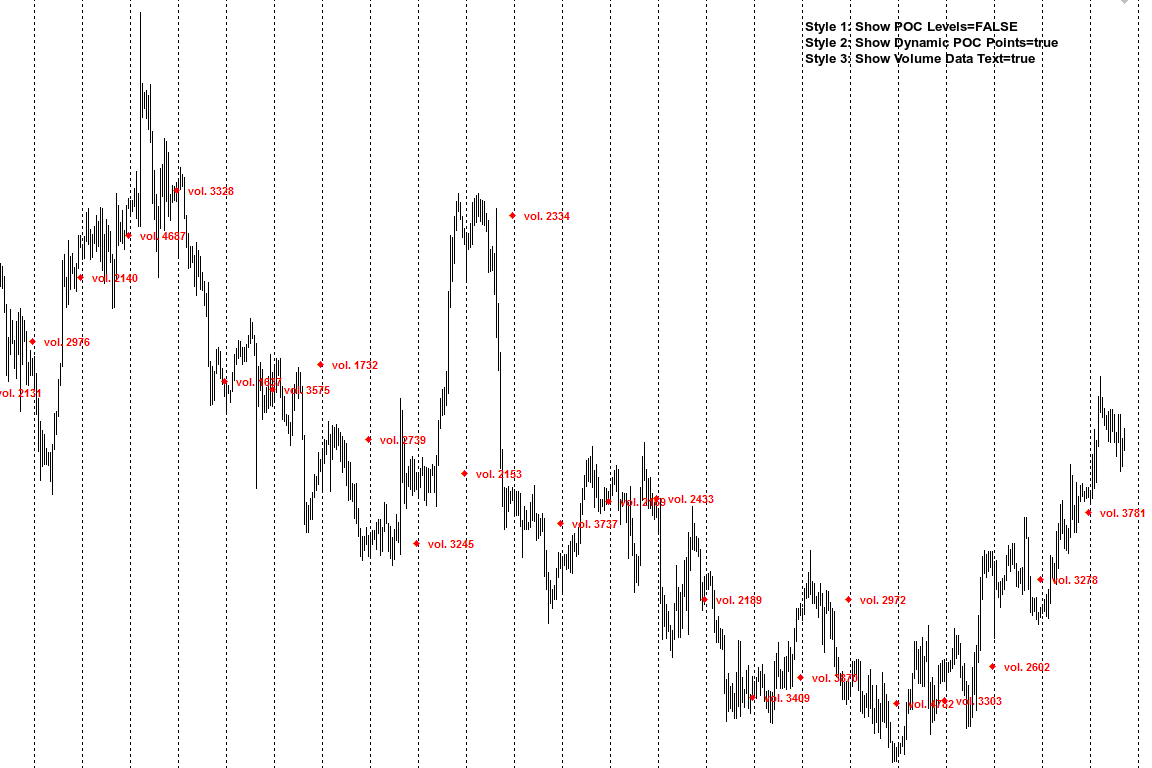
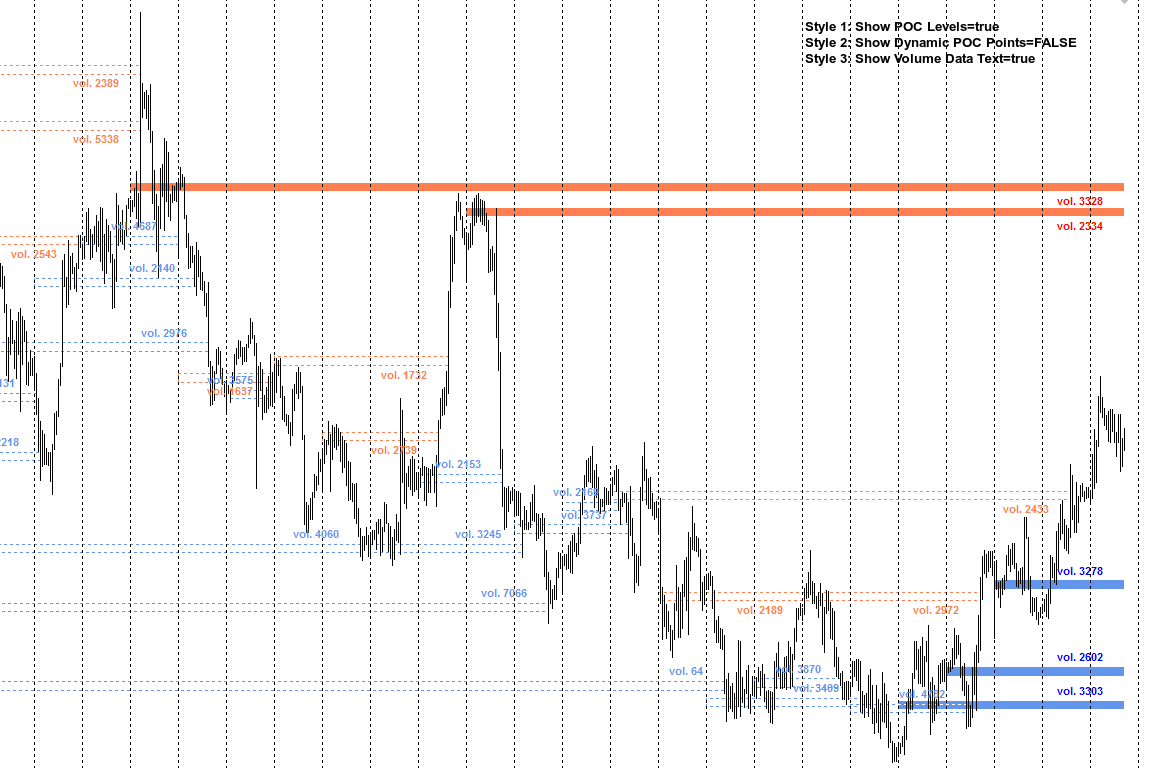
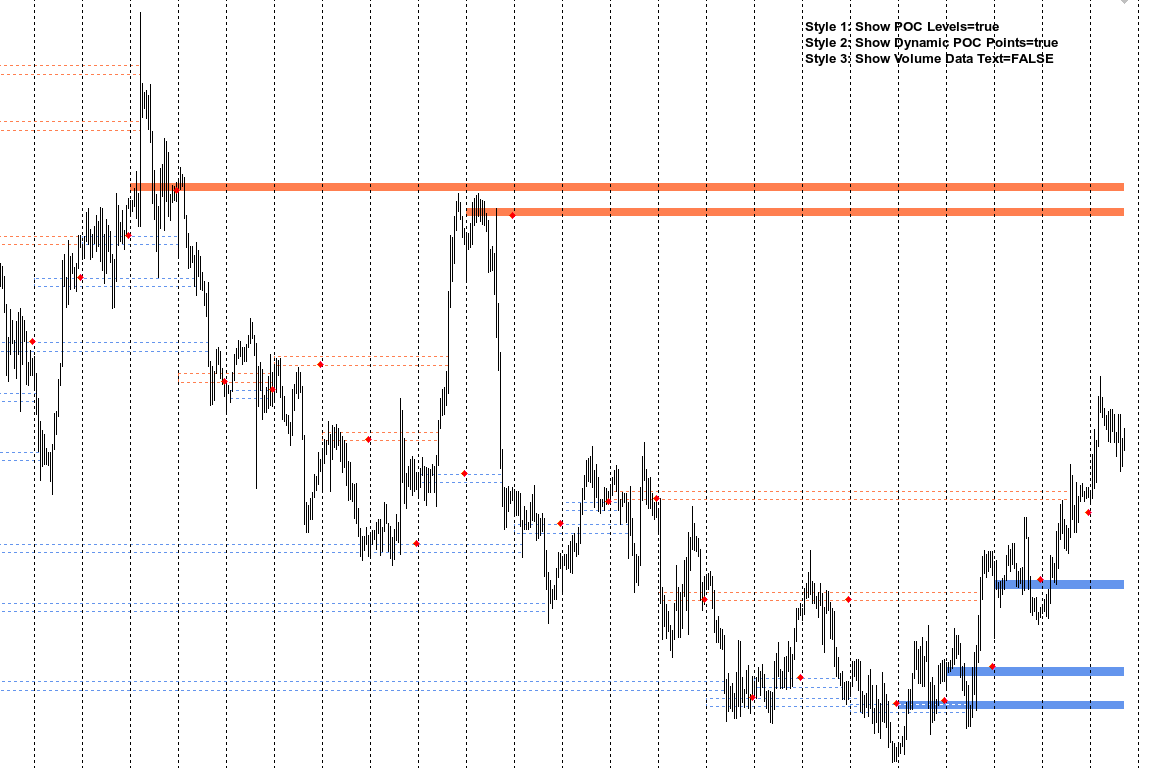
                Style 1: Show POC Levels - Shows or not Volume POC Levels. If the option is turned off, the option to show Dynamic POC Points is turned on by default.
                Style 2: Show Dynamic POC Points - Shows or not Dynamic POC Points.
                Style 3: Show Volume Data Text - Shows or not to display text with information about the amount of volumes for the POC level.

                Section "POC Levels Settings"
                POC Levels Sell color - Background color of POC Levels for Sell.
                POC Levels Buy color - Background color of POC Levels for Buy.
                POC Levels width in Pips - Specifies the width of the zone for POC levels in pips.
                Don't show POC Volumes less than - Filter to show or hide POC levels less than the specified amounts. When selected "0" displays all POC levels.

                Section "Dynamic POC Points Settings"
                DPOC Points width - Specifies the size of Dynamic POC Points.
                DPOC Points | Volume Data Text color - Specifies the color of Dynamic POC Points and data text.

                Section "Volume Level Data Text Settings"
                Volume Data Text font size - You can choose the data text size.
                Volume Data Text position in Pips - Position for displaying data text in pips.
                Sell Volume Data Text color - Data text color for Sell.
                Buy Volume Data Text color - Data text color for Buy.

                Section "Alert settings for POC Levels"
                Alert when Price entered at POC Level - Alert when price entered at POC Level.
                Alert when POC Level is closed - An alert occurs when the price closes the POC level.

                Section "Standard Calculation Settings"
                Show only Standard Calculation Settings - Enables or disables the default settings. If show only Standard calculation settings, Default calculation settings not working.

                Section "Default Calculation Settings"
                Default Number of Bars to calculate - Default number of Bars to calculate indicator.
                Default Volume Choice - You choose the volumes from which time frame to display on all lower time frames.

                Section "Standard Bars Calculation Settings"
                MN - Number of Bars to calculate - The number of monthly Bars to calculate the indicator.
                W1 - Number of Bars to calculate - The number of weekly Bars to calculate the indicator.
                D1 - Number of Bars to calculate - The number of daytime Bars to calculate the indicator.
                H4 - Number of Bars to calculate - The number of 4 hour Bars to calculate the indicator.
                H1 to M1 - Number of Bars to calculate - The number of Bars to calculate the indicator from a time frame lower than 4 hours.

                Section "Standard Volume Choice"
                In this section, you choose on which time frame to display the volumes of the time frame you have chosen for it...
                On D1 show Volumes from - W1
                On H4 show Volumes from - D1
                On H1 show Volumes from - D1
                On M30 show Volumes from - H4
                On M15 show Volumes from - H4
                On M5 show Volumes from - H4
                On M1 show Volumes from - H1

                  리뷰 4
                  elite luis
                  3331
                  elite luis 2023.03.27 04:44 
                   

                  Amazing POC indicator, Author is very Supportive and passionate to help user, Thanks alot :)

                  danmar
                  1344
                  danmar 2022.12.30 09:13 
                   

                  HI I have MR reversal but still i was missing something in scalping and be catch where i believe it was a good trend ! MR Volume POC levels 4 give me immediately the view of a potential reversal because volume buyers was > volume sellers already absorbed ! i have differents tools but this one give me an very interesting view of the players which really help me a lot in the 2 problematics : 1) when to go 2) when to be very alert of possible change of trend (at least a reversal who can take me out) Well done and again thanks for your advice in my question in comments of MR Reversal Thanks a lot warmly

                  laptoplifestyle
                  1794
                  laptoplifestyle 2022.10.10 23:08 
                   

                  Really awesome indicator, very powerful! I reached out to Sergey and his team regarding a bug fix and he reached out right away and released an update the next day that fixed the issue! Thanks for your support and wanting to help =) Looking forward to using your other products =)

                  추천 제품
                  Reverse side scalper is the manual trading system, that works on choppy(anti-trend) market. As a rule markets are on 80% choppy and only 20% is trend phase. System is based on custom step Moving and RSI and reverse pattern. System defines up movement, down movement, trend / choppy phases. Indicator plots Buy signal arrow when current direction is down and phase is trend, Sell signal arrow is plotted when currently is up movement and phase is trend. As a rule it allows to "catch" local maximum/mi
                  Max Volume
                  Maksim Slovakov
                  Подкрашивает аномально большие тиковые объёмы в красный цвет. Имеет следующие настройки: "Процент" по умолчанию "70"  (Процент на который аномальный объём должен быть больше предыдущего) "Уровень" по умолчанию "500" (Количество тиков, больше которого будем брать во внимание аномальный объём) Внимание! Данный индикатор был разработан для мелких таймфреймов M1,M5,M15. Идея в том, что на таких Таймфреймах увеличение количества тиков говорит об увеличении количество сделок, увеличения интереса к цен
                  Swing trading is a method in which traders attempt to take advantage of market fluctuations. They buy a security when they believe the market will rise and sell if they feel the market will fall, which, as you can imagine, is common in most trading strategies, irrespective of trading style. The four most frequently occurring patterns in the swing trading domain are reversal, retracement (or pullback), breakouts, and breakdowns. it work all currency pair, and work all timeframe 100% non repa
                  Market Secret
                  Ramzi Abuwarda
                  세계적인 바이너리 옵션 거래에서는 정확한 시장 분석과 전략적인 의사 결정이 핵심입니다. 수익성 있는 기회를 찾아내는 뛰어난 거래 지표를 찾는 여정은 끝이 없습니다. 비밀 지표(Secret Indicator)가 등장합니다 - 최고이며 강력한 MT4 바이너리 옵션 거래 도구로서의 명성을 얻은 주목할 만한 도구입니다. 비밀 지표는 경험있는 트레이더와 전문 프로그래머들로 구성된 팀에 의해 수년간의 세심한 연구, 개발 및 테스트를 통해 만들어졌습니다. 독특한 알고리즘과 고급 수학적 모델은 바이너리 옵션의 빠른 속도로 변동하는 세계에서 트레이더에게 무적의 이점을 제공하기 위해 정교하게 조정되었습니다. 비밀 지표를 다른 거래 지표와 구분 짓는 특징은 놀라운 정확도로 수익성 있는 거래 기회를 발견하는 능력입니다. 이 신호는 강력한 기술적 지표, 가격 행동 분석 및 시장 감성 평가의 조합에서 유도됩니다. 이 다각적 접근법은 비밀 지표가 단기 변동과 장기 추세 모두를 포착하여 트레이더에게 시
                  Scorpion Scalper Pro
                  Mohamed Amine Talbi
                  In the age of speed, everyone wants to gets what he/she wants quickly. Trading is all about gaining money, and scalping is a way of doing it in a short time. The "Scorpion Scalper Pro" has been named on the scorpion because of its speed. The indicator serves to provide signals for the M15 timeframe. It also sends Alerts (window alert, email alert, push notification alert) whenever a buy/sell signal occurs, and the alerts are customizable (they can be turned ON or OFF). Indicator inputs : - Buy
                  **바이너리 스마트 시스템 소개: 귀하의 궁극적인 트레이딩 파트너** 바이너리 스마트 시스템은 단순히 인디케이터가 아닙니다. 이는 정교한 트레이딩 도구로, 다양한 시장에서 핀포인트 정확도와 적시의 신호를 제공하여 트레이더에게 성공을 이끌어주는 데 주안점을 둔 것입니다. 혁신적인 알고리즘과 다양한 기술적 지표의 철저한 컬렉션을 기반으로 구축된 이 시스템은 트레이딩 성공을 얻기 위한 열쇠입니다. **인디케이터 구성 요소:** 1. **이동 평균 비율 (MAP):** 이 구성 요소는 다양한 이동 평균의 가중 평균을 계산하여 추세 식별을 위한 강력한 기준을 형성합니다. MAP은 시장 상황에 동적으로 적응하여 현재 추세 방향을 파악하는 정보를 제공합니다. 2. **상품 채널 지수 (CCI):** 평균 가격으로부터의 편차를 분석함으로써 CCI는 과매수 및 과매도 조건을 판단합니다. 바이너리 스마트 시스템의 CCI 통합은 잠재적인 반전 지점을 식별하는 종합적인 접근을 보장합니다.
                  Urgently
                  Tatiana Savkevych
                  The Urgently indicator is designed to quickly determine the situation in the market, reflect the state of the market and signal profitable levels for opening trades. Market conditions change quickly enough, requiring constant calibration of trading strategies. Recommended for use in conjunction with any of the oscillators. The Urgently forex market trend indicator shows the trend direction and entry points. It smooths out price fluctuations when generating a signal by averaging the data and the
                  PRO Renko System
                  Oleg Rodin
                  5 (24)
                  PRO Renko System 은 RENKO 차트 거래를 위해 특별히 고안된 매우 정확한 거래 시스템입니다. 이것은 다양한 거래 상품에 적용될 수있는 보편적 인 시스템입니다. 체계는 효과적으로 당신에게 정확한 반전 신호에 접근을 주는 소위 시장 소음을 중화합니다. 이 표시기는 사용하기가 매우 쉽고 신호 생성을 담당하는 매개 변수가 하나만 있습니다. 당신은 쉽게 당신의 선택의 어떤 무역 계기에 공구를 적응시킬 수 있고 renko 막대기의 크기. 나는 항상 당신이 내 소프트웨어로 수익성있게 거래 할 수 있도록 추가 지원을 제공 할 준비가되어 있습니다! 나는 당신에게 행복하고 수익성있는 거래를 기원합니다! 구매 후 저에게 연락하십시오! 내 렌코 차트 생성기를 보내드립니다. 또한 내 개인 권장 사항 및 시스템의 다른 모듈을 무료로 공유 할 것입니다!
                  Night ghost
                  Dmitriy Kashevich
                  Night Ghost - Arrow indicator for binary options. This is a reliable assistant to you in the future! - No redrawing on the chart -Works great on EUR/USD currency pairs! -Indicator accuracy up to 90% (Especially at night) -No long setup required (Perfectly set up for Binary Options) - Not late signals - The appearance of a signal on the current candle -Perfect for M1 period (No More!) - Eye-friendly candle color (Red and Blue) -Installed Alert Working with it: - Blue arrow
                  Dark Sniper
                  Dmitriy Kashevich
                  Dark Sniper arrow indicator. complete lack of redrawing percentage of correct indicator predictions from 80 85% The arrow indicates the direction of the next candle and the possible direction of the trend in the future.  suitable for small m1 timeframes. It is recommended to open deals from 1 to 2 candles. The signal appears on the last candle advantages of the indicator: 1. leading signals. 2.complete lack of redrawing 3. high signal accuracy.
                  OFFER!   OFFER ! After 3 weeks the unlimited price will be 500$ and in the future you will regret why you didn't make a purchase at this lowest price. Dear Traders, the atomic power Entries Indicator is one of the indicators that if used wisely and correctly can help you to find an edge over the market.  The indicator will work for all forex pairs, all markets and all timeframes. Still it is your duty to find the most effective timeframe for you. When the sell or buy arrow appears you will get a
                  Binary Option Signal
                  Yaroslav Varankin
                  Indicator for binary options arrow is easy to use and does not require configuration works on all currency pairs, cryptocurrencies buy signal blue up arrow sell signal red down arrow tips do not trade during news and 15-30 minutes before their release, as the market is too volatile and there is a lot of noise it is worth entering trades one or two candles from the current period (recommended for 1 candle) timeframe up to m 15 recommended money management fixed lot or fixed percentage of the depo
                  Magic Oscilator
                  REIVER YOHAN MOLINA
                  Oscillator based on data convergences between volume and liquidity. It is recommended to use it in pairs with high volume and liquidity of exchange, such as EURUSD. Preferably, in TF 4H or higher. How to use: When the lines converge and intersect in OVERPURCHASE, it is recommended to sell. When the lines converge and intersect in SURVEY, it is recommended to buy. Any questions, do not hesitate to contact me by chat for questions. If you consider it to be fake, or you feel that it works badl
                  Pips forex
                  Andrey Kozak
                  Pips forex - is a ready trading system . This indicator shows with arrows on the chart when and in what direction you need to open an order. If the arrow is green, then we open a buy deal, and if the arrow is red, then we open a sell deal. Everything is very simple and quite effective. TakeProfit set 15-25 points. StopLoss set at the level of points. When the dots move, we immediately override the StopLoss. Recommended timeframe for trading M1 and M5. This is a scalping strategy and works best
                  Quantum Currency Array Indicator
                  QUANTUM TRADING SOFTWARE LIMITED
                  This indicator has been developed to identify and display these trends quickly and easily, allowing you to see instantly, those currency pairs which are trending, and those which are not – and in all timeframes, with just one click. The 28 currency pairs are displayed as a fan as they sweep from strong to weak and back again, and this is why we call it the ‘currency array’. All 28 pairs are arrayed before you, giving an instant visual description of those pairs that are trending strongly, those
                  Blahtech VWAP
                  Blahtech Limited
                  5 (2)
                  Was: $69    Now: $34   Blahtech VWAP - Volume Weighted Average Price (VWAP) is the ratio of price to total volume. It provides an average price over a specified time interval.  Links [  Install  |  Update  |  Documentation   ] Feature Highlights Configurable VWAP Line Sessions, intervals, anchored or continuous Previous day settlement line Standard Deviation bands Alerts at bar close or real time Automatic Broker or Tick volumes Significantly reduced CPU usage Input Parameters Expert Advis
                  The indicator scans for stop grabber (special pattern of Joe Dinapoli which gives very high probability buy / sell signals and does not repaint ) signals in multiple timeframes for the all markets filtered and shows the results on Dashboard. Key Features Dashboard can be used for all markets It can scan for stop grabber pattern on MN1, W1, D1, H4, H1, M30, M15 ,M5, M1 timeframes Parameters UseMarketWatch: Set true to copy all symbols available in market watch MarketWatchCount : Set the numbe
                  Deal Trading SPT
                  Sukunthakan Ngernbamrung
                  Deal Trading SPT (Super Trend) is an indicator, shows the market trend direction, entry position, take profit level, stop loss level and trend strength. Utility Help to further filter and develop strategy to trade Market overview on the chart Stop loss and take profit calculation with market volatility Resistance and support for trialing stop No repaint after the finished bar Works in any timeframe and financial instrument, including forex, CFD and crypto etc. Message pop-up, notification wi
                  Scalping Snake Pro is a unique scalping indicator that shows the trader the price reversal moments and does not redraw. This indicator, unlike many others on the Internet, does not redraw its values. It draws signals on the very first bar, which allows you not to be late with opening deals. This indicator sends notifications to the trader by phone and email when a signal appears. You get all this functionality for only $147. How to trade with this indicator? Open the H1 timeframe. Currency pa
                  TPO Profile MT4
                  Kyra Nickaline Watson-gordon
                  5 (1)
                  Definition : TPO is a Time Price Opportunity. Instead of using bars or candles with an Open, High, Low, and Close price, each "bar" in a Market Profile is represented by horizontal bars against the price It is called Market Profile terminology. In other words time-price-opportunity (TPO) profiles are histograms of how much time was spent at each price within the span of the profile. By using a TPO chart, you are able to analyze the amount of trading activity, based on time, for each price lev
                  RelicusRoad Pro
                  Relicus LLC
                  4.78 (139)
                  이제 $ 147 (몇 가지 업데이트 후 $ 499 증가) - 무제한 계정 (PCS 또는 MACS) RelicusRoad 사용 설명서 + 교육 비디오 + 비공개 Discord 그룹 액세스 + VIP 상태 시장을 보는 새로운 방법 RelicusRoad는 외환, 선물, 암호화폐, 주식 및 지수에 대한 세계에서 가장 강력한 거래 지표로서 거래자에게 수익성을 유지하는 데 필요한 모든 정보와 도구를 제공합니다. 우리는 초보자부터 고급까지 모든 거래자가 성공할 수 있도록 기술적 분석 및 거래 계획을 제공합니다. 미래 시장을 예측할 수 있는 충분한 정보를 제공하는 핵심 거래 지표입니다. 우리는 차트에서 말이 안 되는 여러 지표 대신 완전한 솔루션을 믿습니다. 타의 추종을 불허하는 매우 정확한 신호, 화살표 + 가격 조치 정보를 표시하는 올인원 표시기입니다. 강력한 AI를 기반으로 하는 RelicusRoad는 누락된 정보와 도구를 제공하여 교육하고 성공적인 트레이더인 트레이딩 전문
                  소개: 바이너리 옵션과 외환 거래의 빠르게 변화하는 세계에서, 성공과 실패의 차이를 만들 수 있는 도구와 전략을 갖추는 것이 중요합니다. 이러한 도구 중 하나는 BBB 블랙 블루 바이너리 옵션 지표 시스템으로, 차트 패턴, 이동 평균, 거래량을 결합하여 거래자가 정보에 입각한 결정을 내릴 수 있도록 하는 혁신적인 접근 방식입니다. 이 포괄적인 가이드에서는 BBB 시스템의 세부 사항을 설명하고, 작동 방식, 언제 사용해야 하는지, 그리고 어떻게 하면 거래 성과를 향상시킬 수 있는지 설명합니다. BBB 지표 시스템 설명: BBB 블랙 블루 바이너리 옵션 지표 시스템은 바이너리 옵션과 외환 거래의 최적의 진입 및 퇴출 지점을 식별하는 데 도움이 되는 정교한 기술적 분석 도구입니다. 이 시스템은 "블랙"과 "블루"라는 주요 신호를 나타내는 기본 구성 요소에서 이름을 따왔습니다. 차트 패턴: BBB 시스템은 거래 차트의 계산된 부분을 분석하여 시작합니다. 이는 가격 행동에서 특정 패턴이나 형
                  Zig Zag Level
                  Pavel Verveyko
                  The indicator implements the author's approach to the construction of the popular "Zig-Zag" indicator. The advantages of the "ZIgZag Level" indicator is that it filters out market noise and shows levels. "ZIg Zag Level" is based on peaks and troughs, displays levels. These levels can be disabled and configured. The indicator displays the price of the level, the price tag can be disabled. The "zigzag" line between the points can also be disabled. The indicator has a built-in notific
                  The Market Sentiment Meter indicator calculates the saturation levels of the price chart. A signal to exit the oversold zone indicates a buying opportunity, and a signal to exit the overbought zone indicates a selling opportunity. Typically, for this indicator you need to set relative values for the overbought (Top) and oversold (Bottom) levels. Often a good trend can be seen visually on the price chart. However, an experienced trader must clearly understand the current distribution of forces
                  Oberis
                  Alfredo Jose Garcia Carrero
                  주문 차단 표시기로 거래를 개선하고 싶습니까? 주문 블록은 매수 또는 매도 주문이 누적되어 추세 변화 또는 강력한 움직임을 유발할 수 있는 시장 영역입니다. 이러한 주문 블록을 식별하면 진입 및 청산 기회를 찾고 위험과 수익을 관리하는 데 매우 유용할 수 있습니다. 그러나 이러한 주문 블록을 수동으로 찾는 것은 어렵고 지루할 수 있습니다. 이것이 우리가 차트에서 이러한 블록을 자동으로 감지하고 표시하는 데 도움이 되는 MetaTrader 4용 주문 블록 표시기인 Oberis를 만든 이유입니다. Oberis는 어떻게 작동하나요? Oberis는 시장에서 가장 관련성이 높은 주문 블록을 식별하기 위해 가격과 거래량을 분석하는 지표입니다. 이러한 주문 블록은 강세인지 약세인지에 따라 녹색 또는 빨간색 사각형으로 표시됩니다.  Oberis는 사용하기 매우 쉽습니다. MetaTrader 4에 설치하고 거래하려는 통화 쌍 또는 자산의 차트에 적용하기만 하면 됩니다. Oberis는 모든 기간 및
                  ADM Multiframe
                  Dmitriy Susloparov
                  ADM Oscillator Multiframe Unlike the classic indicator " Average Direction Movement index ", this indicator shows directly the difference between the +DI and -DI values. When +DI is greater than -DI results above zero and vice versa. This is more visual and, in addition, allows you to clearly see the interaction of indicator readings for different timeframes. It also uses a proprietary technology that allows you to see different timeframes simultaneously on a single time scale. For example, f
                  Williams Vix Fix MT4
                  Diego Arribas Lopez
                  MT5 Version Williams Vix Fix MT4 Need help trying to time the bottoms in the market? Williams Vix Fix MT4 is based on the volatility of the market and grants a huge support for finding out when a correction is comming to its end. TRY IT FOR FREE NOW! Williams Vix Fix MT4 derivates from Larry Williams's VixFix indicator addapted for fitting   every asset class . VIX reprensents the fear and greed in the market based on its volatility. A high VIX value shows fear in the market, this is usually a
                  The new update makes this indicator a complete tool for studying, analyzing and operating probabilistic patterns. It includes: On-chart Multi-asset percentage monitor. Configurable martingales. Twenty-one pre-configured patterns , including Mhi patterns and C3. An advanced pattern editor to store up to 5 custom patterns. Backtest mode to test results with loss reports. Trend filter. Hit operational filter. Martingale Cycles option. Various types of strategies and alerts. Confluence between patte
                  The King of Forex Trend Cloud Indicator is a trend following indicator based on moving averages. The Indicator is meant to Capture both the beginning and the end of a trend. This indicator can be used to predict both short and long terms market trends.  The king of Forex Trend Cloud if paired together with the King of Forex Trend Indicator can give a broad picture in market analysis and forecasts. I have attached images for both the  The king of Forex Trend Cloud on its own and  The king of Fore
                  Candle EA MT4
                  Mansour Babasafary
                  4.58 (38)
                  This expert is based on patterns The main patterns of this specialist are candlestick patterns Detects trends with candlestick patterns It has a profit limit and a loss limit, so it has a low risk The best time frame to use this expert is M30 time frame The best currency pairs to use with this expert is the EURUSD, GBPUSD, AUDUSD, USDCAD currency pairs The price will increase by 100$ after every 10 purchases! Final price 2450$ Get a 50% bonus by buying (or even renting) any of our product
                  이 제품의 구매자들이 또한 구매함
                  기적적인 외환 지표 소개: 정확한 트레이딩의 힘을 발휘하세요 모든 시간대에서 뛰어난 결과를 제공하는 최고의 외환 지표를 찾는데 지친 적이 있나요? 더 이상 찾을 필요가 없습니다! 기적적인 외환 지표가 도래하여 귀하의 트레이딩 경험을 혁신하고 수익을 새로운 고도로 끌어올립니다. 최첨단 기술과 수년간의 정성스런 개발을 토대로 기적적인 외환 지표는 외환 시장에서의 힘과 정확성의 정점으로 떠오릅니다. 이 탁월한 도구는 모든 수준의 트레이더의 요구를 충족시키고 지속적인 수익을 추구하는 데에서 비길 데 없는 우위를 제공하기 위해 설계되었습니다. 기적적인 외환 지표의 가장 큰 장점은 그 뛰어난 적응성에 있습니다. 당신이 데이 트레이더, 스윙 트레이더이든 장기 포지션을 선호하든, 이 지표는 모든 시간대에서 뛰어난 결과를 제공하기 위해 최적화되었습니다. 그러나 그 정확성과 시장의 복잡한 움직임을 포착하는 능력이 참으로 빛을 발하는 것은 1시간 기간대에서 사용할 때입니다. 기적적인 외환 지표의 정확성
                  현재 20% 할인 ! 초보자 또는 전문가 트레이더를 위한 최고의 솔루션! 이 대시보드 소프트웨어는 28개의 통화 쌍에서 작동합니다. 2가지 주요 지표(Advanced Currency Strength 28 및 Advanced Currency Impulse)를 기반으로 합니다. 전체 Forex 시장에 대한 훌륭한 개요를 제공합니다. 고급 통화 강도 값, 통화 이동 속도 및 모든(9) 시간대의 28 Forex 쌍에 대한 신호를 보여줍니다. 추세 및/또는 스캘핑 기회를 정확히 파악하기 위해 차트의 단일 지표를 사용하여 전체 시장을 볼 수 있을 때 거래가 어떻게 개선될지 상상해 보십시오! 잠재적인 거래를 식별하고 확인하면서 강력한 통화와 약한 통화를 더욱 쉽게 식별할 수 있도록 이 지표에 기능을 내장했습니다. 이 표시기는 통화의 강세 또는 약세가 증가 또는 감소하는지 여부와 모든 시간대에서 수행되는 방식을 그래픽으로 보여줍니다. 추가된 새로운 기능은 현재 시장 조건 변화에 적
                  TPSpro RFI Levels
                  Roman Podpora
                  5 (13)
                  A key element in trading is zones or levels from which decisions to buy or sell a trading instrument are made. Despite attempts by major players to conceal their presence in the market, they inevitably leave traces. Our task was to learn how to identify these traces and interpret them correctly. Reversal First Impulse levels (RFI)   -  Version MT5                INSTRUCTIONS                 RUS                 ENG                                       R ecommended to use with an indicator   -  
                  Atomic Analyst
                  Issam Kassas
                  5 (1)
                  우선적으로 언급할 점은이 거래 지표가 다시 그리지 않고 지연되지 않으며 이를 통해 수동 및 로봇 거래 모두에 이상적이라는 점입니다. Atomic Analyst는 가격의 강도와 모멘텀을 활용하여 시장에서 더 나은 이점을 찾는 PA Price Action Indicator입니다. 고급 필터를 장착하여 잡음과 거짓 신호를 제거하고 거래 잠재력을 높이는 데 도움이 됩니다. 복잡한 지표의 다중 레이어를 사용하여 Atomic Analyst는 차트를 스캔하고 복잡한 수학적 계산을 간단한 신호와 색상으로 변환하여 초보 트레이더가 이해하고 일관된 거래 결정을 내릴 수 있도록합니다. "Atomic Analyst"는 새로운 및 경험이 풍부한 트레이더를위한 종합적인 거래 솔루션입니다. 프리미엄 지표와 최고 수준의 기능을 하나의 거래 전략에 결합하여 모든 종류의 트레이더에 대한 다재다능한 선택지가되었습니다. 인트라데이 거래 및 스캘핑 전략 : 빠르고 정확한 일일 거래 및 단기 거래를 위해 설계
                  TrendMaestro
                  Stefano Frisetti
                  5 (2)
                  note: this indicator is for METATRADER4, if you want the version for METATRADER5 this is the link: TRENDMAESTRO recognizes a new TREND in the bud, he never makes mistakes. The certainty of identifying a new TREND is priceless. DESCRIPTION TRENDMAESTRO identifies a new TREND in the bud, this indicator examines the volatility, volumes and momentum to identify the moment in which there is an explosion of one or more of these data and therefore the moment in which prices have strong probability of f
                  XQ Indicator MetaTrader 4
                  Marzena Maria Szmit
                  3 (2)
                  Step into the realm of Forex trading with confidence and precision using XQ, a cutting-edge Forex indicator designed to elevate your trading game to unprecedented heights. Whether you're a seasoned trader or just stepping into the world of currency exchange,   XQ Forex Indicator   empowers you with the insights and signals needed to make informed trading decisions. The signal conditions are a combination of three indicators, and XQ Forex Indicator only display  medium and long-term trends . The
                  ON Trade Waves Patterns Harmonic Elliot Wolfe를 소개합니다. 이는 수동 및 자동 방법을 사용하여 다양한 시장 패턴을 감지하기 위해 개발된 고급 지표입니다. 다음은 그 작동 방식입니다: 조화적 패턴: 이 지표는 차트에 나타나는 조화적 패턴을 식별할 수 있습니다. 이러한 패턴은 Scott Carney의 "Harmonic Trading vol 1 및 2"에서 설명한 것처럼 조화적 거래 이론을 연습하는 트레이더에게 중요합니다. 수동으로 그리든 자동 감지를 사용하든 ON Trade Waves Patterns가 도움을 줄 것입니다. 컨트롤 패널: 이 지표에는 사용자 친화적인 컨트롤 패널이 있습니다. 차트 및 시간 프레임 설정을 저장하여 다양한 구성 간에 쉽게 전환할 수 있습니다. 차트 공간을 최대화하려면 최소화할 수도 있습니다. 다른 분석 도구를 사용하는 것을 선호하는 경우 닫기 버튼을 클릭하여 모든 지표 데이터를 숨길 수 있습니다. 템플릿 저장: 설정을 사
                  TakePropips Donchian Trend Pro
                  Eric John Pajarillaga Aldana
                  4.82 (17)
                  TakePropips Donchian Trend Pro   (MT4)는 Donchian 채널을 사용하여 추세의 방향을 자동으로 감지하고 진입 및 퇴장 거래 신호를 제공하는 강력하고 효과적인 도구입니다! 이 다기능 지표에는 추세 스캐너, 거래 신호, 통계 패널, 스크리너, 거래 세션 및 경고 내역 대시보드가 포함됩니다. 거래 신호를 제공하고 차트 분석 시간을 절약하도록 설계되었습니다! 다음 블로그 게시물에서 사용자 설명서 및 설치 가이드를 다운로드할 수 있습니다.   https://www.mql5.com/en/blogs/post/751368 오늘 50% 할인을 받으세요! 가격이 $98에서 $49로 인하되었습니다! 전략 테스터에서 이 지표를 테스트할 수 있습니다(비주얼 모드 활성화). 실시간 차트에서 테스트하고 싶다면 저에게 메시지를 보내 7일 평가판을 받을 수도 있습니다. 자세한 내용은 설명 아래에 비디오 자습서도 제공됩니다. 질문이 있거나 도움이 필요하면 저에게 연락하십시오.
                  FX Volume
                  Daniel Stein
                  4.6 (35)
                  모닝 브리핑을 통해 세부 정보와 스크린샷으로 매일 시장 업데이트를 받으세요 여기 mql5 및 텔레그램에서 FX 거래량은 브로커의 관점에서 시장 심리에 대한 실제 통찰력을 제공하는 최초이자 유일한 거래량 지표입니다. 브로커와 같은 기관 시장 참여자가 외환 시장에서 어떤 포지션을 취하고 있는지에 대한 훌륭한 통찰력을 COT 보고서보다 훨씬 빠르게 제공합니다. 차트에서 이 정보를 직접 확인하는 것은 트레이딩의 진정한 판도를 바꾸고 획기적인 솔루션입니다. 다음과 같은 고유한 시장 데이터 인사이트의 이점 비율 는 통화의 매수/매도 포지션 비율을 백분율로 표시 비율 변화 는 선택한 기간 내 매수 비율과 비율 변화를 표시 총 거래량 는 해당 통화의 총 거래량(롱 및 숏)을 로트 단위로 보여줍니다 Volumes Long 는 해당 통화의 모든 롱 포지션의 거래량을 보여줍니다 Volumes Short 는 해당 통화의 모든 숏 포지션의 거래량을 보여줍니다 Net Long 는 순 롱 포지션의 거래량
                  Cycle Sniper
                  Elmira Memish
                  4.41 (34)
                  NEW YEAR SALE PRICE FOR LIMITED TIME!!! Please contact us after your purchase and we will send you the complimentary indicators to complete the system Cycle Sniper is not a holy grail but when you use it in a system which is explained in the videos, you will feel the difference. If you are not willing to focus on the charts designed with Cycle Sniper and other free tools we provide, we recommend not buying this indicator. We recommend watching the videos about the indiactor and system before pu
                  Gann Signal
                  Kirill Borovskii
                  Gann Signal is a very simple indicator at first glance, but hidden inside is many years of experience in studying W.D.Ganna methods. The indicator gives accurate BUY/SELL signals, without redrawing. The indicator is very easy to use. All you need to do is attach it to your chart and follow its recommendations. The indicator constantly analyzes the market for entry opportunities. When such an opportunity appears, the indicator gives a signal in the form of an arrow. I repeat, all signals are NOT
                  Ultimate Sniper Dashboard
                  Hispraise Chinedum Abraham
                  4.84 (25)
                  299달러로 할인! 추후 가격이 인상될 수 있습니다! 아래 설명을 읽어보세요! Ultimate Sniper Dashboard를 위한 최고의 엔트리 시스템: ULTIMATE DYNAMIC LEVELS. (내 제품을 확인하십시오) Ultimate Sniper Dashboard는 MT4 다중 통화 테스트 제한으로 인해 라이브 시장에서만 작동합니다. Ultimate-Sniper 대시보드를 소개합니다! HA-Sniper와 MA-Sniper를 모두 포함하는 최고의 제품입니다. 그리고 많은 특수 모드. Ultimate Sniper Dashboard는 절대 야수입니다! 초보자 또는 전문가 트레이더를 위한 최고의 솔루션! 다시 움직임을 놓치지 마세요! 단순함과 핍을 좋아하는 트레이더를 위해 특별한 제품을 준비했습니다. 본질적으로 단순한 대시보드는 여러 사용자 지정 알고리즘을 기반으로 28개의 통화 쌍을 살펴보는 모든 작업을 수행합니다. 단 하나의 차트로 전문가처럼 시장을 읽을 수 있습니다. 움직이기
                  Gann Swing Structure
                  Kirill Borovskii
                  5 (1)
                  This indicator is based on the mathematics of the great trader W.D. Ganna. With its help, you can easily find strong levels by analyzing swings to find the optimal entry point. The indicator works on all instruments and all timeframes. The indicator is fully manual and has control buttons. All you need to do is press the NEW button, a segment will appear, which you can place on any movement, swing or even 1 candle that you want to analyze. By placing the segment, press the OK button. A grid (th
                  ON Trade Optuma Astro
                  Abdullah Alrai
                  5 (4)
                  물론입니다. 아래는 제공해주신 텍스트의 한국어 번역입니다: MT4용 천문학 지표 소개: 귀하의 최상급 하늘 트레이딩 동반자 트레이딩 경험을 천체의 높이로 끌어올리기 준비가 되셨나요? MT4용 천문학 지표를 소개합니다. 이 혁신적인 도구는 복잡한 알고리즘의 힘을 활용하여 탁월한 천문학적 통찰과 정밀한 계산을 제공합니다. 정보의 우주를 손에 담다: 천문학적 데이터의 보물함을 드러내는 포괄적인 패널을 살펴보세요. 행성의 지오/헬리오센트릭 좌표, 태양/지구 거리, 크기, 길이, 별자리, 황도 좌표 및 적도 좌표, 심지어 수평 좌표 등 각각이 정밀하게 계산되고 아름답게 제시됩니다. 지표에 의해 생성된 수직선은 시간 값에 해당하여 트레이딩 여정에 우주적인 시각을 부여합니다. 행성 라인과 관계: 수정 가능한 스케일과 각도로 차트를 장식하는 행성 라인의 마법을 경험해보세요. 직관적인 컨트롤 패널을 통해 각 행성의 라인의 가시성을 손쉽게 전환할 수 있습니다. 쥰션이나 섹스타일, 사분각, 삼분각, 트
                  Weis Wave with Alert
                  Trade The Volume Waves Single Member P.C.
                  4.79 (19)
                  Rental/Lifetime Package Options and Privileges' * For optimum results the yearly or lifetime package is suggested due to live training and Discord  channel trading with the  creator! Rent Monthly Six Months   Yearly/Lifetime Weis Wave with Speed with Alert+Speed Index x x x Manual  x x x Quick Set up Video x x x Blog x x x Lifetime Updates x x x Setup and Training Material x x Free Rectangle Break Alert Tool      x Discord Access Channel "The SI traders" x 2-hour live methodology traini
                  Supply and Demand Dashboard PRO
                  Bernhard Schweigert
                  4.82 (22)
                  현재 20% 할인! 이 대시보드는 여러 기호와 최대 9개의 타임프레임에서 작동하는 매우 강력한 소프트웨어입니다. 주요 지표(최상의 리뷰: 고급 공급 수요)를 기반으로 합니다.   Advanced Supply Demand 대시보드는 훌륭한 개요를 제공합니다. 다음과 같이 표시됩니다.  영역 강도 등급을 포함하여 필터링된 공급 및 수요 값, 영역에 대한/및 영역 내 Pips 거리, 중첩된 영역을 강조 표시하고 모든 (9) 시간 프레임에서 선택한 기호에 대해 4가지 종류의 경고를 제공합니다. 그것은 당신의 개인적인 필요에 맞게 고도로 구성 가능합니다! 당신의 혜택! 모든 트레이더에게 가장 중요한 질문: 시장에 진입하기에 가장 좋은 수준은 무엇입니까? 최고의 성공 기회와 위험/보상을 얻으려면 강력한 공급/수요 영역 내 또는 그 근처에서 거래를 시작하십시오. 손절매를 위한 최적의 장소는 어디입니까? 가장 안전하려면 강력한 수요/공급 구역 아래/위에 정
                  Gann Price Level
                  Kirill Borovskii
                  The indicator is designed to work on any trading platform. The program is based on proprietary algorithms and W.D.Ganna's mathematics, allowing you to calculate target levels of price movement based on three points with the highest degree of certainty. It is a great tool for stock trading. The indicator has three buttons: NEW - call up a triangle for calculation. DEL - delete the selected triangle. DELS - completely remove all constructions. The probability of achieving the goals is more than 80
                  TPA True Price Action indicator reveals the true price action of the market makers through 100% non-repainting signals (except early signals mode) strictly at the close of a candle! TPA shows entries and re-entries, every time the bulls are definitely stronger than the bears and vice versa. Not to confuse with red/green candles. The shift of power gets confirmed at the earliest stage and is ONE exit strategy of several. There are available now two free parts of the TPA User Guide for our custo
                  Please send me Direct message on MQL5 CHAT after purchasing the Indicator for Training and Installation Support There are some additional files that is important to use with the Indicator . So be sure to contact me after purchasing the Indicator So that I can add you for training and support . If you find any difficulty with installation then send me Direct message here So that I can connect with you via Anydesk or Teamview for the product installation. " Smart Order Block Indicator " to find
                  How to use Pair Trading Station Pair Trading Station is recommended for H1 time frame and you can use it for any currency pairs. To generate buy and sell signal, follow few steps below to apply Pair Trading Station to your MetaTrader terminal. When you load Pair Trading Station on your chart, Pair Trading station will assess available historical data in your MetaTrader platforms for each currency pair. On your chart, the amount of historical data available will be displayed for each currency pai
                  The BB Reversal Arrows technical trading system has been developed to predict reverse points for making retail decisions. The current market situation is analyzed by the indicator and structured for several criteria: the expectation of reversal moments, potential turning points, purchase and sale signals. The indicator does not contain excess information, has a visual understandable interface, allowing traders to make reasonable decisions. All arrows appear to close the candle, without redr
                  Ferox Breakout
                  Tat Dat Nguyen
                  The breakout algorithm is a technique based on price, price features, to shape a breakout strategy. The strategy in this indicator will not be redrawn (none-repaint indicator), it is suitable for short or long term traders In the screenshot is the EURUSD pair, these currency pairs, commodities or stocks, it have similar strength *Non-Repainting (not redrawn) *For Metatrader4 Only *Great For Scalping *Great For Swing Trading *Arrow Entry, Green is Long, Red is Short *Works On Any Timeframe *Work
                  Indicator : RealValueIndicator Description : RealValueIndicator is a powerful tool designed specifically for trading on the EURUSD pair. This indicator analyzes all EUR and USD pairs, calculates their real currency strength values, and displays them as a single realistic value to give you a head start on price. This indicator will tell you moves before they happen if you use it right. RealValueIndicator allows you to get a quick and accurate overview of the EURUSD currency pair tops and bottoms,
                  IA Trendx3 PRO
                  Marco Aurelio Santos Costa
                  What if God Created a Trade System? No miracles... Just see how mathematics can be effective in the market. We managed to combine technical analysis / price action into indicators, creating the best setup for trading, be it in Forex, Indices, or stocks. It took us 2 years to create something that really works, and now it's time for you to discover it. TrendX3 is a revolution in trend analysis. Based on advanced algorithms and real-time data, it provides valuable insights so that you can make inf
                  Volatility Trend System - a trading system that gives signals for entries. The volatility system gives linear and point signals in the direction of the trend, as well as signals to exit it, without redrawing and delays. The trend indicator monitors the direction of the medium-term trend, shows the direction and its change. The signal indicator is based on changes in volatility and shows market entries. The indicator is equipped with several types of alerts. Can be applied to various trading
                  Introduction Excessive Momentum Indicator is the momentum indicator to measure the excessive momentum directly from raw price series. Hence, this is an extended price action and pattern trading. Excessive Momentum Indicator was originally developed by Young Ho Seo. This indicator demonstrates the concept of Equilibrium Fractal Wave and Practical Application at the same time. Excessive Momentum detects the market anomaly. Excessive momentum will give us a lot of clue about potential reversal and
                  System Trend Pro
                  Aleksandr Makarov
                  System Trend Pro - This is the best trend trading indicator!!! The indicator no repaint!!!   The indicator has   MTF   mode, which adds confidence to trading on the trend (   no repaint   ). How to trade? Everything is very simple, we wait for the first signal (big arrow), then wait for the second signal (small arrow) and enter the market in the direction of the arrow. (See screens 1 and 2.) Exit on the opposite signal or take 20-30 pips, close half of it, and keep the rest until the oppo
                  Full Forex Market View Dashboard
                  Opengates Success International
                  5 (2)
                  전체 외환 시장 보기 대시보드 표시기 이것은 거래자에게 시장에서 일어나는 일에 대한 전체 보기를 제공하기 위해 만들어진 사용자 지정 지표입니다. 실시간 데이터를 사용하여 시장에 액세스하고 성공적인 거래에 필요한 모든 정보를 표시합니다. 설치: 이 지표를 창 차트에 첨부하기 전에 MT4의 Market Watch 패널로 이동하여 필요하지 않거나 거래하지 않는 모든 통화 쌍을 숨기고 나머지는 그대로 두십시오. 그 이유는 FFMV 대시보드가 MT4의 Market Watch에 나타나는 모든 통화 쌍을 표시하기 때문입니다. 최대 30개 이하의 통화 쌍을 표시할 수 있습니다. MT4의 Market Watch에서 그 이상이면 FFMV 대시보드의 글꼴과 이미지가 흐려지고 변형됩니다! 제대로 표시되지 않습니다. 용법:      솔로 트레이딩      바구니 거래의 경우(방법에 대한 스크린샷 참조)      다중 주문 거래에도 사용할 수 있습니다.      자신의 거래
                  A. A2SR이란 무엇입니까 ?   * 선행 기술 지표입니다(재도장 없음, 지연 없음). -- 안내 : https://www.mql5.com/en/blogs/post/734748/page4#comment_16532516 -- 및 https://www.mql5.com/en/users/yohana/blog A2SR에는 지원(수요) 및 저항(공급) 수준을 결정하는 특별한 기술이 있습니다. 우리가 인터넷에서 본 일반적인 방식과 달리 A2SR은 실제 SR 수준을 결정하는 독창적인 개념을 가지고 있습니다. 원래 기술은 인터넷에서 가져온 것이 아니며 인터넷에 게시된 적도 없습니다. A2SR은 거래 스타일에 따라 SR 수준을 자동으로 선택합니다. 시간 프레임을 변경해도 SR 레벨은 그대로 유지됩니다. 사용하는 시간 프레임에서 실제 SR을 얻지 못하기 때문입니다. A2SR은 거래를 위한 완전한 상품을 보유하고 있습니다 . 실제 지원(수요) 및 저항(공급)에 대한 진정한 개념. 뉴스 이벤트
                  SMCpro VIP MT4  Original Price  $620   ---  Currently Price 20% OFF ( for unlimited use )   BONUS  AUX VIP Club 2024 : Include  EA Airbag  and  Load Data History  to enhance the performance of this tool to its maximum potential  Click Here to Download Files   ( for users only )   Hello World! Introducing.. SMCpro VIP tool and Indicator for MetaTrader 4, designed to revolutionize your trading experience with the ICT Smart Money Concept. This system is meticulously crafted to empower trad
                  제작자의 제품 더 보기
                  MR Reversal Patterns 4
                  Sergey Khramchenkov
                  5 (2)
                  In the "Masters of Risk" trading system, one of the main concepts is related to places where markets change direction. In fact, this is a change in priority and a violation of the trend structure at the extremes of the market, where supposedly there are or would be stop-losses of "smart" participants who are outside the boundaries of the accumulation of volume. For this reason, we call them "Reversal Patterns" - places with a lot of weight for the start of a new and strong trend. Some of the imp
                  MR Volume POC Levels 5
                  Sergey Khramchenkov
                  The most crucial price level in any "Volume Profile" is the "Point of Control" . Is the price level with the highest traded volume. And mainly, is the level where the big guys start there their positions, so it's an accumulation/distribution level for smart money. The idea of the indicator arose after the "MR Volume Profile Rectangles" indicator was made. When creating the "MR Volume Profile Rectangles" indicator, we spent a lot of time comparing the volumes with those from the volume profil
                  MR Range Breakouts 5
                  Sergey Khramchenkov
                  5 (2)
                  " A trading range occurs when a financial instrument trades between constant high and low prices over a period of time. The upper part of the trading range of a financial instrument often provides price resistance, while the lower part of the trading range usually offers price support.  Traders can enter in the direction of a breakout or breakdown from a trading range... " This is the "Classical Theory" understanding of ranges. We have a different understanding of the nature of ranges and th
                  MR Reversal Patterns 5
                  Sergey Khramchenkov
                  5 (1)
                  In the "Masters of Risk" trading system, one of the main concepts is related to places where markets change direction. In fact, this is a change in priority and a violation of the trend structure at the extremes of the market, where supposedly there are or would be stop-losses of "smart" participants who are outside the boundaries of the accumulation of volume. For this reason, we call them "Reversal Patterns" - places with a lot of weight for the start of a new and strong trend. Some of the im
                  A "Volume Profile" is an advanced charting indicator that displays total volume traded at every price level over a user specified time period. The main components of the volume profile are POC ( Point Of Control - the price level, at which the maximum number of contracts were executed during a selected period), VAH ( Value Area High - the highest price in the Value Area) and VAL ( Value Area Low - the lowest price in the Value Area). When we settled on the original indicator, we spent a lot o
                  MR Range Breakouts 4
                  Sergey Khramchenkov
                  5 (1)
                  " A trading range occurs when a financial instrument trades between constant high and low prices over a period of time. The upper part of the trading range of a financial instrument often provides price resistance, while the lower part of the trading range usually offers price support.  Traders can enter in the direction of a breakout or breakdown from a trading range... " This is the "Classical Theory" understanding of ranges. We have a different understanding of the nature of ranges and th
                  MR Dynamic POC 4
                  Sergey Khramchenkov
                  The most crucial price level in any "Volume Profile" is the "Point of Control" . Is the price level with the highest traded volume. And mainly, is the level where the big guys start there their positions, so it's an accumulation/distribution level for smart money. The idea of the indicator arose after the "MR Volume Profile Rectangles" indicator was made. When creating the "MR Volume Profile Rectangles" indicator, we spent a lot of time comparing the volumes with those from the volume profil
                  MR Trend Corrections 4
                  Sergey Khramchenkov
                  We publish the indicator as a useful tool in trading and call this indicator the "Swiss Army Knife" because it provides many possibilities and combinations to help understand the material on the "Masters of Risk" trading system. The indicator itself is not part of the tools used in the "Masters of Risk" trading system. The indicator consists of 3 separate multi-timeframe indicators, which in combination with each other help to reduce the "noise" of false signals. The first of the indicators ar
                  "Sentiments of traders" in the financial markets is a topic that has been of interest to us for a long time. In time, we could not find the right formula to define these sentiments. We went through many stages in the search for the right methodology - from taking data from external sources to calculate open positions of buyers and sellers to calculating tick volumes, but still we were not satisfied with the results. The calculation of open positions of buyers and sellers from external sources ha
                  A "Volume Profile" is an advanced charting indicator that displays total volume traded at every price level over a user specified time period. The main components of the volume profile are POC ( Point Of Control - the price level, at which the maximum number of contracts were executed during a selected period), VAH ( Value Area High - the highest price in the Value Area) and VAL ( Value Area Low - the lowest price in the Value Area). When we settled on the original indicator, we spent a lot o
                  MR Dynamic POC 5
                  Sergey Khramchenkov
                  The most crucial price level in any "Volume Profile" is the "Point of Control" . Is the price level with the highest traded volume. And mainly, is the level where the big guys start there their positions, so it's an accumulation/distribution level for smart money. The idea of the indicator arose after the "MR Volume Profile Rectangles" indicator was made. When creating the "MR Volume Profile Rectangles" indicator, we spent a lot of time comparing the volumes with those from the volume profil
                  MR Trend Corrections 5
                  Sergey Khramchenkov
                  We publish the indicator as a useful tool in trading and call this indicator the "Swiss Army Knife" because it provides many possibilities and combinations to help understand the material on the "Masters of Risk" trading system. The indicator itself is not part of the tools used in the "Masters of Risk" trading system. The indicator consists of 3 separate multi-timeframe indicators, which in combination with each other help to reduce the "noise" of false signals. The first of the indicators ar
                  "Sentiments of traders" in the financial markets is a topic that has been of interest to us for a long time. In time, we could not find the right formula to define these sentiments. We went through many stages in the search for the right methodology - from taking data from external sources to calculate open positions of buyers and sellers to calculating tick volumes, but still we were not satisfied with the results. The calculation of open positions of buyers and sellers from external sources ha
                  필터:
                  elite luis
                  3331
                  elite luis 2023.03.27 04:44 
                   

                  Amazing POC indicator, Author is very Supportive and passionate to help user, Thanks alot :)

                  Sergey Khramchenkov
                  2071
                  개발자의 답변 Sergey Khramchenkov 2023.03.27 06:41
                  Thank you!!!
                  danmar
                  1344
                  danmar 2022.12.30 09:13 
                   

                  HI I have MR reversal but still i was missing something in scalping and be catch where i believe it was a good trend ! MR Volume POC levels 4 give me immediately the view of a potential reversal because volume buyers was > volume sellers already absorbed ! i have differents tools but this one give me an very interesting view of the players which really help me a lot in the 2 problematics : 1) when to go 2) when to be very alert of possible change of trend (at least a reversal who can take me out) Well done and again thanks for your advice in my question in comments of MR Reversal Thanks a lot warmly

                  Sergey Khramchenkov
                  2071
                  개발자의 답변 Sergey Khramchenkov 2022.12.30 10:34
                  Thank you!!!
                  laptoplifestyle
                  1794
                  laptoplifestyle 2022.10.10 23:08 
                   

                  Really awesome indicator, very powerful! I reached out to Sergey and his team regarding a bug fix and he reached out right away and released an update the next day that fixed the issue! Thanks for your support and wanting to help =) Looking forward to using your other products =)

                  Sergey Khramchenkov
                  2071
                  개발자의 답변 Sergey Khramchenkov 2022.10.11 06:27
                  Thank you !!!
                  Roman Kovalenko
                  1050
                  Roman Kovalenko 2021.10.12 07:36 
                   

                  хорошая работа.Достойный индикатор.

                  Sergey Khramchenkov
                  2071
                  개발자의 답변 Sergey Khramchenkov 2021.10.13 19:26
                  Спасибо !!!
                  리뷰 답변
                  버전 3.2 2023.03.15
                  - Fixed some technical details.
                  버전 3.1 2022.12.16
                  - Fixed some technical details in the program code.
                  버전 3.0 2022.12.02
                  - Updated the formula for determining which Volume POC Levels to keep showing.
                  - Added the display of Points from Dynamic POC indicator. Volume POC Levels are drawn from the beginning of the Volume Profile and Dynamic POC Points are shown from the end of the Volume Profile.
                  버전 2.1 2022.10.09
                  - Corrected the problem with determining the history of the indicator calculation bars.
                  버전 2.0 2022.09.01
                  - The indicator automatically selects the data source (from M1, M5, M15 or M30 timeframes).
                  - The indicator automatically determines the height of the Volume POC Levels (zones).
                  - Fixed some technical issues.
                  버전 1.31 2021.03.16
                  Fixed an issue with the alert when selecting a TF lower than H4.