Pivot Point Fibo RSJ
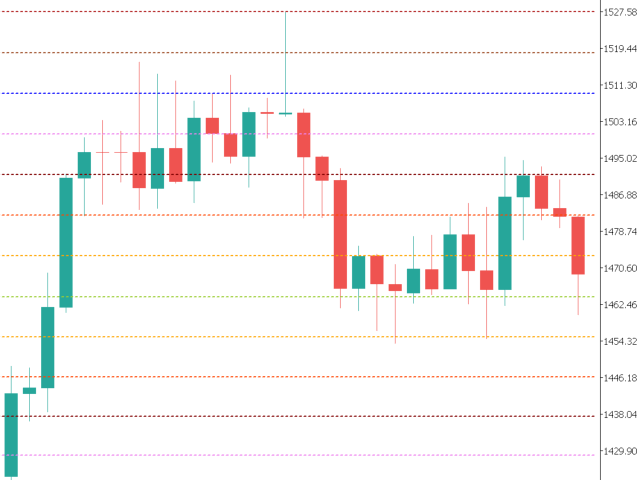
피봇 포인트 Fibo RSJ는 피보나치 비율을 사용하여 당일의 지지선과 저항선을 추적하는 지표입니다.
이 멋진 지표는 피보나치 비율을 사용하여 피벗 포인트를 통해 최대 7단계의 지지와 저항을 생성합니다.
가격이 작업의 가능한 진입/종료 지점을 인식할 수 있는 이 지원 및 저항의 각 수준을 어떻게 존중하는지 환상적입니다.
특징
- 최대 7단계 지원 및 7단계 저항
- 레벨의 색상을 개별적으로 설정
입력
- 피벗 유형
- 피벗 피보 RSJ1 = 피보 비율 1 계산
- 피벗 피보 RSJ2 = 피보 비율 2 계산
- 피벗 Fibo RSJ3 = Fibo 비율 3 계산
- 피벗 피보 클래식 = 클래식 피벗 계산
- 최소 피벗 수준
- 피벗 3 레벨
- 피벗 4 레벨
- 피벗 5 레벨
- 6단계 피벗
- 피벗 7 레벨
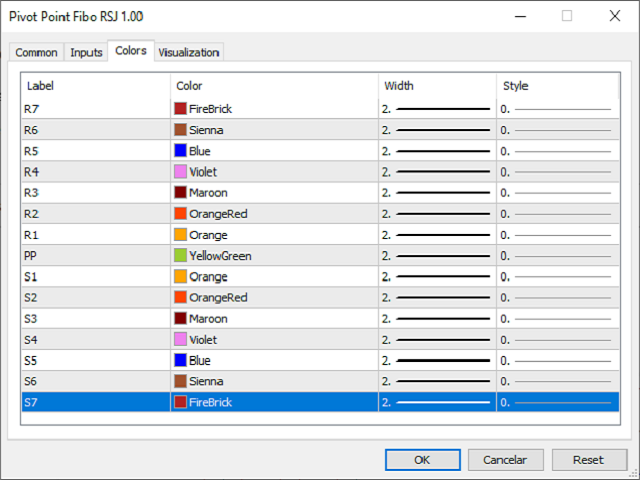


What are the values in each of the selected options?