• 미리보기
  • 리뷰 (18)
  • 코멘트 (134)
  • 새 소식

VR ATR Pro

4.43

가상현실 ATR Pro 지표는 금융 상품의 목표 수준을 결정하는 강력한 전문 도구이다. 지표의 효과는 실제 및 데모 계정에 대한 수천 가지 테스트를 통해 입증되었다.

실제 실제 통계를 사용하여 실제 데이터로 구동되는 가상현실 ATR Pro 지표. 통계는 고집스러운 것이며, 수학적 계산에서 실제 통계를 사용하면 금융 상품의 정확한 목표 수준을 계산할 수 있다.

set 파일, 지침, 멋진 보너스를 받으시려면 저한테 문자 하세요

장점

지표에는 여러 가지 장점이 있으며 다음은 그 중 몇 가지입니다.

  • 지표의 높은 정확도
  • 초자연적 띠는 계산에서 제외할 수 있습니다.
  • 차트 상에 직접 목표 수준을 단순히 표시하는 것.
  • 모든 금융 상품(Forex, Metals, CFD, Futures, Crypto)과 함께 작동합니다.
  • 그것은 변경되지 않으며, 그 해석을 지속적으로 저장합니다.
  • Stop Loss 및 Take Profit 수준을 결정하는 데 효과적입니다.
  • 스마트폰 알림, 이메일 및 MetaTrader 경고.
  • MetaTrader 4와 MetaTrader 5의 버전은 정확히 동일합니다.
  • 설정 및 설치가 간편합니다.
  • 초보자와 숙련된 트레이더에게 적합합니다.
  • 모든 기간 및 시간 프레임에서 작동합니다.

권장 사항

  • 지표를 계산하는 주기는 지표의 기간보다 짧아야 합니다.
  • 새로운 금융 상품에 대한 설정에서 판독값의 정확도 계산을 사용합니다.
  • 일 단위 또는 하루보다는 긴 주기로 수준을 계산할 수 있도록 지표를 사용하십시오.
  • 거래 시스템과 함께 지표를 사용하십시오.
  • 레벨 내부에 Take Profit 을 배치하고 레벨 외부에 Stop Loss 를 배치합니다.
  • 가장 정확한 결과를 얻으려면 10보다 큰 계산 기간을 사용하십시오.
  • 가격이 지표에서 계산한 수준에 도달하면 거래를 피하는 것이 좋습니다.
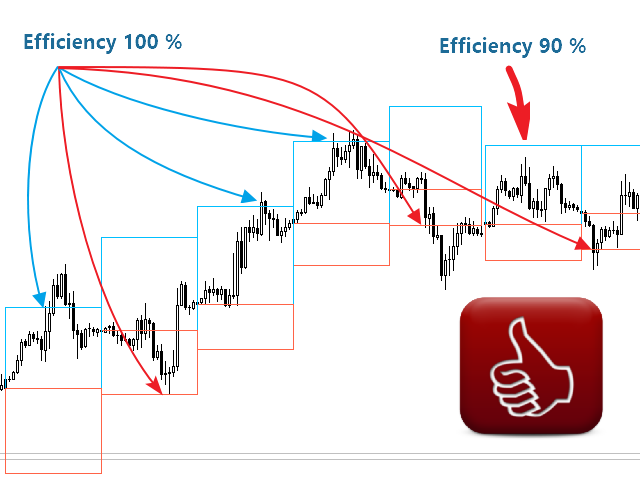
작업 알고리즘

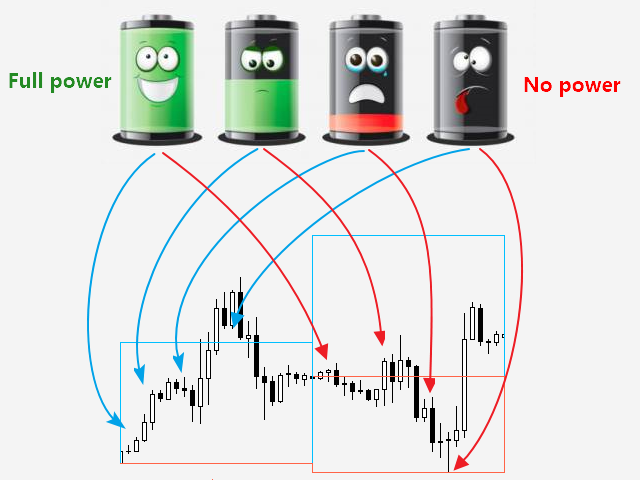
지표의 알고리즘은 지정된 기간 동안의 평균 가격 움직임의 수학적 계산을 기반으로 합니다. 기간 표시기는 해당 기간 동안 통과한 포인트 수를 "감지"하고 기억합니다. 또한 지표는 평균 가격의 수학 공식을 사용하여 가격 상승 예측 및 가격 하락 예측 수준을 계산합니다.

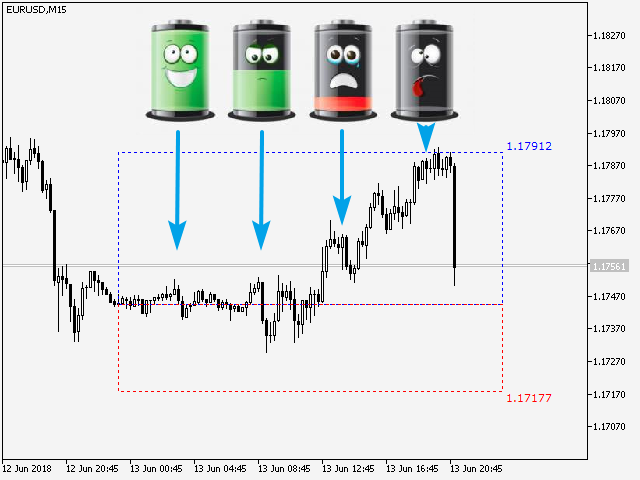
이러한 실제 데이터 사용 덕분에 표시기는 다시 그리지 않고 높은 정확도를 보여줍니다. 표시기는 휴대전화 배터리의 현재 충전량과 비교할 수 있습니다. 평균적으로, 당신의 전화기는 12-16시간동안 사용 후 방전이 된다는 것을 당신은 알고 있습니다. 마찬가지로, VR ATR Pro 표시기는 해당 수준을 계산합니다, 만일 그저께 가격이 50포인트를 지나고, 어제 60포인트를 지나고, 오늘 55포인트를 지난다면, 내일 가격이 평균적으로 55포인트를 지날 확률은 거의 99% 입니다.

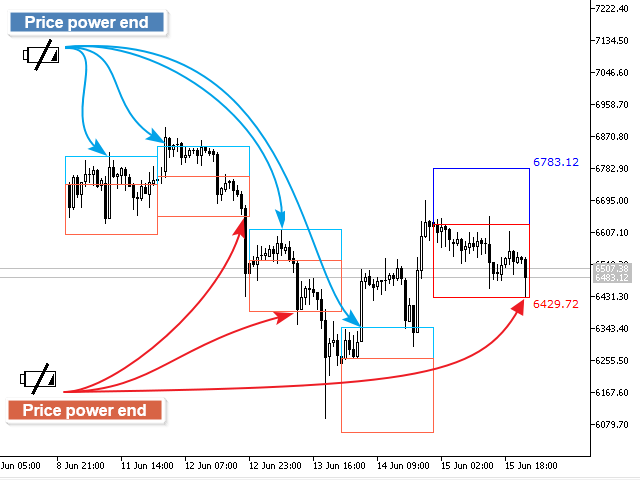
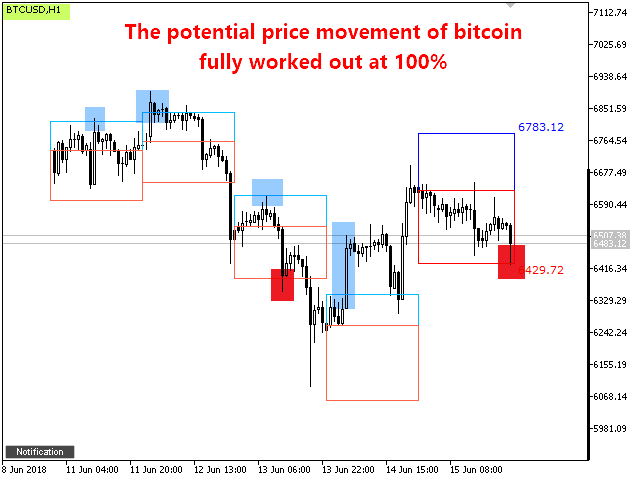
프로그램은 차트에 두 가지 수준을 표시합니다.

  • 상위 수준은 가격 상승의 예측 수준입니다.
  • 낮은 수준은 가격이 바닥으로 이동할 것으로 예상되는 수준입니다.

레벨은 정확한 레벨에서 편차가 있는 영역으로 표시될 수 있습니다. 이를 통해 통계적 편차 범위에서 가격을 계산할 수 있습니다.

판독 정확도

이 프로그램은 금융 상품 매매에 대한 신호를 주는 것은 아닙니다. VR ATR Pro 표시기는 가격이 도달하는 목표 수준, 가격이 도달하기에 충분한 강도와 에너지를 갖는 수준을 계산합니다. 이 수준은 Stop Loss 및 Take Profit 값을 설정하는 데 사용할 수 있습니다. 지표의 정확도를 계산하려면 역사적으로 가격이 지표에서 계산한 수준에 도달한 횟수의 원리에 따라 계산하는 것이 좋습니다. 이것이 지표의 정확성을 찾는 방법입니다.

VR ATR Pro 표시기의 정확도를 계산하기 위한 조건

  • 쉼표 5 뒤의 기호
  • 계산할 기간 수 100
  • 레벨 계산 기간 10
  • 계산 기간 일
  • 계산 날짜 2019년 10월 18일 - 2020년 9월 3일
  • 표시기 표시 기간 1시간
  • EUR / USD 판독 정확도 88%
  • GBP / USD 판독 정확도 78%
  • BTC / USD 판독 정확도 75%

버전: MetaTrader 5

귀하의 피드백, 최고의 감사인사! 리뷰를 남겨주세요.

자세한 내용은 블로그에.

리뷰 18
David T
226
David T 2023.11.11 23:55 
 

Very useful indicator but as most indicators it is not meant to be used as a stand alone but as a confirmation . This indicator helps confirm of the market is breakout out or trending sideways. Still testing it but so far pleased with my purchase.

Yuriskam
206
Yuriskam 2023.06.21 04:44 
 

Этот индикатор будет полезен всем!

elite luis
3331
elite luis 2023.04.03 03:49 
 

Looks Good and Author is responsive supportive, 5 stars for now, Thank you :)

추천 제품
Blahtech Market Profile
Blahtech Limited
4.61 (18)
Was: $249  Now: $99   Market Profile defines a number of day types that can help the trader to determine market behaviour. A key feature is the Value Area, representing the range of price action where 70% of trading took place. Understanding the Value Area can give traders valuable insight into market direction and establish the higher odds trade. It is an excellent addition to any system you may be using. Blahtech Limited presents their Market Profile indicator for the MetaTrader community. Ins
캔들의 종가를 예측하는 지표입니다. 지표는 주로 D1 차트에서 사용하기 위한 것이. 이 지표는 전통적인 외환 거래와 바이너리 옵션 거래 모두에 적합합니다. 지표는 독립형 거래 시스템으로 사용하거나 기존 거래 시스템에 추가로 사용할 수 있습니다. 이 표시기는 현재 양초를 분석하여 양초 본체 내부의 특정 강도 요인과 이전 양초의 매개변수를 계산합니다. 따라서 지표는 시장 움직임의 추가 방향과 현재 양초의 종가를 예측합니다. 이 방법 덕분에 지표는 단기 및 중장기 거래 모두에 적합합니다. 지표를 사용하면 시장 상황을 분석하는 동안 지표가 생성할 잠재적 신호의 수를 설정할 수 있습니다. 표시기 설정에는 이를 위한 특별한 매개변수가 있습니다. 또한 인디케이터는 새로운 신호에 대해 차트의 메시지 형태, 이메일 및 PUSH 알림 형태로 알릴 수 있습니다. 구매 후 저에게 꼭 써주세요! 나는 당신에게 지표와 거래에 대한 나의 추천을 줄 것입니다! 또한 보너스를 받으세요!
Simply The Best Pro
Szymon Palczynski
5 (1)
This indicator displays the histogram and arrows on chart. When Simple The Best Pro are placed on a chart, they identify the trend.  The color of may be blue or red. The blue color stands for upside moves and the red color stands for downside trends. The indicator offers to set Stop Loss (SL) and  Take Profit (TP)  setting. The default value is ATR. Indicator has automatic optimization. The STB is a unique indicator that shows the tendency (button Bars) of a particular signals. The STB tells us
A technical indicator that calculates its readings on trading volumes. In the form of a histogram, it shows the accumulation of the strength of the movement of the trading instrument. It has independent calculation systems for bullish and bearish directions. Works on any trading instruments and time frames. Can complement any trading system. The indicator does not redraw its values, the signals appear on the current candle. It is easy to use and does not load the chart, does not require additi
BoxChart MT4
Evgeny Shevtsov
4.57 (7)
The market is unfair if only because 10% of participants manage 90% of funds. An ordinary trader has slim changes to stand against these "vultures". This problem can be solved. You just need to be among these 10%, learn to predict their intentions and move with them. Volume is the only preemptive factor that faultlessly works on any timeframe and symbol. First, the volume appears and is accumulated, and only then the price moves. The price moves from one volume to another. Areas of volume accumu
History Pattern Search
Yevhenii Levchenko
표시기는 현재 시세를 작성하여 과거 시세와 비교할 수 있으며 이를 바탕으로 가격 변동을 예측합니다. 표시기에는 원하는 날짜로 빠르게 이동할 수 있는 텍스트 필드가 있습니다. 옵션: 기호 - 표시기가 표시할 기호 선택. SymbolPeriod - 지표가 데이터를 가져올 기간 선택. IndicatorColor - 표시기 색상. HorisontalShift - 지시자가 그린 따옴표를 지정된 막대 수만큼 이동합니다. Inverse - true는 인용 부호를 반대로, false - 원래 보기를 반전합니다. ChartVerticalShiftStep - 차트를 수직으로 이동합니다(키보드의 위/아래 화살표). 다음은 날짜를 입력할 수 있는 텍스트 필드의 설정으로, '엔터'를 누르면 즉시 이동할 수 있습니다.
Volume by Price MT4
Brian Collard
4.71 (14)
The Volume by Price Indicator for MetaTrader 4 features Volume Profile and Market Profile TPO (Time Price Opportunity). Get valuable insights out of currencies, equities and commodities data. Gain an edge trading financial markets. Volume and TPO histogram bar and line charts. Volume Footprint charts. TPO letter and block marker charts including split structures. Versatile segmentation and compositing methods. Static, dynamic and flexible ranges with relative and/or absolute visualizations. Lay
Blahtech Supply Demand
Blahtech Limited
4.63 (35)
Was: $299  Now: $99   Supply Demand uses previous price action to identify potential imbalances between buyers and sellers. The key is to identify the better odds zones, not just the untouched ones. Blahtech Supply Demand indicator delivers functionality previously unavailable on any trading platform. This 4-in-1 indicator not only highlights the higher probability zones using a multi-criteria strength engine, but also combines it with multi-timeframe trend analysis, previously confirmed swings
이 표시기의 고유성은 거래량 계산 알고리즘에 있습니다. 누적은 하루의 시작을 참조하지 않고 선택한 기간 동안 직접 발생합니다. 마지막 막대는 계산에서 제외할 수 있습니다. 그러면 현재 데이터가 이전에 형성된 중요한 수준(볼륨)에 미치는 영향이 줄어듭니다. 보다 정확한 계산을 위해 기본적으로 M1 그래프의 데이터가 사용됩니다. 가격 볼륨의 분배 단계가 규제됩니다. 기본적으로 디스플레이의 오른쪽 테두리는 분석에 사용된 데이터의 시작 부분에 해당하는 막대로 설정되어 있지만, 필요한 경우 필요한 막대로 설정할 수 있습니다. 표시된 볼륨 밴드의 길이(오른쪽 테두리)는 계수에 의해 조절되며 왼쪽 또는 오른쪽으로 0(현재) 막대로 이동하거나 현재 막대를 참조하여 미러링할 수도 있습니다. 매개변수: Accumulation period - 부피 누적 계산 기간 Number of excluded last bars - 계산에서 제외된 마지막 막대의 수 Accumulation price step - 가격
Time Bubble
Ahmed Mohamed
Time Bubble ***Specialized for GBPJPY 1H time frame*** (tested for two years with success rates about 82%) Time Circle's smart algorithm detects the price circles with time . give strong signals at the right time as result of combine the price and time. our team spent months to develop this indicator specially for GBPJPY ..with high success rates about 82% win trades over two years .tested from December 2016 to November 2018. *** in last two years total signals 1012 with 829 Wins and
The Market Profile Indicator for MT4 displays the price levels and zones where increased trading activity happens. These zones with substantial forex trading activity provide the forex traders with the best entry levels, support, and resistance levels. Moreover, price levels indicate the best reversal zones. As a result, forex traders can identify BULLISH and BEARISH market trends and BUY and SELL entry points as well as the best reversal points. The indicator works well in all intraday timefram
VolumeProfile
Robert Hess
3.8 (5)
Descption: The Volume Profile displays detailed informations of historical trading activities at certain price levels (Market Profile). So you can locate the areas with the best prices in the market and get an advantage about other market participants. Support: Please do not hesitate to contact me via the MQL5 Platform. I am very grateful about any Bug report, so that i can constantly improve the indicator. I also appreciate any public review for this product.  Features: Customizable Volume
VR Calculate Martingale
Vladimir Pastushak
5 (5)
The VR Calculate Martingale indicator is a powerful order and position calculator for calculating profit or loss. With the help of the order and position calculator, a trader can calculate the average price of any forex currency, stocks or crypto currency. Now you can connect the indicator and start superimposing virtual orders on your real orders and positions. By creating additional virtual positions, you can calculate any development of the situation. The indicator has a built-in lot calculat
EZ Binary USJP Pair
Tuan Anh Dao
4 (2)
The indicator allows you to trade binary options. The recommended time frame is М1 and the expiration time is 1,2,3 minutes. The indicator suitable for auto and manual trading. A possible signal is specified as a arrows above/under a candle. You should wait until the candle closes! Arrows are not re-painted Trade sessions: TOKYO section (Half-end) Currency pairs: USD/JPY Working time frame: M1 Expiration time: 1,2,3 minutes. The indicator also shows good results when using the martingale strateg
FREE
RiverScope Lite automatically determines the nearest most important price levels and support and resistance zones in history, it also identifies a large number of price action patterns (the lite version is limited to 10, while the full version has 30+). The support and resistance levels are determined based on an algorithm that calculates and filters the historical values of the price, its movement character, volumes, etc. It displays the current situation, therefore the nearest levels change in
The Chaikin Oscillator is a technical indicator developed by Marc Chaikin that combines price and volume data to measure the accumulation and distribution of a financial instrument. It aims to identify potential buying and selling opportunities in the market. The Chaikin Oscillator is calculated by subtracting a 10-day exponential moving average of the Accumulation Distribution Line (ADL) from a 3-day exponential moving average of the ADL. Here's how to use the Chaikin Oscillator indicator in tr
Master scalping M1
Nataliia Marchuk
Master Scalping M1 is an innovative indicator that uses an algorithm to quickly and accurately determine the trend.The indicator calculates the time of opening and closing positions, the indicator's algorithms allow you to find the ideal moments to enter a deal (buy or sell an asset), which increase the success of transactions for most traders. Benefits of the indicator: Easy to assemble, does not overload the chart with unnecessary information. Can be used as a filter for any strategy. Works on
Scalping Snake Pro is a unique scalping indicator that shows the trader the price reversal moments and does not redraw. This indicator, unlike many others on the Internet, does not redraw its values. It draws signals on the very first bar, which allows you not to be late with opening deals. This indicator sends notifications to the trader by phone and email when a signal appears. You get all this functionality for only $147. How to trade with this indicator? Open the H1 timeframe. Currency pa
BBMA Strategy
Sergei Gromov
The indicator for determining key patterns for the BBMA strategy will perfectly complement the Fibo Musang strategy, and can also be used as an independent tool. IMPORTANT! Contact me immediately after purchase to receive the second file! If you have any questions, I will help you deal with the indicator. Designed to save market analysis time; Sends push notifications to the phone when key moments of the strategy have arisen (Extrem A, Csak, cross the BB line with a candle) Advantages Easy to u
GND Tail Candle
Nguyen Dang Giang
A tall upper shadow occurs when the price moves during the period, but goes back down, which is a bearish signal. A tall lower shadow forms when bears push the price down, but bulls pull it back up, which leaves a long line or shadow. This is considered a bullish signal. Some technical analysts believe a tall or long shadow means the stock will turn or reverse. Some believe a short or lower shadow means a price rise is coming. In other words, a tall upper shadow means a downturn is coming, whil
Displays the local time with the time difference you set. (It does not correspond to the time difference in 30-minute increments.) It also displays a price line with a good price, such as 100.000 .100 or .200. The standard gridlines are displayed with the time and price by MT4, but they are very confusing as they become the broker's time and are displayed at the halfway point along with the price. It hides them and displays gridlines at user-defined time differences and prices in easy-to-und
Binary Option Signal
Yaroslav Varankin
Indicator for binary options arrow is easy to use and does not require configuration works on all currency pairs, cryptocurrencies buy signal blue up arrow sell signal red down arrow tips do not trade during news and 15-30 minutes before their release, as the market is too volatile and there is a lot of noise it is worth entering trades one or two candles from the current period (recommended for 1 candle) timeframe up to m 15 recommended money management fixed lot or fixed percentage of the depo
TWO PAIRS SQUARE HEDGE METER INDICATOR Try this brilliant 2 pairs square indicator It draws a square wave of the relation between your two inputs symbols when square wave indicates -1 then it is very great opportunity to SELL pair1 and BUY Pair2 when square wave indicates +1 then it is very great opportunity to BUY pair1 and SELL Pair2 the inputs are : 2 pairs of symbols         then index value : i use 20 for M30 charts ( you can try other values : 40/50 for M15 , : 30 for M30 , : 10 for H1 ,
Noize Absorption Index MT4
Ekaterina Saltykova
5 (1)
Noize Absorption Index - is the manual trading system that measures the difference of pressure between bears forces and bulls forces. Green line - is a noize free index that showing curent situation. Zero value of index shows totally choppy/flat market.Values above zero level shows how powerfull bullish wave is and values below zero measures bearish forces.Up arrow appears on bearish market when it's ready to reverse, dn arrow appears on weak bullish market, as a result of reverse expectation. S
TS krachobor
Magomed Zakaryaev
Всем привет! Выставляю свою торговую стратегию для форекс (далее - ТС). После покупки или аренды ТС пишете мне, я вас добавляют в закрытый чат телеграм, где дам все индикаторы и поддержку по торговле, и мы вместе будем торговать. Статистику по торговле в ТС я добавлю чуть позже, так как открыл новый счет по ТС, что бы было наглядно как проходит торговля. Кроме этого  я дам счет и пароль инвестора, можете сами смотреть в живую торговлю и решить для себя подходит ли она для вас. Два режима, 1) Сре
Fibonacci retracement and extension line drawing tool Fibonacci retracement and extended line drawing tool for MT4 platform is suitable for traders who use  golden section trading Advantages: There is no extra line, no too long line, and it is easy to observe and find trading opportunities Trial version: https://www.mql5.com/zh/market/product/35884 Main functions: 1. Multiple groups of Fibonacci turns can be drawn directly, and the relationship between important turning points
A "Volume Profile" is an advanced charting indicator that displays total volume traded at every price level over a user specified time period. The main components of the volume profile are POC ( Point Of Control - the price level, at which the maximum number of contracts were executed during a selected period), VAH ( Value Area High - the highest price in the Value Area) and VAL ( Value Area Low - the lowest price in the Value Area). When we settled on the original indicator, we spent a lot o
MarketProfile EForex
Veridiana Adorno Kendrick
Market Profile Shows where the price has spent more time, highlighting important levels that can be used in trading. It is a powerful tool which is designed to take the fundamental components which comprise every market; price/volume/time, and visually display their relationship in real-time as the market develops for a pre-determined time period. Very powerful tool!
40% off. Original price $50 ATR Scanner Pro is a multi symbol multi timeframe volatility scanner that monitors and analyzes Average True Range indicator value in up to 28 symbols and 9 timeframes in 3 modes : ATR value:  As a volatility dashboard it shows the ATR indicator value in all pairs and timeframes and signals when the ATR value reaches a maximum or minimum in a given duration. Short term ATR/Long term ATR ratio:  It shows ratio of 2 ATRs with different periods. It's useful in detecting
PZ Trend Trading
PZ TRADING SLU
4.75 (4)
Trend Trading is an indicator designed to profit as much as possible from trends taking place in the market, by timing pullbacks and breakouts. It finds trading opportunities by analyzing what the price is doing during established trends. [ Installation Guide | Update Guide | Troubleshooting | FAQ | All Products ] Trade financial markets with confidence and efficiency Profit from established trends without getting whipsawed Recognize profitable pullbacks, breakouts and early reversals The ind
이 제품의 구매자들이 또한 구매함
Gann Made Easy
Oleg Rodin
4.95 (44)
Gann Made Easy 는 mr.의 이론을 사용하여 최고의 거래 원칙을 기반으로 하는 전문적이고 사용하기 쉬운 Forex 거래 시스템입니다. W.D. 간. 이 표시기는 Stop Loss 및 Take Profit Levels를 포함하여 정확한 BUY 및 SELL 신호를 제공합니다. PUSH 알림을 사용하여 이동 중에도 거래할 수 있습니다. 구매 후 연락주세요! 내 거래 팁과 훌륭한 보너스 지표를 무료로 공유하겠습니다! 아마도 Gann 거래 방법에 대해 이미 여러 번 들었을 것입니다. 일반적으로 Gann의 이론은 초보자 거래자뿐만 아니라 이미 거래 경험이 있는 사람들에게도 매우 복잡한 것입니다. Gann의 거래 방식은 이론적으로 적용하기 쉽지 않기 때문입니다. 나는 그 지식을 연마하고 Forex 지표에 최고의 원칙을 적용하기 위해 몇 년을 보냈습니다. 표시기는 적용하기가 매우 쉽습니다. 차트에 첨부하고 간단한 거래 권장 사항을 따르기만 하면 됩니다. 지표는 지속적으로 시장 분석 작업
기적적인 외환 지표 소개: 정확한 트레이딩의 힘을 발휘하세요 모든 시간대에서 뛰어난 결과를 제공하는 최고의 외환 지표를 찾는데 지친 적이 있나요? 더 이상 찾을 필요가 없습니다! 기적적인 외환 지표가 도래하여 귀하의 트레이딩 경험을 혁신하고 수익을 새로운 고도로 끌어올립니다. 최첨단 기술과 수년간의 정성스런 개발을 토대로 기적적인 외환 지표는 외환 시장에서의 힘과 정확성의 정점으로 떠오릅니다. 이 탁월한 도구는 모든 수준의 트레이더의 요구를 충족시키고 지속적인 수익을 추구하는 데에서 비길 데 없는 우위를 제공하기 위해 설계되었습니다. 기적적인 외환 지표의 가장 큰 장점은 그 뛰어난 적응성에 있습니다. 당신이 데이 트레이더, 스윙 트레이더이든 장기 포지션을 선호하든, 이 지표는 모든 시간대에서 뛰어난 결과를 제공하기 위해 최적화되었습니다. 그러나 그 정확성과 시장의 복잡한 움직임을 포착하는 능력이 참으로 빛을 발하는 것은 1시간 기간대에서 사용할 때입니다. 기적적인 외환 지표의 정확성
현재 20% 할인 ! 초보자 또는 전문가 트레이더를 위한 최고의 솔루션! 이 대시보드 소프트웨어는 28개의 통화 쌍에서 작동합니다. 2가지 주요 지표(Advanced Currency Strength 28 및 Advanced Currency Impulse)를 기반으로 합니다. 전체 Forex 시장에 대한 훌륭한 개요를 제공합니다. 고급 통화 강도 값, 통화 이동 속도 및 모든(9) 시간대의 28 Forex 쌍에 대한 신호를 보여줍니다. 추세 및/또는 스캘핑 기회를 정확히 파악하기 위해 차트의 단일 지표를 사용하여 전체 시장을 볼 수 있을 때 거래가 어떻게 개선될지 상상해 보십시오! 잠재적인 거래를 식별하고 확인하면서 강력한 통화와 약한 통화를 더욱 쉽게 식별할 수 있도록 이 지표에 기능을 내장했습니다. 이 표시기는 통화의 강세 또는 약세가 증가 또는 감소하는지 여부와 모든 시간대에서 수행되는 방식을 그래픽으로 보여줍니다. 추가된 새로운 기능은 현재 시장 조건 변화에 적
Atomic Analyst
Issam Kassas
5 (1)
우선적으로 언급할 점은이 거래 지표가 다시 그리지 않고 지연되지 않으며 이를 통해 수동 및 로봇 거래 모두에 이상적이라는 점입니다. Atomic Analyst는 가격의 강도와 모멘텀을 활용하여 시장에서 더 나은 이점을 찾는 PA Price Action Indicator입니다. 고급 필터를 장착하여 잡음과 거짓 신호를 제거하고 거래 잠재력을 높이는 데 도움이 됩니다. 복잡한 지표의 다중 레이어를 사용하여 Atomic Analyst는 차트를 스캔하고 복잡한 수학적 계산을 간단한 신호와 색상으로 변환하여 초보 트레이더가 이해하고 일관된 거래 결정을 내릴 수 있도록합니다. "Atomic Analyst"는 새로운 및 경험이 풍부한 트레이더를위한 종합적인 거래 솔루션입니다. 프리미엄 지표와 최고 수준의 기능을 하나의 거래 전략에 결합하여 모든 종류의 트레이더에 대한 다재다능한 선택지가되었습니다. 인트라데이 거래 및 스캘핑 전략 : 빠르고 정확한 일일 거래 및 단기 거래를 위해 설계
TPSproTREND PrO
Roman Podpora
5 (15)
TPSpro TRENDPRO  - is a trend indicator that automatically analyzes the market and provides information about the trend and each of its changes, as well as giving signals for entering trades without redrawing! The indicator uses each candle, analyzing them separately. referring to different impulses - up or down impulse. Exact entry points into transactions for currencies, crypto, metals, stocks, indices!  -  Version MT5               DETAILED DESCRIPTION        /       TRADING SETUPS           
TPSpro RFI Levels
Roman Podpora
5 (13)
A key element in trading is zones or levels from which decisions to buy or sell a trading instrument are made. Despite attempts by major players to conceal their presence in the market, they inevitably leave traces. Our task was to learn how to identify these traces and interpret them correctly. Reversal First Impulse levels (RFI)   -  Version MT5                INSTRUCTIONS                 RUS                 ENG                                       R ecommended to use with an indicator   -  
Quantum Trend Sniper Indicator MT4
Bogdan Ion Puscasu
4.59 (39)
소개       Quantum Trend Sniper Indicator는   추세 반전을 식별하고 거래하는 방식을 변화시키는 획기적인 MQL5 지표입니다! 13년 이상의 거래 경험을 가진 숙련된 트레이더 팀이 개발한       Quantum Trend Sniper 표시기       매우 높은 정확도로 추세 반전을 식별하는 혁신적인 방법으로 거래 여정을 새로운 차원으로 끌어올리도록 설계되었습니다. ***Quantum Trend Sniper Indicator를 구입하면 Quantum Breakout Indicator를 무료로 받을 수 있습니다!*** Quantum Trend Sniper Indicator는 추세 반전을 식별하고 세 가지 이익실현 수준을 제안할 때 경고, 신호 화살표를 제공합니다. 초보자 거래자와 전문 거래자 모두에게 적합합니다. Quantum EA 채널:       여기를 클릭하세요 MT5 버전:       여기를 클릭하세요
Advanced Currency Strength28 Indicator
Bernhard Schweigert
4.9 (662)
현재 26% 할인 초보자 또는 전문가 트레이더를 위한 최고의 솔루션! 이 지표는 우리가 독점 기능과 새로운 공식을 통합했기 때문에 독특하고 고품질이며 저렴한 거래 도구입니다. 단 하나의 차트로 28 Forex 쌍의 통화 강도를 읽을 수 있습니다! 새로운 추세 또는 스캘핑 기회의 정확한 트리거 포인트를 정확히 찾아낼 수 있기 때문에 거래가 어떻게 개선될지 상상해 보십시오. 사용 설명서: 여기를 클릭  https://www.mql5.com/en/blogs/post/697384 그것이 첫 번째, 원본입니다! 쓸모없는 지망생 클론을 사지 마십시오. 더 스페셜  강력한 통화 모멘텀을 보여주는 하위 창의 화살표 GAP가 거래를 안내합니다! 기본 또는 호가 통화가 과매도/과매도 영역(외부 시장 피보나치 수준)에 있을 때 개별 차트의 기본 창에 경고 표시가 나타납니다. 통화 강도가 외부 범위에서 떨어질 때 풀백/반전 경고. 교차 패턴의 특별 경고 추세를 빠르게 볼 수 있는
TrendMaestro
Stefano Frisetti
5 (2)
note: this indicator is for METATRADER4, if you want the version for METATRADER5 this is the link: TRENDMAESTRO recognizes a new TREND in the bud, he never makes mistakes. The certainty of identifying a new TREND is priceless. DESCRIPTION TRENDMAESTRO identifies a new TREND in the bud, this indicator examines the volatility, volumes and momentum to identify the moment in which there is an explosion of one or more of these data and therefore the moment in which prices have strong probability of f
Scalper Inside PRO
Alexey Minkov
4.75 (55)
An exclusive indicator that utilizes an innovative algorithm to swiftly and accurately determine the market trend. The indicator automatically calculates opening, closing, and profit levels, providing detailed trading statistics. With these features, you can choose the most appropriate trading instrument for the current market conditions. Additionally, you can easily integrate your own arrow indicators into Scalper Inside Pro to quickly evaluate their statistics and profitability. Scalper Inside
우선적으로, 이 거래 도구는 전문적인 거래에 이상적인 비-다시 그리기 및 지연되지 않는 지표입니다.  스마트 가격 액션 컨셉트 인디케이터는 신규 및 경험 많은 트레이더 모두에게 매우 강력한 도구입니다. Inner Circle Trader Analysis 및 Smart Money Concepts Trading Strategies와 같은 고급 거래 아이디어를 결합하여 20가지 이상의 유용한 지표를 하나로 결합합니다. 이 인디케이터는 스마트 머니 컨셉트에 중점을 두어 대형 기관의 거래 방식을 제공하고 이동을 예측하는 데 도움을 줍니다.  특히 유동성 분석에 뛰어나 기관이 어떻게 거래하는지 이해하는 데 도움을 줍니다. 시장 트렌드를 예측하고 가격 변동을 신중하게 분석하는 데 탁월합니다. 귀하의 거래를 기관 전략에 맞추어 시장의 동향에 대해 더 정확한 예측을 할 수 있습니다. 이 인디케이터는 시장 구조를 분석하고 중요한 주문 블록을 식별하고 다양한 패턴을 인식하는 데 뛰어납니다. 
Trend Screener
STE S.S.COMPANY
4.83 (86)
트렌드 표시기, 트렌드 트레이딩 및 필터링을 위한 획기적인 고유 솔루션, 하나의 도구 안에 내장된 모든 중요한 트렌드 기능! Forex, 상품, 암호 화폐, 지수 및 주식과 같은 모든 기호/도구에 사용할 수 있는 100% 다시 칠하지 않는 다중 시간 프레임 및 다중 통화 표시기입니다. Trend Screener는 차트에 점이 있는 화살표 추세 신호를 제공하는 효율적인 지표 추세 추종 지표입니다. 추세 분석기 표시기에서 사용할 수 있는 기능: 1. 트렌드 스캐너. 2. 최대 이익 분석이 있는 추세선. 3. 추세 통화 강도 측정기. 4. 경고가 있는 추세 반전 점. 5. 경고가 있는 강력한 추세 점. 6. 추세 화살표 Trend Screener Indicator가 있는 일일 분석 예, 일일 신호 성능...등은 여기에서 찾을 수 있습니다.   여기를 클릭하십시오. LIMITED TIME OFFER : Trend Screener Indicator는 50 $ 및 평생 동안만 사용할 수 있
XQ Indicator MetaTrader 4
Marzena Maria Szmit
3 (2)
Step into the realm of Forex trading with confidence and precision using XQ, a cutting-edge Forex indicator designed to elevate your trading game to unprecedented heights. Whether you're a seasoned trader or just stepping into the world of currency exchange,   XQ Forex Indicator   empowers you with the insights and signals needed to make informed trading decisions. The signal conditions are a combination of three indicators, and XQ Forex Indicator only display  medium and long-term trends . The
Quantum Breakout Indicator PRO
Bogdan Ion Puscasu
4.96 (26)
소개       Quantum Breakout PRO   , 브레이크아웃 존 거래 방식을 변화시키는 획기적인 MQL5 지표! 13년 이상의 거래 경험을 가진 숙련된 트레이더 팀이 개발한   Quantum Breakout PRO는   혁신적이고 역동적인 브레이크아웃 영역 전략으로 거래 여정을 새로운 차원으로 끌어올리도록 설계되었습니다. Quantum Breakout Indicator는 5개의 이익 목표 영역이 있는 브레이크아웃 영역의 신호 화살표와 브레이크아웃 상자를 기반으로 한 손절 제안을 제공합니다. 초보자 거래자와 전문 거래자 모두에게 적합합니다. Quantum EA 채널:       여기를 클릭하세요 MT5 버전 :   여기를 클릭하세요 중요한! 구매 후 설치 매뉴얼을 받으려면 개인 메시지를 보내주십시오. 추천: 기간: M15 통화쌍: GBPJPY, EURJPY, USDJPY,NZDUSD, XAUUSD 계정 유형: 스프레드가 매우 낮은 ECN, Ra
PRO Renko System
Oleg Rodin
5 (24)
PRO Renko System 은 RENKO 차트 거래를 위해 특별히 고안된 매우 정확한 거래 시스템입니다. 이것은 다양한 거래 상품에 적용될 수있는 보편적 인 시스템입니다. 체계는 효과적으로 당신에게 정확한 반전 신호에 접근을 주는 소위 시장 소음을 중화합니다. 이 표시기는 사용하기가 매우 쉽고 신호 생성을 담당하는 매개 변수가 하나만 있습니다. 당신은 쉽게 당신의 선택의 어떤 무역 계기에 공구를 적응시킬 수 있고 renko 막대기의 크기. 나는 항상 당신이 내 소프트웨어로 수익성있게 거래 할 수 있도록 추가 지원을 제공 할 준비가되어 있습니다! 나는 당신에게 행복하고 수익성있는 거래를 기원합니다! 구매 후 저에게 연락하십시오! 내 렌코 차트 생성기를 보내드립니다. 또한 내 개인 권장 사항 및 시스템의 다른 모듈을 무료로 공유 할 것입니다!
FX Power MT4 NG
Daniel Stein
5 (8)
모닝 브리핑 여기 mql5 와 텔레그램에서 FX Power MT4 NG 는 오랫동안 인기 있는 통화 강도 측정기인 FX Power의 차세대 버전입니다. 이 차세대 강도 측정기는 무엇을 제공합니까? 기존 FX Power에서 좋아했던 모든 것 PLUS GOLD/XAU 강도 분석 더욱 정밀한 계산 결과 개별 구성 가능한 분석 기간 더 나은 성능을 위한 사용자 정의 가능한 계산 한도 특별 멀티더 많은 것을보고 싶은 사람들을위한 특별한 다중 인스턴스 설정 모든 차트에서 좋아하는 색상을위한 끝없는 그래픽 설정 수많은 알림 옵션, 중요한 것을 다시는 놓치지 않도록 Windows 11 및 macOS 스타일의 둥근 모서리가 있는 새로운 디자인 마법처럼 움직이는 인디케이터 패널 FX 파워 키 특징 모든 주요 통화의 완전한 강세 이력 모든 시간대에 걸친 통화 강세 이력 모든 브로커 및 차트에서 고유 계산 결과 100% 신뢰할 수있는 실시간100 % 신뢰할 수있는 실시간 계산-> 다시 칠하지 않음
ON Trade Waves Patterns Harmonic Elliot Wolfe를 소개합니다. 이는 수동 및 자동 방법을 사용하여 다양한 시장 패턴을 감지하기 위해 개발된 고급 지표입니다. 다음은 그 작동 방식입니다: 조화적 패턴: 이 지표는 차트에 나타나는 조화적 패턴을 식별할 수 있습니다. 이러한 패턴은 Scott Carney의 "Harmonic Trading vol 1 및 2"에서 설명한 것처럼 조화적 거래 이론을 연습하는 트레이더에게 중요합니다. 수동으로 그리든 자동 감지를 사용하든 ON Trade Waves Patterns가 도움을 줄 것입니다. 컨트롤 패널: 이 지표에는 사용자 친화적인 컨트롤 패널이 있습니다. 차트 및 시간 프레임 설정을 저장하여 다양한 구성 간에 쉽게 전환할 수 있습니다. 차트 공간을 최대화하려면 최소화할 수도 있습니다. 다른 분석 도구를 사용하는 것을 선호하는 경우 닫기 버튼을 클릭하여 모든 지표 데이터를 숨길 수 있습니다. 템플릿 저장: 설정을 사
Advanced Supply Demand
Bernhard Schweigert
4.92 (310)
현재 33% 할인! 초보자나 전문 트레이더를 위한 최고의 솔루션! 이 보조지표는 우리가 다수의 독창적 기능과 새로운 공식을 통합한 독특하고 고품질이며 저렴한 거래 도구입니다. 이 업데이트를 통해 이중 시간대를 표시할 수 있습니다. 더 높은 TF를 표시할 수 있을 뿐만 아니라 차트 TF와 더 높은 TF 모두를 표시할 수 있습니다: 중첩 영역 표시. 모든 Supply Demand 트레이더들이 좋아할 것입니다. :) 중요한 정보 공개 Advanced Supply Demand의 잠재력을 극대화하려면 다음을 방문하십시오. https://www.mql5.com/ko/blogs/post/720245   진입 또는 목표의 명확한 트리거 포인트를 정확히 찾아냄으로 해서 거래가 어떻게 개선될지 상상해 보십시오. 새로운 알고리즘을 기반으로 매수자와 매도자 간의 잠재적인 불균형을 훨씬 더 쉽게 분간할 수 있습니다. 왜냐하면 가장 강한 공급영역과 가장 강한 수요 영역과 과거에 어떻게 진행 되었는지를(이
맞춤형 MT4 지표로 성공적인 외환 거래에 대한 비밀을 발견하십시오! 외환 시장에서 성공을 달성하고 위험을 최소화하면서 일관되게 이익을 얻는 방법을 궁금해 한 적이 있습니까? 여기에 당신이 찾고 있던 답이 있습니다! 거래에 대한 귀하의 접근 방식을 혁신 할 독점적 MT4 지표를 소개 할 수 있습니다. 독특한 다양성 우리의 지표는 Renko 및 Rangebar Candle Formations를 선호하는 사용자를 위해 특별히 설계되었습니다. 우리는 이러한 차트 유형이 많은 숙련 된 거래자들이 선호한다는 것을 이해하기 때문에 우리의 지표가 그들과 완벽하게 통합되어 비교할 수없는 시장 분석을 제공합니다. 명확한 추세 신호 복잡한 분석을 잊어 버리십시오! 우리의 지표는 생생한 색상과 명확한 점 구조를 사용하여 시장 동향을 명확하게 나타냅니다. 빨간색과 파란색 점은 가격 이동 방향에 대해 의심의 여지가 없어 거래에서 빠른 의사 결정을 할 수 있습니다. HH/HL HL/LL
Currency Strength Wizard
Oleg Rodin
4.91 (44)
통화 강도 마법사는 성공적인 거래를 위한 올인원 솔루션을 제공하는 매우 강력한 지표입니다. 표시기는 여러 시간 프레임의 모든 통화 데이터를 사용하여 이 또는 해당 외환 쌍의 힘을 계산합니다. 이 데이터는 특정 통화의 힘을 확인하는 데 사용할 수 있는 사용하기 쉬운 통화 지수 및 통화 전력선의 형태로 표시됩니다. 필요한 것은 거래하려는 차트에 표시기를 부착하는 것뿐입니다. 표시기는 거래하는 통화의 실제 강세를 보여줍니다. 지표는 또한 추세와 거래할 때 유리하게 사용할 수 있는 구매 및 판매 거래량 압력의 극한값을 보여줍니다. 지표는 또한 피보나치에 기반한 가능한 대상을 보여줍니다. 표시기는 PUSH 알림을 포함한 모든 유형의 알림을 제공합니다. 구매 후 연락주세요. 나는 당신과 거래 팁을 공유하고 당신에게 무료로 훌륭한 보너스 지표를 줄 것입니다! 나는 당신에게 행복하고 유익한 거래를 기원합니다!
Scalper Vault
Oleg Rodin
5 (27)
Scalper Vault 는 성공적인 스캘핑에 필요한 모든 것을 제공하는 전문 스캘핑 시스템입니다. 이 표시기는 외환 및 바이너리 옵션 거래자가 사용할 수 있는 완전한 거래 시스템입니다. 권장 시간 프레임은 M5입니다. 시스템은 추세 방향으로 정확한 화살표 신호를 제공합니다. 또한 상단 및 하단 신호와 Gann 시장 수준을 제공합니다.  이 시스템은 사용하기가 매우 쉽습니다. 원하는 시장 지역의 화살표만 따라가면 됩니다. 엑시트는 가격이 적정 수준에 도달하거나 시장의 고점 또는 저점 신호가 나타날 때 수행됩니다.  표시기는 PUSH 알림을 포함한 모든 유형의 경고를 제공합니다. 인디케이터 구매 후 연락주세요. 내 개인 거래 권장 사항과 훌륭한 보너스 지표를 무료로 공유합니다! 나는 당신에게 행복하고 유익한 거래를 기원합니다!
Entry Points Pro
Yury Orlov
4.7 (224)
다시 색을 칠하지 않고 거래에 진입할 수 있는 정확한 신호를 제공하는 MT4용 지표입니다. 외환, 암호화폐, 금속, 주식, 지수 등 모든 금융 자산에 적용할 수 있습니다. 매우 정확한 추정값을 제공하고 매수와 매도의 가장 좋은 시점을 알려줍니다. 하나의 시그널로 수익을 내는 지표의 예와 함께 비디오 (6:22)시청하십시오! 대부분의 거래자는 Entry Points Pro 지표의 도움으로 첫 거래 주 동안 트레이딩 결과를 개선합니다. 저희의   Telegram Group 을 구독하세요! Entry Points Pro 지표의 좋은점. 재도색이 없는 진입 신호 신호가 나타나고 확인되면(시그널 캔들이 완성된 경우) 신호는 더 이상 사라지지 않습니다. 여타 보조지표의 경우 신호를 표시한 다음 제거되기 때문에 큰 재정적 손실로 이어집니다. 오류 없는 거래 게시 알고리즘을 통해 트레이드(진입 또는 청산)를 할 이상적인 순간을 찾을 수 있으며, 이를 통해 이를 사용하는 모든 거래자의
우선적으로 이 거래 시스템은 다시 그리지 않고, 다시 그리지 않으며, 지연되지 않는 것을 강조할 가치가 있습니다. 이는 전문적인 거래에 이상적입니다. "스마트 서포트 앤 레지스턴스 트레이딩 시스템"은 새로운 및 경험 많은 트레이더를 위해 개발된 고급 지표입니다. 이 시스템은 외환 시장에서 정밀도와 신뢰감을 제공합니다. 이 포괄적인 시스템은 일일 거래 전략, 스윙 거래 전략, 지원 및 저항 전략, 캔들스틱 패턴 전략, VWAP 전략, 다중 시간대 추세 전략 등을 포함한 7개 이상의 전략, 10개의 지표 및 다양한 거래 방식을 결합합니다. 이 시스템은 화살표 신호, 진입 및 출구 지점, 거래 경보, 높은 시간대 추세 분석, 실시간 거래 모니터링 및 트렌드 및 볼륨 캔들 색상 제공합니다. 자동 지원 및 저항 감지로 다양한 시장 상황에서 신중한 결정을 돕는 다면적 인 지표입니다. 스마트 서포트 앤 레지스턴스 트레이딩 시스템은 프리미엄 및 강력한 지표 및 도구 모음을 통합한 견고한
TrendDecoder Premium
Christophe, Pa Trouillas
5 (2)
범위 및 다음 가능한 움직임 식별   |  추세의 초기 신호와 강도를 확인하세요   |  반전 전 명확한 출구 확보   |  가격이 테스트 할 피보 레벨 파악 비추적, 비지연 지표 - 수동 및 자동 거래에 이상적 - 모든 자산 및 모든 시간 단위에 적합 기간 한정 혜택 >>   50% 할인 구매 후 이 채널로 문의 하여 권장 설정을 확인하세요. MT5   버전:   여기를 클릭하세요 BladeSCALPER   및   PowerZONES   로 전체 방법을 확인하세요. 어떤 서비스인가요? 트렌드디코더는 추세 모니터링을 간단하고 쉽게 하기 위한 여러 혁신 기술의 집약체입니다. 투영 추세선(투영 추세선) - 다가오는 추세의 속도 기준 실시간 추세선과 투영 추세선 비교 - 시장이 이전과 같은 방향으로 움직이고 있는지, 아니면 둔화되고 있는지? 실시간 추세선 교차 - 추세가 궤도를 이탈하고 있습니다. 그레이박스 - 시장이 더 이상 추세가 아니며 새로운 전환기에 들어섰습
TakePropips Donchian Trend Pro
Eric John Pajarillaga Aldana
4.82 (17)
TakePropips Donchian Trend Pro   (MT4)는 Donchian 채널을 사용하여 추세의 방향을 자동으로 감지하고 진입 및 퇴장 거래 신호를 제공하는 강력하고 효과적인 도구입니다! 이 다기능 지표에는 추세 스캐너, 거래 신호, 통계 패널, 스크리너, 거래 세션 및 경고 내역 대시보드가 포함됩니다. 거래 신호를 제공하고 차트 분석 시간을 절약하도록 설계되었습니다! 다음 블로그 게시물에서 사용자 설명서 및 설치 가이드를 다운로드할 수 있습니다.   https://www.mql5.com/en/blogs/post/751368 오늘 50% 할인을 받으세요! 가격이 $98에서 $49로 인하되었습니다! 전략 테스터에서 이 지표를 테스트할 수 있습니다(비주얼 모드 활성화). 실시간 차트에서 테스트하고 싶다면 저에게 메시지를 보내 7일 평가판을 받을 수도 있습니다. 자세한 내용은 설명 아래에 비디오 자습서도 제공됩니다. 질문이 있거나 도움이 필요하면 저에게 연락하십시오.
제우스 지표 소개: 귀하의 궁극적인 이윤 돌파 거래 도구. 이 지표는 폭발 전략과 심층 분석 필요성을 제거하여 거래를 단순화합니다. 귀하의 설정된 시간 프레임을 기반으로 자동으로 존을 그리고, 스탑 로스 (SL), 테이크 프로핏 (TP) 및 트레일링 스탑 수준을 제안합니다. 제우스 지표는 가격이 매수 또는 매도 진입점에 다가갈 때 즉각 알림을 제공하고 시그널 화살표를 표시합니다. 또한 네 가지 다른 테이크 프로핏 레벨과 다양한 트레일링 스탑 옵션을 권장합니다. 이 도구는 초보자와 숙련된 트레이더 모두에게 적합합니다. 채널 지원: [ 여기를 클릭 ](채널 지원 링크) 상점: 여기를 클릭하세요. MT5 버전: [ 여기를 클릭 ](MT5 버전 링크) 권장 사항: 시간 프레임: M5 또는 M15 통화 쌍: 모든 통화 쌍과 호환 가능 계정 유형: 모든 계정 유형과 호환 가능 권장 스탑 로스: 제우스 지표에서 제공하는 SL 제안 사용 권장 테이크 프로핏 레벨: 제우스 지표에서 제안하는 TP
Trend Forecasting
Mohamed Hassan
5 (11)
This indicator is unstoppable when combined with our other indicator called Katana . After purchase, send us a message and you could get Katana  for FREE as a BONUS!  You can also ask to join our private group where we discuss together with other members!  MT5 version: click here There are limited copies available at $45 (3 copies left). Next price is $99. Don't miss this great deal!  The Trend Forecasting indicator is a very unique & easy tool that is able to make prediction a
FX Volume
Daniel Stein
4.6 (35)
모닝 브리핑을 통해 세부 정보와 스크린샷으로 매일 시장 업데이트를 받으세요 여기 mql5 및 텔레그램에서 FX 거래량은 브로커의 관점에서 시장 심리에 대한 실제 통찰력을 제공하는 최초이자 유일한 거래량 지표입니다. 브로커와 같은 기관 시장 참여자가 외환 시장에서 어떤 포지션을 취하고 있는지에 대한 훌륭한 통찰력을 COT 보고서보다 훨씬 빠르게 제공합니다. 차트에서 이 정보를 직접 확인하는 것은 트레이딩의 진정한 판도를 바꾸고 획기적인 솔루션입니다. 다음과 같은 고유한 시장 데이터 인사이트의 이점 비율 는 통화의 매수/매도 포지션 비율을 백분율로 표시 비율 변화 는 선택한 기간 내 매수 비율과 비율 변화를 표시 총 거래량 는 해당 통화의 총 거래량(롱 및 숏)을 로트 단위로 보여줍니다 Volumes Long 는 해당 통화의 모든 롱 포지션의 거래량을 보여줍니다 Volumes Short 는 해당 통화의 모든 숏 포지션의 거래량을 보여줍니다 Net Long 는 순 롱 포지션의 거래량
Shepherd Harmonic Pattern
Abdullah Alrai
4.68 (59)
이 지표는 수동 및 자동 방법으로 차트에 그려진 고조파 패턴을 감지합니다. 사용자 매뉴얼은 다음 링크에서 확인할 수 있습니다. 리뷰를 작성하고 문의하면 무료 버전으로 MT4에서 제품을 시도할 수 있습니다. Gartley 및 Nenstar 패턴을 감지하는 데 사용할 수 있습니다. https://www.mql5.com/en/market/product/30181 전체 MT4 버전을 구입하려면 다음에서 구입할 수 있습니다. https://www.mql5.com/en/market/product/15212 참고 사항 지표에는 제어 패널이 있으며 모든 (차트 및 시간대) 설정을 저장합니다. 차트에서 더 많은 공간을 확보하려면 최소화할 수 있으며, 다른 분석 도구로 작업하는 것이 선호되는 경우 모든 지표 데이터를 숨기려면 닫기 버튼을 누를 수 있습니다. 이 지표를 사용하고 설정을 변경하면 이동 평균 또는 볼린저 밴드와 같은 지표를 추가하면 자동으로 템플릿을 저장하고 필요할 때 언제든지 로드할 수
Cycle Sniper
Elmira Memish
4.41 (34)
NEW YEAR SALE PRICE FOR LIMITED TIME!!! Please contact us after your purchase and we will send you the complimentary indicators to complete the system Cycle Sniper is not a holy grail but when you use it in a system which is explained in the videos, you will feel the difference. If you are not willing to focus on the charts designed with Cycle Sniper and other free tools we provide, we recommend not buying this indicator. We recommend watching the videos about the indiactor and system before pu
제작자의 제품 더 보기
VR Locker
Vladimir Pastushak
4.2 (5)
포렉스 전문가 조언자 VR Locker 는 포지티브 잠금을 사용하는 거래 네트워크를 기반으로 하는 자동 거래 전략입니다. 양의 자물쇠는 매도 포지션보다 매수 포지션보다 높고, 양쪽 포지션이 같은 로트로 열려 있는 경우의 거래 계좌 상황입니다. set 파일, 지침, 멋진 보너스를 받으시려면 저한테 문자 하세요 어드바이저의 작업 모니터링은 저자 프로필 에서 확인하실 수 있습니다 전문가 조언자는 EURUSD 통화 쌍을 위해 개발되었지만 다른 통화 및 금융 상품에 대해 작업할 수 있습니다. 조언자의 원리를 이해하려면 전략 테스터 또는 데모 계정으로 실행하기만 하면 됩니다. VR Locker 는 두 개의 시장 포지션을 동일한 양으로 반대 방향으로 엽니다. 가격이 어디로 가는지에 따라 어드바이저는 시작 위치를 '확장', 포지티브 잠금을 작성합니다. 위치 간 거리가 설정으로 지정된 거리 이상이 된 후 어드바이저는 새로운 성을 만드는 작업을 진행합니다. 자물쇠로 작업할 경우 고정되지 않은 이익
VR Smart Grid
Vladimir Pastushak
4.35 (177)
VR Smart Grid는 적은 수익으로 다수의 시장 포지션을 부분적으로 청산할 수 있는 스마트 트레이딩 어드바이저입니다. 작은 부품을 닫으면 손실 위치를 빠르고 효율적으로 줄일 수 있습니다. 여러 가지 신중한 거래 전략이 고문의 알고리즘에 프로그래밍되어 있습니다. 주요 거래 전략은 포지션 네트워크를 구축하고 주어진 이익으로 작은 부분에서 포지션을 마감하는 것을 기반으로 합니다. 어드바이저는 시장 포지션을 분석하고 해당 로트를 여러 부분으로 나눕니다. 결과적으로 해당 포지션의 마감 부분에 대한 최소 평균 가격을 계산합니다. 이 접근 방식 덕분에 평균 가격은 현재 시장 가격에 최대한 가깝고 작은 가격 변동으로 인해 계산된 위치의 일부가 종료됩니다. set 파일, 지침, 멋진 보너스를 받으시려면 저한테 문자 하세요 어드바이저의 작업 모니터링은 저자 프로필 에서 확인하실 수 있습니다 VR Smart Grid Expert 어드바이저의 거래 전략에 프로그래밍된 시장 포지션을 청산하는 방법
VR Smart Grid MT5
Vladimir Pastushak
4.32 (25)
VR Smart Grid는 적은 수익으로 다수의 시장 포지션을 부분적으로 청산할 수 있는 스마트 트레이딩 어드바이저입니다. 작은 부품을 닫으면 손실 위치를 빠르고 효율적으로 줄일 수 있습니다. 여러 가지 신중한 거래 전략이 고문의 알고리즘에 프로그래밍되어 있습니다. 주요 거래 전략은 포지션 네트워크를 구축하고 주어진 이익으로 작은 부분에서 포지션을 마감하는 것을 기반으로 합니다. 어드바이저는 시장 포지션을 분석하고 해당 로트를 여러 부분으로 나눕니다. 결과적으로 해당 포지션의 마감 부분에 대한 최소 평균 가격을 계산합니다. 이 접근 방식 덕분에 평균 가격은 현재 시장 가격에 최대한 가깝고 작은 가격 변동으로 인해 계산된 위치의 일부가 종료됩니다. set 파일, 지침, 멋진 보너스를 받으시려면 저한테 문자 하세요 어드바이저의 작업 모니터링은 저자 프로필 에서 확인하실 수 있습니다 VR Smart Grid Expert 어드바이저의 거래 전략에 프로그래밍된 시장 포지션을 청산하는 방법
VR Lollipop MT5
Vladimir Pastushak
2.33 (6)
수익을 키우는 것 은 트레이딩 로봇 VR 롤리팝 의 주요 전략입니다. 추세 방향으로 거래하고, 추세 방향으로 포지션을 추가하고, 포지션을 무손실로 전환하고, 가능한 한 빨리 손실을 줄이는 것이 VR 롤리팝의 거래 전략의 원칙이었습니다. 추세 방향 거래는 동적 추적 손절매 와 결합하여 모든 추세 움직임을 수집하는 가장 효과적인 방법입니다. 트레이딩 로봇은 실제 손절매 및 이익실현 레벨을 설정합니다. 가상 레벨 을 사용하는 경우에도 손절매 및 이익실현은 실제 종가를 숨길 뿐만 아니라 추가적인 보호 역할을 합니다. 설정, 설정 파일, 데모, 지침, 문제 해결은 [블로그] 에서 피드백 읽기 또는 쓰기 [링크] 버전 [MetaTrader 4] 트레이딩 로봇은 주기적으로 작동합니다. 사이클이란 프로그램이 시작되는 순간, 트레이딩 로봇이 이전에 개설한 포지션이 전혀 없거나 모든 포지션이 무손실로 전환된 순간, 모든 포지션이 청산되거나 무손실로 전환되는 순간을 말합니다. 트레이딩 로봇은 동
VR Lollipop
Vladimir Pastushak
4.67 (12)
수익을 키우는 것 은 트레이딩 로봇 VR 롤리팝 의 주요 전략입니다. 추세 방향으로 거래하고, 추세 방향으로 포지션을 추가하고, 포지션을 무손실로 전환하고, 가능한 한 빨리 손실을 줄이는 것이 VR 롤리팝의 거래 전략의 원칙이었습니다. 추세 방향 거래는 동적 추적 손절매 와 결합하여 모든 추세 움직임을 수집하는 가장 효과적인 방법입니다. 트레이딩 로봇은 실제 손절매 및 이익실현 레벨을 설정합니다. 가상 레벨 을 사용하는 경우에도 손절매 및 이익실현은 실제 종가를 숨길 뿐만 아니라 추가적인 보호 역할을 합니다. 설정, 설정 파일, 데모, 지침, 문제 해결은 [블로그] 에서 피드백 읽기 또는 쓰기 [링크] 버전 [MetaTrader 5] 트레이딩 로봇은 주기적으로 작동합니다. 사이클이란 프로그램이 시작되는 순간, 트레이딩 로봇이 이전에 개설한 포지션이 전혀 없거나 모든 포지션이 무손실로 전환된 순간, 모든 포지션이 청산되거나 무손실로 전환되는 순간을 말합니다. 트레이딩 로봇은 동
VR Donchian
Vladimir Pastushak
4.82 (17)
VR Donchian 표시기는 Donchian 채널의 향상된 버전입니다. 개선 사항은 채널의 거의 모든 기능에 영향을 주었지만 주요 운영 알고리즘과 채널 구성은 그대로 유지되었습니다. 현재 추세에 따라 볼 표시기에 레벨 색상 변경이 추가되었습니다. 이는 거래자에게 추세 또는 플랫의 변화를 명확하게 보여줍니다. 스마트폰, 이메일 또는 MetaTrader 터미널 자체를 통해 두 채널 수준 중 하나의 돌파에 대해 거래자에게 알리는 기능이 추가되었습니다. 가격표가 추가되어 거래자가 차트에서 가격 수준을 볼 수 있습니다. 고전적인 Donchian 지표의 작동 알고리즘은 트레이더가 지표가 계산할 기간 수를 직접 설정할 수 있다는 사실로 인해 최적화되고 가속화되었습니다. 고전적인 Donchian 지표는 MetaTrader 터미널에서 사용할 수 있는 전체 내역을 계산하며, 이는 MetaTrader 터미널에 수학적 계산을 많이 로드합니다. VR Donchian 지표는 트레이더가 설정에 설정한 금액만
FREE
VR Donchian MT5
Vladimir Pastushak
4.81 (16)
VR Donchian 표시기는 Donchian 채널의 향상된 버전입니다. 개선 사항은 채널의 거의 모든 기능에 영향을 주었지만 주요 운영 알고리즘과 채널 구성은 그대로 유지되었습니다. 현재 추세에 따라 볼 표시기에 레벨 색상 변경이 추가되었습니다. 이는 거래자에게 추세 또는 플랫의 변화를 명확하게 보여줍니다. 스마트폰, 이메일 또는 MetaTrader 터미널 자체를 통해 두 채널 수준 중 하나의 돌파에 대해 거래자에게 알리는 기능이 추가되었습니다. 가격표가 추가되어 거래자가 차트에서 가격 수준을 볼 수 있습니다. 고전적인 Donchian 지표의 작동 알고리즘은 트레이더가 지표가 계산할 기간 수를 직접 설정할 수 있다는 사실로 인해 최적화되고 가속화되었습니다. 고전적인 Donchian 지표는 MetaTrader 터미널에서 사용할 수 있는 전체 내역을 계산하며, 이는 MetaTrader 터미널에 수학적 계산을 많이 로드합니다. VR Donchian 지표는 트레이더가 설정에 설정한 금액만
FREE
VR Calculate Martingale
Vladimir Pastushak
5 (5)
The VR Calculate Martingale indicator is a powerful order and position calculator for calculating profit or loss. With the help of the order and position calculator, a trader can calculate the average price of any forex currency, stocks or crypto currency. Now you can connect the indicator and start superimposing virtual orders on your real orders and positions. By creating additional virtual positions, you can calculate any development of the situation. The indicator has a built-in lot calculat
VR Atr Pro MT5
Vladimir Pastushak
4.75 (4)
가상현실 ATR Pro 지표는 금융 상품의 목표 수준을 결정하는 강력한 전문 도구이다. 지표의 효과는 실제 및 데모 계정에 대한 수천 가지 테스트를 통해 입증되었다. 실제 실제 통계를 사용하여 실제 데이터로 구동되는 가상현실 ATR Pro 지표. 통계는 고집스러운 것이며, 수학적 계산에서 실제 통계를 사용하면 금융 상품의 정확한 목표 수준을 계산할 수 있다. set 파일, 지침, 멋진 보너스를 받으시려면 저한테 문자 하세요 장점 지표에는 여러 가지 장점이 있으며 다음은 그 중 몇 가지입니다. 지표의 높은 정확도 초자연적 띠는 계산에서 제외할 수 있습니다. 차트 상에 직접 목표 수준을 단순히 표시하는 것. 모든 금융 상품(Forex, Metals, CFD, Futures, Crypto)과 함께 작동합니다. 그것은 변경되지 않으며, 그 해석을 지속적으로 저장합니다. Stop Loss 및 Take Profit 수준을 결정하는 데 효과적입니다. 스마트폰 알림, 이메일 및 MetaTrader
VR Watch list and Linker MT5
Vladimir Pastushak
4.89 (9)
VR 감시 목록 및 링커 - 터미널용 스크리너 애플리케이션 메타트레이더 . 가장 흥미롭고 기술적인 금융 상품을 더 쉽게 찾을 수 있습니다. 이 스크리너는 bybit, Moscow Exchange, American Exchange, 외환 및 암호화폐 시장, 금속 시장 등의 거래소에서 트레이더가 거래하는 데 사용되며 소품 회사에서 거래하는 데 사용됩니다. 금융상품의 선택은 수동으로 수행됩니다. 스크리너는 MetaTrader 터미널의 오픈 차트를 연결하고, 금융상품 변경 시 각 차트의 데이터를 별도로 표시합니다. 설정, 파일 설정, 데모 버전, 지침, 문제 해결 등은 다음에서 얻을 수 있습니다. [블로그] 다음에서 리뷰를 읽거나 작성할 수 있습니다. [링크] 버전: [메타트레이더4] 스크리너를 사용하면 거래자가 가장 기술적인 금융 상품을 찾고 유동성이 낮고 위험이 높은 상품에 대한 거래를 제외하는 데 도움이 됩니다. 스크리너를 사용하면 티커가 포함된 시트를 쉽고 빠르게 생성 및 변
FREE
VR Watch list and Linker
Vladimir Pastushak
4.67 (9)
VR 감시 목록 및 링커 - 터미널용 스크리너 애플리케이션 메타트레이더 . 가장 흥미롭고 기술적인 금융 상품을 더 쉽게 찾을 수 있습니다. 이 스크리너는 bybit, Moscow Exchange, American Exchange, 외환 및 암호화폐 시장, 금속 시장 등의 거래소에서 트레이더가 거래하는 데 사용되며 소품 회사에서 거래하는 데 사용됩니다. 금융상품의 선택은 수동으로 수행됩니다. 스크리너는 MetaTrader 터미널의 오픈 차트를 연결하고, 금융상품 변경 시 각 차트의 데이터를 별도로 표시합니다. 설정, 파일 설정, 데모 버전, 지침, 문제 해결 등은 다음에서 얻을 수 있습니다. [블로그] 다음에서 리뷰를 읽거나 작성할 수 있습니다. [링크] 버전: [메타트레이더5] 스크리너를 사용하면 거래자가 가장 기술적인 금융 상품을 찾고 유동성이 낮고 위험이 높은 상품에 대한 거래를 제외하는 데 도움이 됩니다. 스크리너를 사용하면 티커가 포함된 시트를 쉽고 빠르게 생성 및 변
FREE
VR Sync Charts MT5
Vladimir Pastushak
5 (4)
VR Sync Charts는 창 간의 레이아웃을 동기화하는 유틸리티입니다. VR Sync Charts를 사용하여 추세 수준, 수평 수준, 피보나치 표시가 모든 차트와 동기화됩니다. 본 유틸리티를 사용하여 MetaTrader 터미널에서 모든 표준 그래픽 개체를 동기화할 수 있으며 모든 추세, Gann 라인 및 기타 개체가 인접 차트에 정확하게 복사됩니다. 더 이상 괘선과 표시를 수동으로 복사할 필요가 없습니다. 아래 그림과 비디오에서 VR Sync Charts 유틸리티의 작업을 보고 평가할 수 있습니다. 권장 사항: 모든 차트에 지표를 설정하기. 터미널 설정에서 «더블 클릭으로 개체 선택» 기능을 설정하기. 본 프로그램을 전략 시험에서 테스트할 수 없습니다. 아래 비디오를 보십시오. 혜택 모든 그래픽 개체를 동기화함. 모든 시간대와 차트 동기화 모든 업데이트는 무료입니다 초보자뿐만 아니라 전문 트레이더 모두에게 적합함 설정이 많지 않아 선택적으로 동기화를 할 수 있음. 모든 금융 상품
VR Ticks MT5
Vladimir Pastushak
4.33 (3)
VR Ticks는   스캘핑 기반 전략에 대한 특별한 지표입니다. 이 지표 덕분에 거래자는 금융상품의 메인 차트에서 직접 틱 차트를 볼 수 있습니다. 틱 차트를 사용하면 가능한 한 정확하게 시장에 포지션을 입력하거나 시장에서 포지션을 청산할 수 있습니다. VR Ticks는 방향에 따라 색상이 변하는 선 형태로 진드기 데이터를 표시합니다. 이를 통해 진드기의 상황을 시각적으로 이해하고 평가할 수 있습니다. 틱 차트의 장점은 기간을 고려하지 않고 가격 변동을 기반으로 작성된다는 것입니다. VR Ticks는 가능한 가장 최소한의 차트를 구축합니다. 설정, 세트 파일, 데모 버전, 지침, 문제 해결 등은   [블로그]   에서 확인할 수 있습니다. [링크]   에서 리뷰를 읽거나 작성할 수 있습니다. [MetaTrader 4]   용 버전 틱은 하나의 가격 변동입니다. 한 번의 가격 변동에 대해 가격은 하나 또는 여러 포인트만큼 변경될 수 있습니다.   진드기가 움직임이라는   것을 이
FREE
VR Sync Charts
Vladimir Pastushak
5 (7)
VR Sync Charts는 창 간의 레이아웃을 동기화하는 유틸리티입니다. VR Sync Charts를 사용하여 추세 수준, 수평 수준, 피보나치 표시가 모든 차트와 동기화됩니다. 본 유틸리티를 사용하여 MetaTrader 터미널에서 모든 표준 그래픽 개체를 동기화할 수 있으며 모든 추세, Gann 라인 및 기타 개체가 인접 차트에 정확하게 복사됩니다. 더 이상 괘선과 표시를 수동으로 복사할 필요가 없습니다. 아래 그림과 비디오에서 VR Sync Charts 유틸리티의 작업을 보고 평가할 수 있습니다. 권장 사항: 모든 차트에 지표를 설정하기. 터미널 설정에서 «더블 클릭으로 개체 선택» 기능을 설정하기. 본 프로그램을 전략 시험에서 테스트할 수 없습니다. 아래 비디오를 보십시오. 혜택 모든 그래픽 개체를 동기화함. 모든 시간대와 차트 동기화 모든 업데이트는 무료입니다 초보자뿐만 아니라 전문 트레이더 모두에게 적합함 설정이 많지 않아 선택적으로 동기화를 할 수 있음. 모든 금융 상품
VR Alert
Vladimir Pastushak
5 (1)
VR Alert是一种实用工具,设计用于指示交易者价格达到给定水平。신호 레벨은 수평뿐만 아니라 비스듬하게 설정할 수 있다. 따라서 거래자는 금융 분야에서 최신 도구를 얻을 수 있는 새로운 기회와 기회를 얻는다. 가상현실 알림 유틸리티 덕분에 더 이상 모니터 근처에 오래 앉아 있을 필요가 없다. 당신은 안전하게 당신의 가정 집안일에 대해 갈 수 있습니다, 작업 의무를 수행, 가족과 함께 시간을 보내고. 당신의 임무는 단순히 레벨을 설정하고 정보의 네 가지 방법 중 하나를 선택하는 것이다. 유틸리티는 스마트폰, 이메일로 알림을 보내고 표준 알림 창과 소리를 표시하며 그래프를 빨간색으로 칠할 수 있다. 유틸리티의 모든 제어는 차트의 마우스로 수행된다. 권장 사항: 단말기를 구성하여 스마트폰으로 푸시 메시지를 보낼 수 있도록 구성하고 블로그의 지침입니다. 단말이 전자 메일 메시지를 전자 메일로 보내도록 구성하고 블로그의 지침입니다. 그냥 네비게이터에서 차트로 표시기를 드래그합니다. 표시기의 이름
VR Alert MT5
Vladimir Pastushak
5 (2)
지표의 형태로 만들어진 VR 경고 유틸리티는 특정 수준에 도달하는 가격이나 지표에 대해 상인에게 알리기 위해 가격 또는 기타 지표를 모니터링하도록 설계되었습니다. 신호 레벨은 수평뿐만 아니라 비스듬하게 설정할 수 있다. 따라서 거래자는 금융 분야에서 최신 도구를 얻을 수 있는 새로운 기회와 기회를 얻는다. 가상현실 알림 유틸리티 덕분에 더 이상 모니터 근처에 오래 앉아 있을 필요가 없다. 당신은 안전하게 당신의 가정 집안일에 대해 갈 수 있습니다, 작업 의무를 수행, 가족과 함께 시간을 보내고. 당신의 임무는 단순히 레벨을 설정하고 정보의 네 가지 방법 중 하나를 선택하는 것이다. 유틸리티는 스마트폰, 이메일로 알림을 보내고 표준 알림 창과 소리를 표시하며 그래프를 빨간색으로 칠할 수 있다. 유틸리티의 모든 제어는 차트의 마우스로 수행된다. 출시 당시 유틸리티는 차트에서 다른 지표에 대해 검사합니다. VR 경고의 감독하에 차트에 표시되는 부분이 있는 지표입니다. 추적할 수 있는 모
The VR Calculate Martingale indicator is a powerful order and position calculator for calculating profit or loss. With the help of the order and position calculator, a trader can calculate the average price of any forex currency, stocks or crypto currency. Now you can connect the indicator and start superimposing virtual orders on your real orders and positions. By creating additional virtual positions, you can calculate any development of the situation. The indicator has a built-in lot calculat
VR Grid Mt5
Vladimir Pastushak
3.44 (9)
The indicator marks up charts in its own way. In contrast to the standard marking method, VR Grid marks chart with the specified step and links the grid to round price values. The VR Grid indicator keeps the mark up and scale, so that the grid cells always have a constant size. Advantages It builds a custom grid on the chart. The grid is linked to circular levels. It is possible to set any step for the grid. You can set the color, style, and thickness for the entire grid or for specific levels.
FREE
VR System
Vladimir Pastushak
VR 시스템 은 단순한 지표가 아니라 금융 시장 거래를 위한 전체적으로 균형 잡힌 거래 시스템입니다. 이 시스템은 고전적인 거래 규칙과 지표 이동 평균 및 Donchian 채널 의 조합을 기반으로 구축되었습니다. VR 시스템 은 시장 진입 규칙, 시장 포지션 보유 규칙, 포지션 청산 규칙을 ​​고려합니다. 간단한 거래 규칙, 최소한의 위험 및 명확한 지침은 VR 시스템을 금융 시장 거래자에게 매력적인 거래 전략으로 만듭니다. 설정, 세트 파일, 데모 버전, 지침, 문제 해결 등은 다음에서 얻을 수 있습니다. [블로그] 다음에서 리뷰를 읽거나 작성할 수 있습니다. [링크] 버전 [MetaTrader 5] 거래 시스템은 이동 평균과 Donchian 채널이라는 두 가지 결합 지표로 구성됩니다. Donchian 채널 – 금융 상품의 현재 상태를 결정하기 위해 설계되었으며 추세 또는 평면을 결정하는 고전적인 규칙에 따라 구성되었습니다. 새로운 로컬 최대값이 이전 것보다 높고, 새로운
VR Close Orders MT5
Vladimir Pastushak
3 (2)
The VR Close orders script is designed to close positions in the terminal at a profit or loss mark set by the trader. The program is written as a script and can work together on the same chart with any other indicators and expert advisors. The program has a simple visual panel and is easy to configure with the mouse. With this program's help, the trader can automatically close positions and delete orders depending on the conditions set.  There is often a situation when you need to close position
FREE
VR Pivot MT5
Vladimir Pastushak
VR Pivot is an indicator of key pivot points. Pivot points are a special type of support and resistance levels that are used to determine the strongest price zones. Professional traders use pivot levels to determine prices at which there is a high probability of a price reversal. The levels are calculated using special mathematical formulas, which include the closing, opening, high, and low prices of the previous time period. The most effective is the daily period. It is important to note that a
VR Ticks
Vladimir Pastushak
VR Ticks는 스캘핑 기반 전략에 대한 특별한 지표입니다. 이 지표 덕분에 거래자는 금융상품의 메인 차트에서 직접 틱 차트를 볼 수 있습니다. 틱 차트를 사용하면 가능한 한 정확하게 시장에 포지션을 입력하거나 시장에서 포지션을 청산할 수 있습니다. VR Ticks는 방향에 따라 색상이 변하는 선 형태로 진드기 데이터를 표시합니다. 이를 통해 진드기의 상황을 시각적으로 이해하고 평가할 수 있습니다. 틱 차트의 장점은 기간을 고려하지 않고 가격 변동을 기반으로 작성된다는 것입니다. VR Ticks는 가능한 가장 최소한의 차트를 구축합니다. 설정, 세트 파일, 데모 버전, 지침, 문제 해결 등은 [블로그] 에서 확인할 수 있습니다. [링크] 에서 리뷰를 읽거나 작성할 수 있습니다. [MetaTrader 5] 용 버전 틱은 하나의 가격 변동입니다. 한 번의 가격 변동에 대해 가격은 하나 또는 여러 포인트만큼 변경될 수 있습니다. 진드기가 움직임이라는 것을 이해하는 것이 중요합니다.
FREE
VR Grid
Vladimir Pastushak
4.57 (7)
The indicator marks up charts in its own way. In contrast to the standard marking method, VR Grid marks chart with the specified step and links the grid to round price values. The VR Grid indicator keeps the mark up and scale, so that the grid cells always have a constant size. Advantages It builds a custom grid on the chart. The grid is linked to circular levels. It is possible to set any step for the grid. You can set the color, style, and thickness for the entire grid or for specific levels.
FREE
VR Object Delete All MT5
Vladimir Pastushak
5 (2)
The VR Object Delete All script solves the problem of garbage on the chart. it is often necessary to completely clear the chart of everything that is put on it, comments, lines, objects. The script completely deletes everything, even those objects that are not visible. When working, VR Object Delete All writes everything it does in the terminal log, as well as the names of objects to delete. Displays the number of deleted objects as a separate line. in case of any errors, it will display an erro
FREE
VR Orders History MT5
Vladimir Pastushak
3 (2)
The VR Orders History script is designed to upload a trade report to a csv file. This format is intended for additional analysis of trading history in programs such as EXCEL, Openoffice, and Libreoffice. Thanks to the script, it is now much easier for a trader to analyze their trading history. The program facilitates the analysis of the trading history for the MetaTrader 5 terminal. The trader sees structured trading. The entire report is based on the following principle: Position > Order on the
FREE
VR Orders History
Vladimir Pastushak
4.25 (8)
The VR Orders History script is designed to upload a trade report to a csv file. This format is intended for additional analysis of trading history in programs such as EXCEL, Openoffice, and Libreoffice. Thanks to the script, it is now much easier for a trader to analyze their trading history. The program facilitates the analysis of the trading history for the MetaTrader 5 terminal. The trader sees structured trading. The entire report is based on the following principle: Position > Order on the
FREE
VR Close Orders
Vladimir Pastushak
3.5 (6)
The VR Close orders script is designed to close positions in the terminal at a profit or loss mark set by the trader. The program is written as a script and can work together on the same chart with any other indicators and expert advisors. The program has a simple visual panel and is easy to configure with the mouse. With this program's help, the trader can automatically close positions and delete orders depending on the conditions set.  There is often a situation when you need to close position
FREE
VR Object Delete All
Vladimir Pastushak
5 (1)
The VR Object Delete All script solves the problem of garbage on the chart. it is often necessary to completely clear the chart of everything that is put on it, comments, lines, objects. The script completely deletes everything, even those objects that are not visible. When working, VR Object Delete All writes everything it does in the terminal log, as well as the names of objects to delete. Displays the number of deleted objects as a separate line. in case of any errors, it will display an erro
FREE
VR MULTI PRICES ANALYSIS
Vladimir Pastushak
1 (1)
VR MultiPrice Analysis - 통화쌍에서 통화의 강도를 결정하는 지표. EUR/USD 쌍을 예로 들어보자. 어떤 통화가 현재 약하고 어떤 통화가 강한지 어떻게 판단하는가? 가장 쉽고 신뢰할 수 있는 방법은 EUR를 USD를 제외한 다른 통화와 비교하는 것입니다. 전력 분배 옵션: EUR은 다른 통화에 대해 상승하고 있습니다. 이는 통화가 거래자와 투자자에게 더 매력적이 되거나 좋은 소식이 나왔다는 신호입니다. EUR은 다른 통화에 대해 하락합니다. 이것은 대부분의 거래자와 투자자가 EUR를 없애고 다른 통화를 구매하거나 나쁜 소식이 나왔다는 신호입니다. 이 표시기는 통화마다 다른 가치를 보여준다 - 이것은 유로화시장의 불확실성의 신호 유럽연합화폐(유로화)에 대해 이야기하자면, 이 지표는 미국 달러화를 다른 화폐들과 연결하여 분석합니다. 그 결과 VR MultiPrice Analysis을 사용하면 트레이더는 EUR/USD 통화 쌍의 합성 분석을 받아 전체 통화 쌍의 전체
VR Black Box
Vladimir Pastushak
3.67 (3)
EA VR Black Box는 – 엄격한 가격 추적에 바탕을 둔 강력한 무역 전략이다. 프로그램 알고리즘은 다음과 같은 상황에서 가격 움직임을 분석합니다: 가격이 상승할 때 EA가 금융 도구 구입을 위해 거래하는데; Stop Loss 포지션이 닫히면 거래가 역전되고 EA는 판매를 위해 거래를 계속합니다. 모든 거래는 트레이더의 개입 없이 자동으로 이루어집니다. 이 EA는 실제 폐쇄 포지션의 가격을 실제 Stop Loss 및 Take Profit 수준에서 능숙하게 숨길 수 있으며, 이는 중개인이 암거래를 사용할 경우 거래 수익성에 상당한 영향을 미칩니다. set 파일, 지침, 멋진 보너스를 받으시려면 저한테 문자 하세요 어드바이저의 작업 모니터링은 저자 프로필 에서 확인하실 수 있습니다 VR Black Box EA는 몇 년 동안 실제 계좌에서 거래하는 방식으로 개발되었습니다. 정기적인 업데이트, 새로운 아이디어 테스트, 지표별 거래 구현으로 인해 VR Black Box는 초보 트레
필터:
David T
226
David T 2023.11.11 23:55 
 

Very useful indicator but as most indicators it is not meant to be used as a stand alone but as a confirmation . This indicator helps confirm of the market is breakout out or trending sideways. Still testing it but so far pleased with my purchase.

Yuriskam
206
Yuriskam 2023.06.21 04:44 
 

Этот индикатор будет полезен всем!

GoodMorningg
525
GoodMorningg 2023.04.14 06:20 
 

사용자가 평가에 대한 코멘트를 남기지 않았습니다

elite luis
3331
elite luis 2023.04.03 03:49 
 

Looks Good and Author is responsive supportive, 5 stars for now, Thank you :)

adonis4ex
6278
adonis4ex 2021.08.03 15:14 
 

사용자가 평가에 대한 코멘트를 남기지 않았습니다

Vladimir Pastushak
89694
개발자의 답변 Vladimir Pastushak 2021.08.03 15:16
Thank you!
intan08
1382
intan08 2021.07.28 11:53 
 

Author wasn't knowledgeable about settings for M15 chart.

OLEG SVERDLOV
346
OLEG SVERDLOV 2020.07.21 19:01 
 

사용자가 평가에 대한 코멘트를 남기지 않았습니다

Rafael Cadosch
708
Rafael Cadosch 2020.06.15 23:54 
 

A must tool

Vitali Kadel
2370
Vitali Kadel 2020.06.13 20:18 
 

사용자가 평가에 대한 코멘트를 남기지 않았습니다

Palmix
134
Palmix 2018.11.24 22:59 
 

사용자가 평가에 대한 코멘트를 남기지 않았습니다

adam7samuel
143
adam7samuel 2018.09.23 00:51 
 

LOVE IT so much !! thank you !

Qun Li
579
Qun Li 2018.08.30 03:21 
 

사용자가 평가에 대한 코멘트를 남기지 않았습니다

Tim Eubanks
5733
Tim Eubanks 2018.03.21 03:28 
 

사용자가 평가에 대한 코멘트를 남기지 않았습니다

Maksym Mudrakov
29226
Maksym Mudrakov 2016.08.31 06:01 
 

사용자가 평가에 대한 코멘트를 남기지 않았습니다

Rodrigo da Silva Boa
7137
Rodrigo da Silva Boa 2015.11.26 05:00 
 

사용자가 평가에 대한 코멘트를 남기지 않았습니다

Harikrishnabhai Patel
683
Harikrishnabhai Patel 2015.09.19 09:44 
 

사용자가 평가에 대한 코멘트를 남기지 않았습니다

Pavel Pavlov
666
Pavel Pavlov 2014.12.05 12:42 
 

사용자가 평가에 대한 코멘트를 남기지 않았습니다

Vladimir Pastushak
89694
개발자의 답변 Vladimir Pastushak 2021.02.01 09:08
Спасибо Вам!
Artem Salamatov
123
Artem Salamatov 2014.10.09 08:02 
 

사용자가 평가에 대한 코멘트를 남기지 않았습니다

리뷰 답변
버전 23.15 2023.02.06
Correction of filling objects with color.
버전 23.14 2023.01.30
Correction of the indicator
버전 23.13 2023.01.28
Correction:
Correction of loading the indicator at the start of the terminal. Previously, the indicator might not load.
버전 23.12 2023.01.24
Correction:
Displaying values ​​as lines;

Optimization:
Code optimization;
버전 23.11 2023.01.23
Made:

The indicator code has been heavily optimized. The code has become lighter and faster;
Corrected mathematics, the indicator has become more accurate;
Changed settings, now you can choose which shapes to fill with color;
Improved and connected several types of trader notifications (Alert, Push, email);
버전 21.80 2021.08.24
The indicator is optimized and compiled in the latest build of the terminal.
버전 20.91 2020.09.16
Bug fixes and improvements
버전 20.90 2020.09.15
Added the ability to exclude paranormal bars
Added alert buttons
Indicator code optimized
버전 20.60 2020.06.14
Code optimization for new build terminal
버전 20.57 2020.05.27
Code optimization
Error correction
버전 20.31 2020.03.16
code optimization
버전 20.30 2020.03.14
Changelog:
Levels as areas - you can use areas to set the offset from the originally calculated level as a percentage (Percentage for the area).
Added the ability to calculate the accuracy of entry on a financial instrument (Show the accuracy of the indicator).
Added the ability to change the size of text labels.
Added the ability to change the size and position of notification buttons.
Added the ability to select notification buttons.
Translations of settings into Russian and English.
dded PDF documentation.

Optimized:
Sending alerts - now alerts are sent once after clicking the button. to resend the notification, click the button with the notification type.
Calculation of levels optimized and accelerated.
버전 18.80 2018.08.21
Optimization :
Fixed an issue with the indicator operation in the strategy tester.
버전 18.60 2018.06.25
The indicator has been revised from scratch.
Unnecessary windows have been removed.
Indicator operation speed has been increased.
버전 16.1 2016.01.22
Fixed spelling errors.
버전 15.111 2015.11.24
Fixed display when changing objects by X and Y axes
버전 15.110 2015.11.23
Indicator has been rewritten from scratched. Old bugs are fixed, design is improved, new functionality and color setup are added.
버전 15.70 2015.06.29
Some minor improvements at users' request!
버전 15.61 2015.06.04

Fixed:
Names of the buttons. Names of the buttons are well-arranged now.
High 10 Days, Low 10 Days,
ATR High Current, ATR Low Current,
His ATR High, His ATR Low

Objects are removed when removing the indicator.
버전 15.6 2015.06.01
Added:
Displaying stats on history.
Forecast and result are now displayed for the last 10 days, while previously the readings were shown only for the current day.
버전 15.5 2015.04.30
Fixed:
The indicator display in the new builds.
Operation of the button for enabling/disabling the indicator.

Added:
The ability to import the indicator functions to Expert Advisors and indicators (see the description).
버전 15.3 2015.03.25
Fixed:
Deletion of objects during removal of the indicator.
버전 15.2 2015.02.05
Added:
A button for minimizing the indicator.

Addition made based on users' request.
버전 14.12 2014.12.16
Fixed displaying of information with respect to new terminal builds.