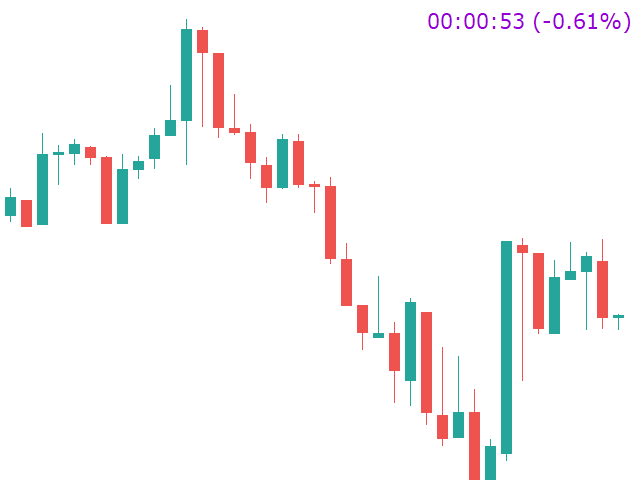
Candle Timer Countdown
캔들 타이머 카운트다운은 현재 막대가 닫히고 새 막대가 형성되기까지 남은 시간을 표시합니다. 시간 관리에 사용할 수 있습니다.
기능 하이라이트
- 현지 시간이 아닌 서버 시간을 추적합니다.
- 구성 가능한 텍스트 색상 및 글꼴 크기
- 기호 일일 변동의 선택적 시각화
- CPU 사용량을 줄이기 위해 최적화
입력 매개변수
- 일별 편차 표시: 참/거짓
- 텍스트 글꼴 크기
- 텍스트 색상
여전히 질문이 있는 경우 다이렉트 메시지로 저에게 연락하십시오. https://www.mql5.com/ko/users/robsjunqueira/
이것이 우리가 지속적으로 발전 할 수있는 유일한 방법이기 때문에 개선을위한 제안에 부담없이 문의하십시오.
또한 당사의 다른 지표 및 전문 고문에 대해 알아보십시오. 다양한 유형의 자산을 거래할 수 있는 다양한 상품이 있음을 알 수 있습니다.


Works good no problems