SORS Osw
- 지표
- William Oswaldo Mayorga Urduy
- 버전: 2.6
- 업데이트됨: 25 6월 2022
- 활성화: 5
THE SORS COMPLEXES
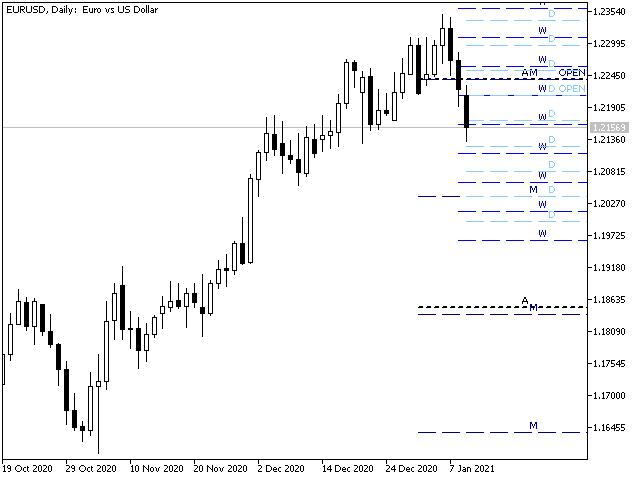
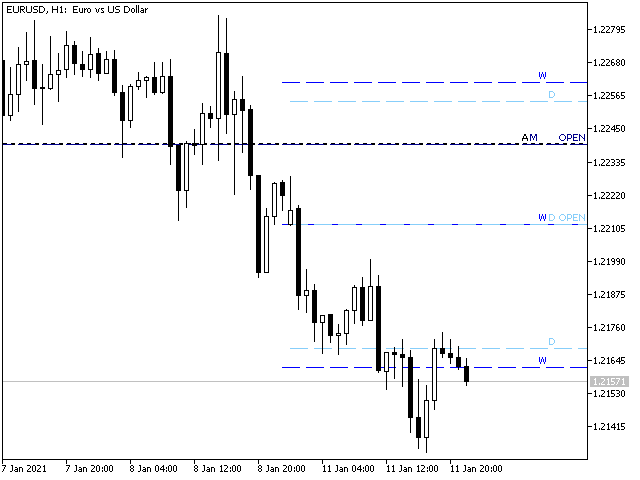
This indicator is designed to draw the SORS lines on the graph, these are the modern way of calculating market points that it usually respects, they are comprised of supports and resistance, but unlike the classics, these are calculated from volatility endogenous and standard deviation,
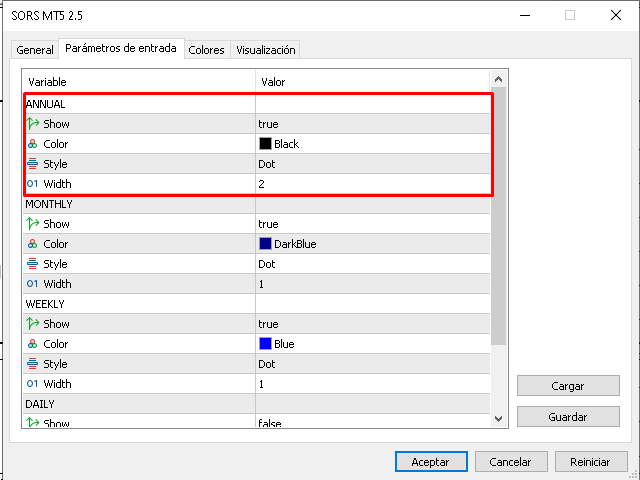
In the configuration you can change the color of each level linear and hide the ones that are not needed.
A = Annual.
M = Monthly.
W = Weekly
D = Daily.