SnR tool
- 지표
- Syahirul Nizzam Bin Haron
- 버전: 2.0
- 업데이트됨: 21 4월 2022
- 활성화: 7
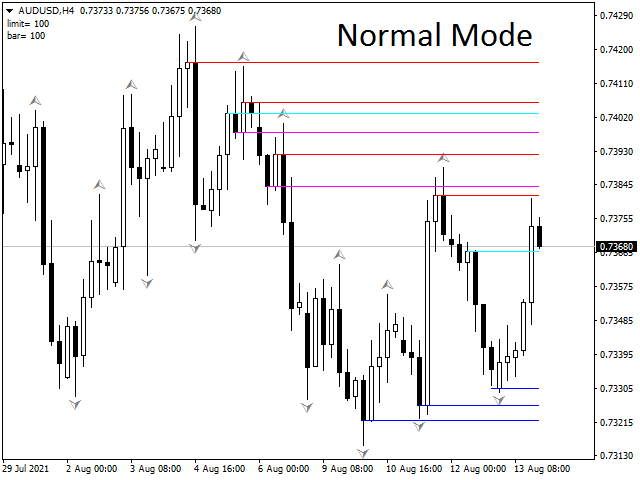
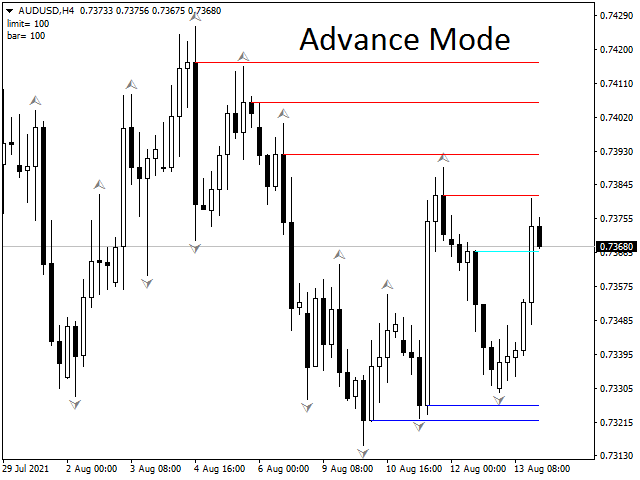
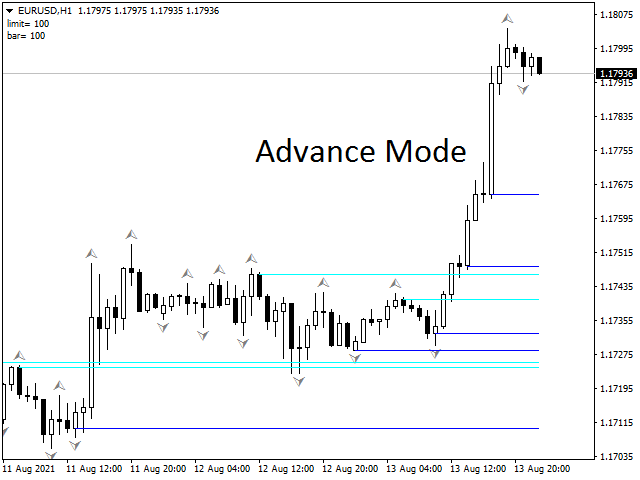
This is a SnR tool.
It is built based on the body candle.
It is a multi timeframe indicator.
There is a powerful scalabar for vertical line slides to limit the candle bars.
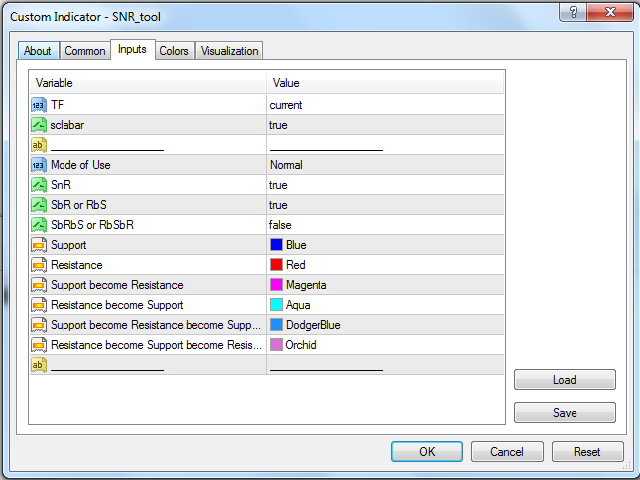
Color for each line can also be changed.
It can detect:
1. Support && Resistance
2. Support become Resistance && vice versa
3.Support become Resistance become Support && vice versa
It also can be used for trading tools and studies on SnR
*New Version avaiable

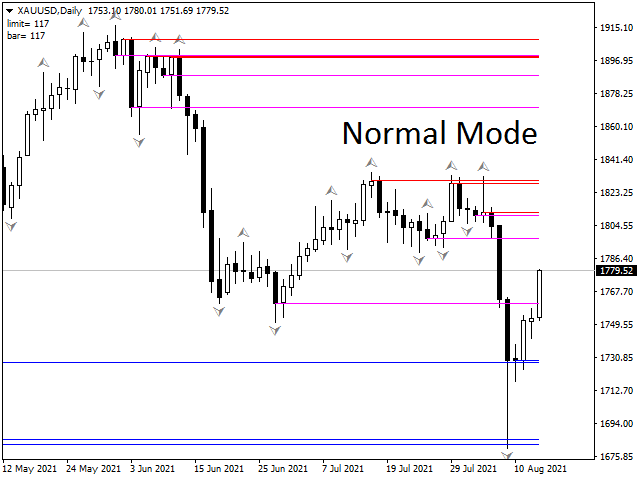


I found this tool to be an escential indicator for plotting the Support and Resistance zones and helps me to identify the "Reaction Zones" that will have major market movements. I found that the 1 Day timeframe worked best for identifying every type of SR (S,R,SbR,RbS,SbRbS,RbSbR) without creating a lot of clutter. The colors I that worked best for me (version 1.50) was S=CornflowerBlue, Resistance=Red, SbR=Magenta, RbS=Aqua, AbRFbS=Firebrick, RbSbR=SeaGreen. The only update I could see to be helpful would be to allow for the customization of the line widths. Thanks you so much for creating a fantatic indicator!