• 미리보기
  • 리뷰
  • 코멘트
  • 새 소식

Lunatic

Ever wonder how to apply zodiac and moon cycle on your trading?

Don't get me wrong, moon cycle doesn't give you when to buy or when to sell.

But it gives you a different time frame that isn't shown in minutes, hourly or daily time frame.

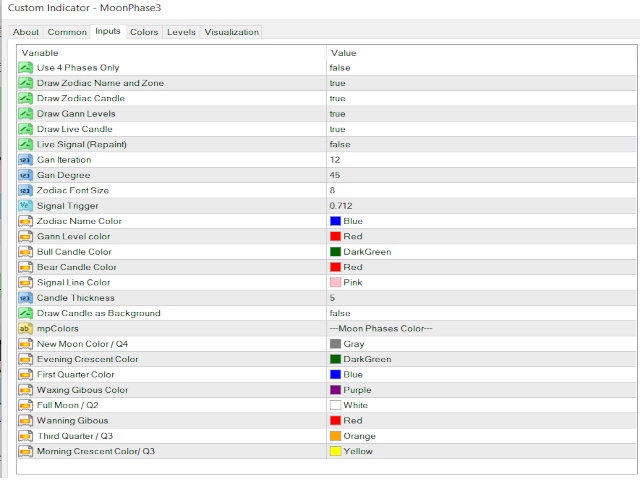
Pay attention to the market movement during New Moon and Full Moon Phases. Set to True "Use 4 Phases Only".

Often the market is trending during these phases.

================

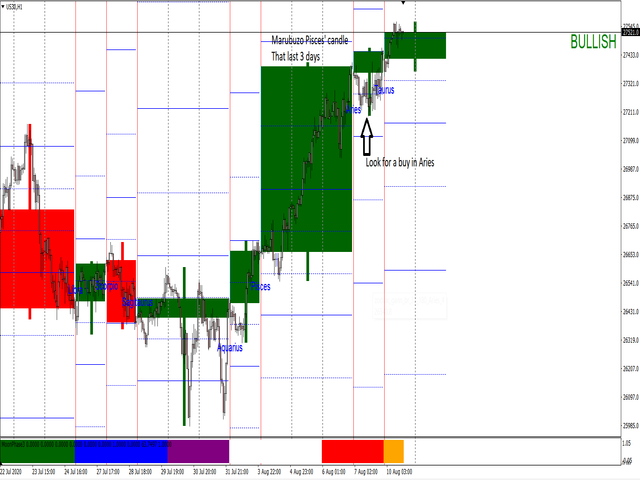
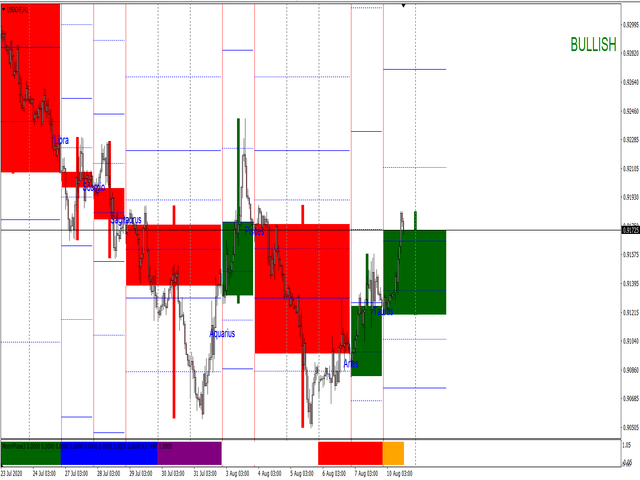
This indi also shows you the current trend of the market and it paints a candle on each zodiac.

It has Heikin Ashi candle and normal candle stick mode. Press "2" in order to switch back and forth.

There are 12 houses in Zodiac, each house will show you how the market is moving.

A zodiac candle that lasts more than 2 days, it indicates a strong support/resistance.

A marubozu candle that appears in a particular zodiac, indicates a strong trend!

================

This indi also shows pivot point using Gann degree, which by default it's set to 45 degree.

45 degree is a very important degree according to Gann. These gann levels on is relative to its own zodiac and it acts as a support and resistance.

================

There is also a signal line that allows to tell you what's the market trend now. You can set it to repaint or not.

When it's set to false (No repaint), signal is updated every new bar. This can be used as a lagging indicator.

But you can always pay attention to the signal trigger line, whenever price croses the signal trigger line, it indicates trend change.

================

MA for zodiac candles is also available.

Press "3" to switch back/forth MA slope. MA slope helps identify the trend within that zodiac candle.

================

Press "4" to switch back/forth Daily Candle Stick overlay style (Heikenashi or Japanese Candle Stick)

================

If the zodiac candle sticks become jumbled, on your keyboard press any of the following keys 1 or Home or Page Up or Page Down or End in order to refresh the indicator.

추천 제품
Impulse fractals indicator - is counter-trend oriented complex market fractal pattern.  Market creates bull/bear impulse, trend starts, fractals on impulsed wave are an agressive pullback signals. Buy arrow is plotted when market is bearish and it's impulse showed up-side fractal, and sell arrow is plotted when market is bullish and it's impulse showed dn-side fractal. Main indicator's adjustable inputs : impulsePeriod - main period of impulse histogram  filterPeriod  - smoothes impulse accordi
DMI ADX Histogram Oscillator I present you one of the most precise and powerful indicator Its made of DMI Histogram together with ADX Oscillator. It has inside arrow to show a buy or sell setup. Features  The way it works its the next one : the histogram is a difference between DMI+ and DMI-.   At the same time together we have the oscillator ADX for Market to run It can be adapted to all type of trading styles such as scalping, day trading or swing. It doesn't matter if its forex, st
Our indicator will help you to make a decision whether to   Buy or Sell , including where to set the   Take Profit   and   Stop Loss . The Buy/Sell signal   will not redraw nor repaint   until new signal occurs. The Take Profit and Stop Loss will change following the market conditions. Our indicator will give   alert   to your mobile/handphone when new buy/sell signal arrive. For best result, combine this indicator with your knowledge on price action and support & resistance, also don't forget
Smart Awesome Volume
Thushara Dissanayake
5 (1)
Smart Awesome Volume   기술 지표는 정확한 신호를 제공하기 위해 캔들 볼륨 데이터를 결합하고 평균값으로 필터링하여 시장 모멘텀을 측정하도록 설계되었습니다. "볼륨이 가격을 확인한다"는 개념에 중점을 두어 트레이더가 시장 모멘텀과 각 캔들 내에서 구매자와 판매자 간의 전투를 쉽게 식별할 수 있도록 합니다. 빠른 경보 시스템을 통해 트레이더는 중요한 거래 이벤트를 파악하고 중요한 시장 움직임을 절대 놓치지 않을 수 있습니다. 실제 볼륨 정보를 사용하여 전략을 개선하는 한 가지 방법은 구매자 및 판매자 볼륨을 사용하여 돌파를 확인하는 것입니다. 이를 통해 거래자는 잠재적인 돌파 기회를 확인하고 정보에 입각한 거래 결정을 내릴 수 있습니다. 또 다른 전략 향상은 전체 추세를 확인하기 위해 거래량 정보를 사용하는 것입니다. 거래량 데이터를 분석함으로써 트레이더는 일반적인 추세 방향에 대해 추가적인 확신을 얻을 수 있습니다. 마지막으로 거래량 정보는 시장의 잠재적인 반전을 식
Trendscanner 지표는 여러 지표와 가격 움직임을 스캔하고 이에 따라 양초에 색상을 지정하여 경고합니다! 다시 칠하지 마세요! 차트에 추가하기만 하면 준비가 완료됩니다! 구운 설정에 따라 모든 자산에서 작동합니다. 표시기는 다음을 제공합니다. 추세가 구매 섹션과 화살표 + ALERT로 변경되면 색상을 구매하세요. 짧은 구간에 들어가 화살표 + ALERT 시 색상을 판매합니다. 시장이 통합되거나 옆으로 움직일 때 중립적인 색상 + ALERT를 제공합니다. 전략: 새로운 추세가 형성되면 거래에 참여하세요. 이전 저점 스윙 아래 또는 이전 고점 스윙보다 높은 위치에 손절매를 설정합니다(공급 수요 지표가 있는 경우 해당 구역을 사용하세요!). 다음 저항이나 지지에서 이익을 얻습니다. (또는 공급 수요를 사용하는 경우 구역) 컴퓨터를 떠나서 거래 아이디어가 실현될 때까지 기다리거나 차트에서 색상이 중립(옆으로)으로 변경되면 종료할 수 있습니다! 원하는 방식으로
Fasts Scalping
Ivan Simonika
Fast Scalping is a new product that allows you to identify the current market phase (uptrend, downtrend or flat). Represents a typical investor strategy that usually indicates a trend change from bearish to bullish. A tool that allows you to determine the direction and strength of a trend. Unlike most indicators, Fast Scalping finds longer trends and gives fewer false signals. This indicator displays arrows of different colors depending on the current state of the market and thus signals the
Boba Binary
Anthonius Soruh
5 (1)
Result look on  https://t.me/BonosuProBinary Pair : All Forex Pairs Time Frame : M1 Expaired : 1-2 Minutes Trade Time Once Time a Day Backtester, Alert Avaliable Average Signals Generate 5 - 20 Signals All Pair A Day Broker Time Zone GMT+3 Default Setting [Example Broker GMT+3 : Alpari, FBS, XM] Support Broker : Deriv, IQOption, Alpari, Binomo, Olymtrade, Qoutex, GCoption, etc Support Auto Trading : MT2 Trading, Binary Bot, Intrade Bot, Binomo Bot, Olymptrad Bot, MX2 trading, Price Pro, etc Ind
Cota Binary
Anthonius Soruh
5 (2)
Result look on  https://t.me/BonosuProBinary Pair : All Forex Pairs Time Frame : M1 Expaired : 1-2 Minutes Trade Time Once Time a Day Backtester, Alert Avaliable Average Signals Generate 5 - 20 Signals All Pair A Day Broker Time Zone GMT+3 Default Setting [Example Broker GMT+3 : Alpari, FBS, XM] Support Broker : Deriv, IQOption, Alpari, Binomo, Olymtrade, Qoutex, GCoption, etc Support Auto Trading : MT2 Trading, Binary Bot, Intrade Bot, Binomo Bot, Olymptrad Bot, MX2 trading, Price Pro, etc Ind
RoyalPrince Fibo
Richard Louis Pastor
4.93 (29)
Royal Prince Fibonacci , has the most advance Trend detection algorithm built into its Alert system combined with the RoyalPrince Non-repaint Arrows with it's own alert system you will never miss the opportunity of the trade.  works on all Charts and all Timeframe on mt4. ︎Best Timeframe M5,M15,M30,H1,H4,D1  Options: • Fibonacci days High and Lows  • Fibonacci Targets • Fibonacci Alert System • Trend Percentage updated consistently • Trend Long Entry & Exit Alerts • Trend Short Entry & Exit A
SuperEntryx
Abdulkarim Karazon
Super Entry는 ATR 값을 기반으로 변경 및 조정할 수 있는 길고 짧은 신호만 측면 tp 및 sl 수준에 제공하는 올인원 화살표 유형 표시기입니다. 이 표시기는 승률 및 기타 통계를 보여주는 백테스팅 패널을 제공합니다. 어느 정도의 정확도를 기대할 수 있는지 명확하게 보여줍니다. 이 표시기는 다시 칠하거나 다시 칠하지 않으며 신호는 지연 없이 열린 바에 표시됩니다. ========================================================================= 매개변수: 설정: 표시기 tp 및 sl 값과 기록 및 신호 기간 알림 : 알림/이메일/푸치 디스플레이 설정 : 화살표 색상/tp 및 sl 라인 색상 및 너비/화살표 유형 ============================================================
SFO Trend Racer
Tevin Marshall
5 (1)
SFO Trend Racer system is a trend indicator created by the CEO and Founder of " Simple Forex Options ", Tevin Marshall . It serves 6 different functions all in one. It shows the trader the entry signals as well as exit signals, whether it is a take profit or a stop loss. It also uses trend filters and signal confirmations so that the trader is able to make the most logically fit decision. Trend Racer uses various filters and specific settings from a plethora of indicators. The beauty in this ind
Market Profile
Artem Titarenko
5 (1)
The "Market Profile" indicator displays the profiles and volumes of periods – weekly, daily, session (8-hour), 4-hour, hour, summary. The VAH/VAL price area is automatically highlighted by a dotted line for each profile (except for the summary). The indicator includes chroma Delta, which colors the profile areas. The areas of prevailing Buys is colored in green, that of Sells - in red. The intensity histogram features blue/red respectively. In the filter mode, the indicator displays the volume a
Wall AM
Andriy Matviyevs'kyy
This indicator identifies the current trend, thus allowing the trader to capture a maximum of strong price movements with pending order. The indicator settings are very simple and its application is intuitive. The line serves as a strong support/resistance level depending on its location relative to the price. Individual dots of the indicator mark short-term resistance/support levels. Place pending orders to enter the market above or below (taking the spread into account) those values. The indic
Wall 2 AM
Andriy Matviyevs'kyy
This indicator identifies the current trend, thus allowing the trader to capture a maximum of strong price movements with pending order. The indicator settings are very simple and its application is intuitive. The line serves as a strong support/resistance level depending on its location relative to the price. Individual dots of the indicator mark short-term resistance/support levels. Place pending orders to enter the market above or below (taking the spread into account) those values. The indi
The simplest and profitable strategy is to break the trend of the small time frame in the direction of the big time frame. 3 moving average multi time frame is for those who trade on a 5-minute frame and want to enter with the direction of the hour; Or  trade on the hour and want to enter with the daily trend, or the minute with the quarter hour trend.... This indicator draw three moving averages that show the direction of the big trend and help to enter with the end of the correction ,and re
Bank Expert
James D Blanks
Bank Expert Indicator Uses A Simple method of tracking price as it moves across the chart and signals when a potential long or short position is active and indicates this to the trader giving you the opportunity to take a position on the market. Or you can simply use this indicator to give yourself signals and determine if you want to take the trade or learn the strategy on your own. The Signals From this indicator are targeted at long-term positions and focus on top quality call outs. 
Moving Pivot Average    The indicator uses very flexible algorithm for pivot value calculating. It allows you to allocate in days a certain time intervals (custom bars) and calculate the average pivot value based on High, Low and Close prices of these bars. The duration of custom bars is set by the "Day Minutes" setting - it can take values from one minute to one day (1440 minutes). How many custom bars will be taken into account is determined by the "Days" setting. The pivot line can be conside
Spike Defense Lime
Tyrae Trae Bailey
Ouch! Watch out for the spikes! They're very sharp. Funny huh? I thought I should show a little humor. All right back to the revised product. Allow me to introduce you my updated EA product: Spike Defense Lime 2. Previously, it only made buy orders. I just upgraded  it and it finally has the power to make both automatic buys and sells with a pretty fair lot size. This bot has an alligator indicator equipped with it with 3 colored lines. It is now available for MT4. An important piece of advice :
Floating peaks oscillator - it the manual trading system. It's based on Stochastik/RSI type of oscillator with dynamic/floating  overbought and oversold levels. When main line is green - market is under bullish pressure, when main line is red - market is under bearish pressure. Buy arrow appears at the floating bottom and sell arrow appears at floating top. Indicator allows to reverse signal types. Main indicator's adjustable inputs : mainTrendPeriod; signalTrendPeriod; smoothedTrendPeriod; tre
Dublgis
Ivan Simonika
Here is a sensitive indicator for Dublgis professionals. It is built on completely new algorithms and is more efficient, on any timeframes, since it filters random price movements. Finds and visually displays price reversal points. This tool can be used as confirmation when making a deal, as well as to determine the direction of the trend and its strength. The indicator was developed as a complement to a number of our other trading tools.
Excellent tool: added features - If you don't know exactly how to place the stop loss. This tool is right for you. After opening the position, 4 levels of stop glosses are drawn and you determine which form of risk suits you. You will significantly increase the chance that the market will not kick you out unnecessarily and then you will reach your tatget without you. If you need more information than a few numbers in the iExposure index, this indicator is for you. Better iExposure indicator
Dynamic SR Trend Channel Dynamic SR Trend Channel is a simple indicator for trend detection as well as resistance/support levels on the current timeframe. It shows you areas where to expect possible change in trend direction and trend continuation. It works with any trading system (both price action and other trading system that use indicators) and is also very good for renko charting system as well. In an uptrend, the red line (main line) serves as the support and the blue line serves as the
VWAP indicator for MT4
Renaud Herve Francois Candel
Moving VWAP Indicator Moving VWAP is an important indicator drawing the Volume-Weighted Average Price (VWAP). The VWAP is a reference used by institutional traders and acts as a level of support / resistance. If price is above VWAP then means market is bullish. If price is below VWAP then means market is bearish. It can be used to enter in the market with low risk (near VWAP) and also identify the correct direction of the market. The Moving VWAP is as simple as a Simple Moving Average.
Price Volume
Ahmet Metin Yilmaz
This indicator calculates price movement with the Volume. The Volume indicates the number of deals in the desired period, but does not show number of contracts per deal. From this point of view, the tick does not reflect the true volume. However it is a valuable demand indicator. Volume and price are calculated with a special formula. There are 3 input parameters EMAPeriod: Price and volume data are calculated using this period of Moving Average first. DEMAPeriod: Results of first EMA, recalcu
이 지표는 실용적인 거래를위한 완벽한 웨이브 자동 분석 지표입니다! =》Increase the choice of international style mode, (red fall green rise style) 대역의 표준화된 정의는 더 이상 다른 사람들의 물결이 아니며 인공 간섭의 그림이 제거되어 접근 방식의 엄격한 분석에서 핵심 역할을 합니다.             현재 구매 할인 중!   색인 내용: 1.         기본파동:   첫째, 가격변동과정에서 기본변동의 변곡점을 찾았고, 물론 그의 주문이 너무 강하지 않아 다음 계산의 기초가 된다. 2.         2차 대역   : 기본파를 기반으로 알고리즘 분석을 통해 보다 명확한 2차 대역을 획득하고, 2차 대역은 파동 분석의 기반 제공 삼.         Wave:   추세가 더 명확하고 직관적이고 방향성이 있습니다.파동의 지속 여부를 분석하기 위해서는 2차 파동 대역의 형태를 살펴보고, 2차 파동의 구성을
This indicator will allow you to evaluate single currency linear regression. WHAT IS LINEAR REGRESSION?(PIC.3) Linear regression is an attempt to model a straight-line equation between two variables considering a set of data values. The aim of the model is to find the best fit that can serve the two unknown values without putting the other at a disadvantage. In this case, the two variables are price and time, the two most basic factors in the Forex market. Linear regression works in such a wa
Jerk Trend
Ivan Simonika
Jerk Trend is a new product that allows you to identify the current market phase (uptrend, downtrend or flat). Represents a typical investor strategy that usually indicates a trend change from bearish to bullish. A tool that allows you to determine the direction and strength of a trend. Unlike most indicators, Jerk Trend finds longer-term trends and gives fewer false signals. This indicator displays arrows of different colors depending on the current state of the market and thus signals the u
BB Maniac
Yuji Hiiragi
5 (1)
このインディケータはボリンジャーバンドを裁量およびEAで実際に利用してきた私自身の経験から、より手軽に、かつ効果的に活用できるよう作成された裁量トレード用サインツールです。 ブレイクアウトでの順張り、リバウンドでの逆張りの両面で利用でき、各種のフィルター機能でより精度の高いサインを発信します 勝敗判定機能により、このインディケータの直近の相場環境に対する有効性を確認できます 全通貨ペア、全タイムフレームで利用できます。リペイントはしません 設定項目は以下の通りです。 Bollinger Bands Period Bollinger Bands Deviation Bollinger Bands Shift Entry Mode ...ボリンジャーバンドにタッチしてからのBreakout(順張り), Rebound(逆張り)のどちらかを指定 Plus Filter ...独自アルゴリズムによるフィルターでシグナルの精度を高めます(Reboundモード専用) Trend Filter ...下で設定する移動平均のトレンド方向でのシグナルに限定します Moving Aver
Raff and Bollinger
Vadim Zotov
4.25 (4)
The robot is intended for trading on a real account. Two channels are being constructed: Hilbert Raff and John Bollinger. The external Raff channel allows you to determine the direction of the global trend. Inside it, in the Bollinger channel, trade is conducted on a trend. Provision is made for disabling martingale and money management, transactions are protected by stop-loss. Features of the trading strategy The robot calculates two channels. The external channel is calculated by the method of
FiboPlusTrend
Sergey Malysh
4.5 (2)
A ready-made trading system based on automatic construction and maintenance of Fibonacci levels for buying and selling on any instrument (symbol) and on any period of the chart. Determination of trend direction (14 indicators). The display of the trend strength and the values of the indicators that make up the direction of the trend. Construction of horizontal levels, support and resistance lines, channels. Choosing a variant for calculating Fibonacci levels (six different methods). Alert system
이 제품의 구매자들이 또한 구매함
Atomic Analyst
Issam Kassas
5 (1)
우선적으로 언급할 점은이 거래 지표가 다시 그리지 않고 지연되지 않으며 이를 통해 수동 및 로봇 거래 모두에 이상적이라는 점입니다. Atomic Analyst는 가격의 강도와 모멘텀을 활용하여 시장에서 더 나은 이점을 찾는 PA Price Action Indicator입니다. 고급 필터를 장착하여 잡음과 거짓 신호를 제거하고 거래 잠재력을 높이는 데 도움이 됩니다. 복잡한 지표의 다중 레이어를 사용하여 Atomic Analyst는 차트를 스캔하고 복잡한 수학적 계산을 간단한 신호와 색상으로 변환하여 초보 트레이더가 이해하고 일관된 거래 결정을 내릴 수 있도록합니다. "Atomic Analyst"는 새로운 및 경험이 풍부한 트레이더를위한 종합적인 거래 솔루션입니다. 프리미엄 지표와 최고 수준의 기능을 하나의 거래 전략에 결합하여 모든 종류의 트레이더에 대한 다재다능한 선택지가되었습니다. 인트라데이 거래 및 스캘핑 전략 : 빠르고 정확한 일일 거래 및 단기 거래를 위해 설계
TPSpro RFI Levels
Roman Podpora
5 (13)
A key element in trading is zones or levels from which decisions to buy or sell a trading instrument are made. Despite attempts by major players to conceal their presence in the market, they inevitably leave traces. Our task was to learn how to identify these traces and interpret them correctly. Reversal First Impulse levels (RFI)   -  Version MT5                INSTRUCTIONS                 RUS                 ENG                                       R ecommended to use with an indicator   -  
현재 20% 할인 ! 초보자 또는 전문가 트레이더를 위한 최고의 솔루션! 이 대시보드 소프트웨어는 28개의 통화 쌍에서 작동합니다. 2가지 주요 지표(Advanced Currency Strength 28 및 Advanced Currency Impulse)를 기반으로 합니다. 전체 Forex 시장에 대한 훌륭한 개요를 제공합니다. 고급 통화 강도 값, 통화 이동 속도 및 모든(9) 시간대의 28 Forex 쌍에 대한 신호를 보여줍니다. 추세 및/또는 스캘핑 기회를 정확히 파악하기 위해 차트의 단일 지표를 사용하여 전체 시장을 볼 수 있을 때 거래가 어떻게 개선될지 상상해 보십시오! 잠재적인 거래를 식별하고 확인하면서 강력한 통화와 약한 통화를 더욱 쉽게 식별할 수 있도록 이 지표에 기능을 내장했습니다. 이 표시기는 통화의 강세 또는 약세가 증가 또는 감소하는지 여부와 모든 시간대에서 수행되는 방식을 그래픽으로 보여줍니다. 추가된 새로운 기능은 현재 시장 조건 변화에 적
XQ Indicator MetaTrader 4
Marzena Maria Szmit
3 (2)
Step into the realm of Forex trading with confidence and precision using XQ, a cutting-edge Forex indicator designed to elevate your trading game to unprecedented heights. Whether you're a seasoned trader or just stepping into the world of currency exchange,   XQ Forex Indicator   empowers you with the insights and signals needed to make informed trading decisions. The signal conditions are a combination of three indicators, and XQ Forex Indicator only display  medium and long-term trends . The
TrendMaestro
Stefano Frisetti
5 (2)
note: this indicator is for METATRADER4, if you want the version for METATRADER5 this is the link: TRENDMAESTRO recognizes a new TREND in the bud, he never makes mistakes. The certainty of identifying a new TREND is priceless. DESCRIPTION TRENDMAESTRO identifies a new TREND in the bud, this indicator examines the volatility, volumes and momentum to identify the moment in which there is an explosion of one or more of these data and therefore the moment in which prices have strong probability of f
기적적인 외환 지표 소개: 정확한 트레이딩의 힘을 발휘하세요 모든 시간대에서 뛰어난 결과를 제공하는 최고의 외환 지표를 찾는데 지친 적이 있나요? 더 이상 찾을 필요가 없습니다! 기적적인 외환 지표가 도래하여 귀하의 트레이딩 경험을 혁신하고 수익을 새로운 고도로 끌어올립니다. 최첨단 기술과 수년간의 정성스런 개발을 토대로 기적적인 외환 지표는 외환 시장에서의 힘과 정확성의 정점으로 떠오릅니다. 이 탁월한 도구는 모든 수준의 트레이더의 요구를 충족시키고 지속적인 수익을 추구하는 데에서 비길 데 없는 우위를 제공하기 위해 설계되었습니다. 기적적인 외환 지표의 가장 큰 장점은 그 뛰어난 적응성에 있습니다. 당신이 데이 트레이더, 스윙 트레이더이든 장기 포지션을 선호하든, 이 지표는 모든 시간대에서 뛰어난 결과를 제공하기 위해 최적화되었습니다. 그러나 그 정확성과 시장의 복잡한 움직임을 포착하는 능력이 참으로 빛을 발하는 것은 1시간 기간대에서 사용할 때입니다. 기적적인 외환 지표의 정확성
TakePropips Donchian Trend Pro
Eric John Pajarillaga Aldana
4.82 (17)
TakePropips Donchian Trend Pro   (MT4)는 Donchian 채널을 사용하여 추세의 방향을 자동으로 감지하고 진입 및 퇴장 거래 신호를 제공하는 강력하고 효과적인 도구입니다! 이 다기능 지표에는 추세 스캐너, 거래 신호, 통계 패널, 스크리너, 거래 세션 및 경고 내역 대시보드가 포함됩니다. 거래 신호를 제공하고 차트 분석 시간을 절약하도록 설계되었습니다! 다음 블로그 게시물에서 사용자 설명서 및 설치 가이드를 다운로드할 수 있습니다.   https://www.mql5.com/en/blogs/post/751368 오늘 50% 할인을 받으세요! 가격이 $98에서 $49로 인하되었습니다! 전략 테스터에서 이 지표를 테스트할 수 있습니다(비주얼 모드 활성화). 실시간 차트에서 테스트하고 싶다면 저에게 메시지를 보내 7일 평가판을 받을 수도 있습니다. 자세한 내용은 설명 아래에 비디오 자습서도 제공됩니다. 질문이 있거나 도움이 필요하면 저에게 연락하십시오.
FX Volume
Daniel Stein
4.6 (35)
모닝 브리핑을 통해 세부 정보와 스크린샷으로 매일 시장 업데이트를 받으세요 여기 mql5 및 텔레그램에서 FX 거래량은 브로커의 관점에서 시장 심리에 대한 실제 통찰력을 제공하는 최초이자 유일한 거래량 지표입니다. 브로커와 같은 기관 시장 참여자가 외환 시장에서 어떤 포지션을 취하고 있는지에 대한 훌륭한 통찰력을 COT 보고서보다 훨씬 빠르게 제공합니다. 차트에서 이 정보를 직접 확인하는 것은 트레이딩의 진정한 판도를 바꾸고 획기적인 솔루션입니다. 다음과 같은 고유한 시장 데이터 인사이트의 이점 비율 는 통화의 매수/매도 포지션 비율을 백분율로 표시 비율 변화 는 선택한 기간 내 매수 비율과 비율 변화를 표시 총 거래량 는 해당 통화의 총 거래량(롱 및 숏)을 로트 단위로 보여줍니다 Volumes Long 는 해당 통화의 모든 롱 포지션의 거래량을 보여줍니다 Volumes Short 는 해당 통화의 모든 숏 포지션의 거래량을 보여줍니다 Net Long 는 순 롱 포지션의 거래량
Cycle Sniper
Elmira Memish
4.41 (34)
NEW YEAR SALE PRICE FOR LIMITED TIME!!! Please contact us after your purchase and we will send you the complimentary indicators to complete the system Cycle Sniper is not a holy grail but when you use it in a system which is explained in the videos, you will feel the difference. If you are not willing to focus on the charts designed with Cycle Sniper and other free tools we provide, we recommend not buying this indicator. We recommend watching the videos about the indiactor and system before pu
Shepherd Harmonic Pattern
Abdullah Alrai
4.68 (59)
이 지표는 수동 및 자동 방법으로 차트에 그려진 고조파 패턴을 감지합니다. 사용자 매뉴얼은 다음 링크에서 확인할 수 있습니다. 리뷰를 작성하고 문의하면 무료 버전으로 MT4에서 제품을 시도할 수 있습니다. Gartley 및 Nenstar 패턴을 감지하는 데 사용할 수 있습니다. https://www.mql5.com/en/market/product/30181 전체 MT4 버전을 구입하려면 다음에서 구입할 수 있습니다. https://www.mql5.com/en/market/product/15212 참고 사항 지표에는 제어 패널이 있으며 모든 (차트 및 시간대) 설정을 저장합니다. 차트에서 더 많은 공간을 확보하려면 최소화할 수 있으며, 다른 분석 도구로 작업하는 것이 선호되는 경우 모든 지표 데이터를 숨기려면 닫기 버튼을 누를 수 있습니다. 이 지표를 사용하고 설정을 변경하면 이동 평균 또는 볼린저 밴드와 같은 지표를 추가하면 자동으로 템플릿을 저장하고 필요할 때 언제든지 로드할 수
ON Trade Waves Patterns Harmonic Elliot Wolfe를 소개합니다. 이는 수동 및 자동 방법을 사용하여 다양한 시장 패턴을 감지하기 위해 개발된 고급 지표입니다. 다음은 그 작동 방식입니다: 조화적 패턴: 이 지표는 차트에 나타나는 조화적 패턴을 식별할 수 있습니다. 이러한 패턴은 Scott Carney의 "Harmonic Trading vol 1 및 2"에서 설명한 것처럼 조화적 거래 이론을 연습하는 트레이더에게 중요합니다. 수동으로 그리든 자동 감지를 사용하든 ON Trade Waves Patterns가 도움을 줄 것입니다. 컨트롤 패널: 이 지표에는 사용자 친화적인 컨트롤 패널이 있습니다. 차트 및 시간 프레임 설정을 저장하여 다양한 구성 간에 쉽게 전환할 수 있습니다. 차트 공간을 최대화하려면 최소화할 수도 있습니다. 다른 분석 도구를 사용하는 것을 선호하는 경우 닫기 버튼을 클릭하여 모든 지표 데이터를 숨길 수 있습니다. 템플릿 저장: 설정을 사
Ultimate Sniper Dashboard
Hispraise Chinedum Abraham
4.84 (25)
299달러로 할인! 추후 가격이 인상될 수 있습니다! 아래 설명을 읽어보세요! Ultimate Sniper Dashboard를 위한 최고의 엔트리 시스템: ULTIMATE DYNAMIC LEVELS. (내 제품을 확인하십시오) Ultimate Sniper Dashboard는 MT4 다중 통화 테스트 제한으로 인해 라이브 시장에서만 작동합니다. Ultimate-Sniper 대시보드를 소개합니다! HA-Sniper와 MA-Sniper를 모두 포함하는 최고의 제품입니다. 그리고 많은 특수 모드. Ultimate Sniper Dashboard는 절대 야수입니다! 초보자 또는 전문가 트레이더를 위한 최고의 솔루션! 다시 움직임을 놓치지 마세요! 단순함과 핍을 좋아하는 트레이더를 위해 특별한 제품을 준비했습니다. 본질적으로 단순한 대시보드는 여러 사용자 지정 알고리즘을 기반으로 28개의 통화 쌍을 살펴보는 모든 작업을 수행합니다. 단 하나의 차트로 전문가처럼 시장을 읽을 수 있습니다. 움직이기
ON Trade Optuma Astro
Abdullah Alrai
5 (4)
물론입니다. 아래는 제공해주신 텍스트의 한국어 번역입니다: MT4용 천문학 지표 소개: 귀하의 최상급 하늘 트레이딩 동반자 트레이딩 경험을 천체의 높이로 끌어올리기 준비가 되셨나요? MT4용 천문학 지표를 소개합니다. 이 혁신적인 도구는 복잡한 알고리즘의 힘을 활용하여 탁월한 천문학적 통찰과 정밀한 계산을 제공합니다. 정보의 우주를 손에 담다: 천문학적 데이터의 보물함을 드러내는 포괄적인 패널을 살펴보세요. 행성의 지오/헬리오센트릭 좌표, 태양/지구 거리, 크기, 길이, 별자리, 황도 좌표 및 적도 좌표, 심지어 수평 좌표 등 각각이 정밀하게 계산되고 아름답게 제시됩니다. 지표에 의해 생성된 수직선은 시간 값에 해당하여 트레이딩 여정에 우주적인 시각을 부여합니다. 행성 라인과 관계: 수정 가능한 스케일과 각도로 차트를 장식하는 행성 라인의 마법을 경험해보세요. 직관적인 컨트롤 패널을 통해 각 행성의 라인의 가시성을 손쉽게 전환할 수 있습니다. 쥰션이나 섹스타일, 사분각, 삼분각, 트
Supply and Demand Dashboard PRO
Bernhard Schweigert
4.82 (22)
현재 20% 할인! 이 대시보드는 여러 기호와 최대 9개의 타임프레임에서 작동하는 매우 강력한 소프트웨어입니다. 주요 지표(최상의 리뷰: 고급 공급 수요)를 기반으로 합니다.   Advanced Supply Demand 대시보드는 훌륭한 개요를 제공합니다. 다음과 같이 표시됩니다.  영역 강도 등급을 포함하여 필터링된 공급 및 수요 값, 영역에 대한/및 영역 내 Pips 거리, 중첩된 영역을 강조 표시하고 모든 (9) 시간 프레임에서 선택한 기호에 대해 4가지 종류의 경고를 제공합니다. 그것은 당신의 개인적인 필요에 맞게 고도로 구성 가능합니다! 당신의 혜택! 모든 트레이더에게 가장 중요한 질문: 시장에 진입하기에 가장 좋은 수준은 무엇입니까? 최고의 성공 기회와 위험/보상을 얻으려면 강력한 공급/수요 영역 내 또는 그 근처에서 거래를 시작하십시오. 손절매를 위한 최적의 장소는 어디입니까? 가장 안전하려면 강력한 수요/공급 구역 아래/위에 정
Gann Price Level
Kirill Borovskii
The indicator is designed to work on any trading platform. The program is based on proprietary algorithms and W.D.Ganna's mathematics, allowing you to calculate target levels of price movement based on three points with the highest degree of certainty. It is a great tool for stock trading. The indicator has three buttons: NEW - call up a triangle for calculation. DEL - delete the selected triangle. DELS - completely remove all constructions. The probability of achieving the goals is more than 80
TPA True Price Action indicator reveals the true price action of the market makers through 100% non-repainting signals (except early signals mode) strictly at the close of a candle! TPA shows entries and re-entries, every time the bulls are definitely stronger than the bears and vice versa. Not to confuse with red/green candles. The shift of power gets confirmed at the earliest stage and is ONE exit strategy of several. There are available now two free parts of the TPA User Guide for our custo
Please send me Direct message on MQL5 CHAT after purchasing the Indicator for Training and Installation Support There are some additional files that is important to use with the Indicator . So be sure to contact me after purchasing the Indicator So that I can add you for training and support . If you find any difficulty with installation then send me Direct message here So that I can connect with you via Anydesk or Teamview for the product installation. " Smart Order Block Indicator " to find
Ferox Breakout
Tat Dat Nguyen
The breakout algorithm is a technique based on price, price features, to shape a breakout strategy. The strategy in this indicator will not be redrawn (none-repaint indicator), it is suitable for short or long term traders In the screenshot is the EURUSD pair, these currency pairs, commodities or stocks, it have similar strength *Non-Repainting (not redrawn) *For Metatrader4 Only *Great For Scalping *Great For Swing Trading *Arrow Entry, Green is Long, Red is Short *Works On Any Timeframe *Work
Indicator : RealValueIndicator Description : RealValueIndicator is a powerful tool designed specifically for trading on the EURUSD pair. This indicator analyzes all EUR and USD pairs, calculates their real currency strength values, and displays them as a single realistic value to give you a head start on price. This indicator will tell you moves before they happen if you use it right. RealValueIndicator allows you to get a quick and accurate overview of the EURUSD currency pair tops and bottoms,
Gann Signal
Kirill Borovskii
Gann Signal is a very simple indicator at first glance, but hidden inside is many years of experience in studying W.D.Ganna methods. The indicator gives accurate BUY/SELL signals, without redrawing. The indicator is very easy to use. All you need to do is attach it to your chart and follow its recommendations. The indicator constantly analyzes the market for entry opportunities. When such an opportunity appears, the indicator gives a signal in the form of an arrow. I repeat, all signals are NOT
IA Trendx3 PRO
Marco Aurelio Santos Costa
What if God Created a Trade System? No miracles... Just see how mathematics can be effective in the market. We managed to combine technical analysis / price action into indicators, creating the best setup for trading, be it in Forex, Indices, or stocks. It took us 2 years to create something that really works, and now it's time for you to discover it. TrendX3 is a revolution in trend analysis. Based on advanced algorithms and real-time data, it provides valuable insights so that you can make inf
Volatility Trend System - a trading system that gives signals for entries. The volatility system gives linear and point signals in the direction of the trend, as well as signals to exit it, without redrawing and delays. The trend indicator monitors the direction of the medium-term trend, shows the direction and its change. The signal indicator is based on changes in volatility and shows market entries. The indicator is equipped with several types of alerts. Can be applied to various trading
Introduction Excessive Momentum Indicator is the momentum indicator to measure the excessive momentum directly from raw price series. Hence, this is an extended price action and pattern trading. Excessive Momentum Indicator was originally developed by Young Ho Seo. This indicator demonstrates the concept of Equilibrium Fractal Wave and Practical Application at the same time. Excessive Momentum detects the market anomaly. Excessive momentum will give us a lot of clue about potential reversal and
Gann Swing Structure
Kirill Borovskii
5 (1)
This indicator is based on the mathematics of the great trader W.D. Ganna. With its help, you can easily find strong levels by analyzing swings to find the optimal entry point. The indicator works on all instruments and all timeframes. The indicator is fully manual and has control buttons. All you need to do is press the NEW button, a segment will appear, which you can place on any movement, swing or even 1 candle that you want to analyze. By placing the segment, press the OK button. A grid (th
A. A2SR이란 무엇입니까 ?   * 선행 기술 지표입니다(재도장 없음, 지연 없음). -- 안내 : https://www.mql5.com/en/blogs/post/734748/page4#comment_16532516 -- 및 https://www.mql5.com/en/users/yohana/blog A2SR에는 지원(수요) 및 저항(공급) 수준을 결정하는 특별한 기술이 있습니다. 우리가 인터넷에서 본 일반적인 방식과 달리 A2SR은 실제 SR 수준을 결정하는 독창적인 개념을 가지고 있습니다. 원래 기술은 인터넷에서 가져온 것이 아니며 인터넷에 게시된 적도 없습니다. A2SR은 거래 스타일에 따라 SR 수준을 자동으로 선택합니다. 시간 프레임을 변경해도 SR 레벨은 그대로 유지됩니다. 사용하는 시간 프레임에서 실제 SR을 얻지 못하기 때문입니다. A2SR은 거래를 위한 완전한 상품을 보유하고 있습니다 . 실제 지원(수요) 및 저항(공급)에 대한 진정한 개념. 뉴스 이벤트
SMCpro VIP MT4  Original Price  $620   ---  Currently Price 20% OFF ( for unlimited use )   BONUS  AUX VIP Club 2024 : Include  EA Airbag  and  Load Data History  to enhance the performance of this tool to its maximum potential  Click Here to Download Files   ( for users only )   Hello World! Introducing.. SMCpro VIP tool and Indicator for MetaTrader 4, designed to revolutionize your trading experience with the ICT Smart Money Concept. This system is meticulously crafted to empower trad
크리스마스 40% 할인! 1월 1일에 가격이 $250로 인상됩니다! GoldenGate Entries를 소개합니다: 혁신적인 트레이딩 솔루션! GoldenGate Entries (GGE)를 사용하여 거래하는 혁신적인 방법을 발견하세요. GGE는 귀하의 거래 경험을 향상시키기 위해 디자인된 고급 지표로, 사용자에게 정확성과 자신감을 부여하는 포괄적인 기능을 제공합니다. 페어: 아무거나 (FX - 상품 - 주식 - 주식 - 암호화폐) 타임프레임: 15분에서 H1까지 주요 기능: 매수 및 매도 화살표 표시: 팝업 알림과 함께 매수 및 매도 화살표 표시를 받아 언제나 정보를 확인할 수 있습니다. GoldenGate_Algo: 시장 상황에 대한 통찰력을 얻으려면 GoldenGate_Algo를 사용하세요. 시장이 '과매도'인지 '과매수'인지 평가하는 강력한 도구입니다. 현재 트렌드 분석: 현재 보고 있는 타임프레임에서 현재 트렌드에 액세스하여 거래를 주류 시장 방
Candle Power Pro
Thushara Dissanayake
4.33 (6)
Candle Power Pro   표시기로 실제 볼륨 정보의 힘을 잠금 해제하십시오. 이 동적 도구는 각 양초의 실제 볼륨 데이터를 캡처하여 총 볼륨의 백분율로 표시합니다. 그렇게 함으로써 시장에서 구매자와 판매자 사이의 지속적인 투쟁을 식별할 수 있습니다. Candle Power Pro는 구매자와 판매자 간의 전투를 총 볼륨의 비율로 표시하여 시장 역학에 대한 귀중한 통찰력을 제공합니다. 구매자와 판매자의 거래량을 분석하여 브레이크아웃을 쉽게 확인할 수 있어 보다 정확한 진입점과 퇴장점을 확보할 수 있습니다. 또한 구매자와 판매자의 거래량을 활용하여 추세를 확인할 수 있으므로 거래 전략의 신뢰성을 높일 수 있습니다. 또한 매수자와 매도자 수의 변화를 분석하여 추세 반전을 식별할 수 있으므로 시장 변화를 한발 앞서 나갈 수 있습니다. 이 표시기는 거래 경험을 향상시키는 다양한 기능을 제공합니다. 쉽게 시각화할 수 있도록 볼륨 평균을 선으로 그리고 추가 분석을 위해 볼륨 백분율을 19
Market Breaker Updated version 3
Allistair Kabelo Mandow
1 (1)
Features for software Main functions: Accurate entry signals WITHOUT REPAINTING! Once a signal appears, it remains valid! This is a significant distinction from repainting indicators that might provide a signal and then alter it, potentially leading to deposit losses. Now, you can enter the market with higher probability and precision. There's also a function to colour candles after an arrow appears until the target (take profit) is reached or a reversal signal appears . Display of STOP LOSS
Weis Wave with Alert
Trade The Volume Waves Single Member P.C.
4.79 (19)
Rental/Lifetime Package Options and Privileges' * For optimum results the yearly or lifetime package is suggested due to live training and Discord  channel trading with the  creator! Rent Monthly Six Months   Yearly/Lifetime Weis Wave with Speed with Alert+Speed Index x x x Manual  x x x Quick Set up Video x x x Blog x x x Lifetime Updates x x x Setup and Training Material x x Free Rectangle Break Alert Tool      x Discord Access Channel "The SI traders" x 2-hour live methodology traini
제작자의 제품 더 보기
Volume Profile Institutional Live
Agustinus Biotamalo Lumbantoruan
3 (1)
Unlock the Power of Market Analysis with Precision Are you ready to take your trading to the next level? The "Institutional Volume Profile" indicator is here to empower your trading decisions like never before. Key Features: Custom Volume Profiles : Plot volume profiles effortlessly by simply adding horizontal lines or Fibonacci tools on your MetaTrader 5 chart. There's no limit to how many profiles you can create. Insightful Visualization : The indicator beautifully displays crucial information
Institutional Momentum Stochastic Index
Agustinus Biotamalo Lumbantoruan
The Stochastic Momentum Index (SMI), developed by William Blau and featured in the January 1993 edition of Technical Analysis of Stocks & Commodities magazine, introduces a unique perspective to trading analysis. Distinguished from the conventional Stochastic Oscillator, which evaluates the current close in relation to the recent x-period high/low range, the SMI assesses the close's position relative to the midpoint of this range. This innovation yields an oscillator with a range of +/- 100, re
FREE
Draw HTF Candle on LTF Candle
Agustinus Biotamalo Lumbantoruan
This indi lets you plot higher time frame candle stick (Japanese Candlestick or Heiken Ashi Candlestick). This indicator could greatly help your trading style either its scalping, day trading or swing trading as it shows you the higher time frame candlesticks activity while you are about to pull a trigger on your trade. The candlesticks will only appear on a time frame that is lower than the higher time frame. It won't draw if the current time frame is equal to or higher than the time frame set
Super Gator
Agustinus Biotamalo Lumbantoruan
This indi shows the following 1. Supertrend 2. Alligator (Not a regular alligator) 3. ZigZag 4. Moving Average 5. Trend Continuation/Mini correction Signal (plotted in X) (See screenshots in green background color 6. Early Signal Detection (See screenshots in green background color) You may treat Alligator as the lagging indicator The leading indicator is the supertrend. The zig zag is based on the leading indicator where it gets plotted when the leading indicator got broken to the opposite.
One Four Four 144
Agustinus Biotamalo Lumbantoruan
This indicator displays support and resistance at fixed levels. The level won't change regardless how many days or minutes has gone by. There are 7 levels start from green ends at gray color. Imagine it like do (green),re,mi,fa,sol,la,si,DO (green) Market often goes one octave from do to DO or fa to FA. You will see this occurring at all markets This indicator can be used to spot your take profit or stop loss target. It can be also used to find support and resistance or supply and demand.
Richter Scale
Agustinus Biotamalo Lumbantoruan
This oscillator helps you to identify sideways movement that allows you to close your current position before you place a new position. It's simple straight and forward. When the indicator is flat, it indicates it's trending. When the indicator is printing at the extreme low (-1)/high(1) back and forth like a Richter scale graph, it indicates the market is in correction (sideway/diagonally). I call this earthquake, this is the opportunity for you to either take partial profit or open positio
Institutions Price Action Indicator
Agustinus Biotamalo Lumbantoruan
This indicators analyze particular candle that determines the trend. It has 2 graphic lines Moving average and dynamic support & resistance line The colored MA is a leading indicator Dynamic & Support resistance is a lagging indicator to confirm or strengthen the leading indicator The candle also draws what institution candle in by default in blue color with green or red outline. Green outline with blue body, indicate a very strong bullish candle Red outline with blue body, indicate a very stron
Institutional Order Block
Agustinus Biotamalo Lumbantoruan
This indicator doesn't repaint & shows several things 1) Order Block 2) Imbalance candle stick (the icon is a vertical rectangle) 3) Swings (zigzag), 3 to be exact (minor, major and external major zigzags). If you know market structure, you should understand internal & external trends. Minor & major are internal trends of external major in this indicator. 4) Supply & Demand (arrow icon) 5) Major supply & demand (purple arrow) 6) Range/Bias lines (only shown in time frame 1hour & lower) 7) Previo
Supreme Institution RSI
Agustinus Biotamalo Lumbantoruan
Supreme Institution RSI helps traders to spot the trend with RSI. The RSI will change color accordingly and it can be set from the input. This indicator could aids your decision making before pulling the trigger. Just see the color and use it to aid your decision making. Any period works, any timeframe works, any instrument works. You could add 2 of them to your chart, one with period 3 (Fast) and another with period 16 (Slow). The default period is 3. If asked for recommendation, I'd recommend
Institutional Ichimoku Kinko Hyo
Agustinus Biotamalo Lumbantoruan
Unlock the full profit potential of your trading strategy with Institutional Ichimoku—an unparalleled indicator that elevates your market analysis to a professional level. Institutional Ichimoku encapsulates the rich essence of the Ichimoku system and transforms it into a dynamic decision-making powerhouse, giving you the edge you need in today's complex trading landscape. Decode Market Trends: Delve deep into the intricacies of market trends with Institutional Ichimoku. This indicator provides
Institutional Fractal
Agustinus Biotamalo Lumbantoruan
Introducing our innovative Fractal Trend Indicator – a powerful tool designed to help you navigate the financial markets with ease. This user-friendly indicator utilizes fractals to provide valuable insights into market trends while allowing you to customize your visual cues for trend identification. Fractal Clarity: Our indicator employs dots to highlight fractal points, clarifying their significance in the market. These dots do not signify the trend themselves but serve as crucial reference p
Institutional Bollinger Band
Agustinus Biotamalo Lumbantoruan
The Bollinger Band Indicator, favored by institutional traders, offers a swift and comprehensive assessment of market conditions. It's an indispensable tool to distinguish between trending and sideways markets. This multifaceted indicator provides insights through three distinct means: Bollinger Bands, candle analysis, zigzag, and external swing. Trend Analysis: Bollinger Band Color: This feature uses green for bullish and red for bearish trends, offering a clear visual distinction. Candle Colo
Institutional Alligator Structure
Agustinus Biotamalo Lumbantoruan
Introducing our advanced indicator, which builds upon the foundation of the renowned William's Alligator indicator—a powerful tool in technical analysis. Our enhanced indicator offers valuable insights into market trends through three distinct methods, empowering traders with comprehensive market analysis. Alligator Indicator Expansion: This innovative indicator harnesses the essence of the Williams Alligator by closely monitoring its three crucial components: the lips, teeth, and jaws. When the
Swing Tunnel Institutional Structure
Agustinus Biotamalo Lumbantoruan
Introducing our dynamic Swing Tunnel indicator, a powerful and straightforward tool designed to simplify market analysis while providing invaluable insights for traders. This versatile indicator relies on the interplay of two moving averages, forming a visual "tunnel" that changes color, offering clear signals for bullish and bearish market conditions. Let's delve into its features: Swing Tunnel Color Change: The heart of this indicator lies in the Swing Tunnel—a visual representation of marke
Golden Death Cross
Agustinus Biotamalo Lumbantoruan
Elevate Your Forex Trading with the "Gold Death Cross" Indicator! Are you ready to take your Forex trading game to the next level and harness the power of time-tested technical analysis techniques? Look no further! The "Gold Death Cross" indicator is here to revolutionize your trading experience and maximize your profit potential. Unlock the Wisdom of Multiple Moving Averages: The "Gold Death Cross" indicator doesn't just stop at one moving average; it brings you the combined insight of four mo
Swing Volume Profile
Agustinus Biotamalo Lumbantoruan
Are you tired of sifting through endless charts and data to make informed trading decisions? Look no further! The Swing Volume Profile is here to revolutionize your trading experience. With its cutting-edge features, this tool provides you with the insights you need to navigate the dynamic world of financial markets with confidence. Feature 1: Volume Profile Measured from Major Swing High to Major Swing Low   Accurate volume analysis is key to making informed trading decisions. The Swing Volume
Anchored VWAP Channel Bands
Agustinus Biotamalo Lumbantoruan
Point and Plot:  The Anchored VWAP with Channel Bands tool is designed for traders of all levels, from beginners to seasoned professionals. Point to the price level you want to anchor to, plot the horizontal line, and watch as this versatile tool transforms your trading approach. User-Friendly Interface : Navigate the tool effortlessly with a user-friendly interface that ensures you never miss a crucial detail. Real-Time Analysis : Make informed decisions in real time with dynamic data that upda
필터:
리뷰 없음
리뷰 답변
버전 1.43 2020.08.28
zodiac heikenashi signal fix
버전 1.42 2020.08.27
Daily live candle fix (it was displayed bad in the backtesting)
버전 1.41 2020.08.27
1. Add Zig-Zag moon phase zodiac
버전 1.33 2020.08.27
File rename
버전 1.32 2020.08.18
1. Daily live candle fixed
버전 1.31 2020.08.18
Daily Japanese Candle Stick Overlay. (It can only be seen in Time Frame 1HR and lower)
Daily Heikenashi Candle Stick OVerlay. (It can only be seen in Time Frame 1HR and lower)
Press 4 to switch between daily Heikenashi or Japanese candle stick.
버전 1.23 2020.08.13
MA can't be selected
Fix to the Zodiac Heikin ashi candle
버전 1.22 2020.08.13
1. MA With Slope
2. Export zodiac candles to .CSV file
3. Heiken Ashi candle
4. Press "2" to switch candle Heiken Ashi or normal candle stick
5. Pres "3" to turn on/off MA slope
버전 1.21 2020.08.12
fixed drawing issues
버전 1.2 2020.08.12
Faster when backtesting every tick mode
Zodiac MA
new input
* MA Horizontal line color
* Apply MA to open, close, (high+low)/2
* zodiac MA period
버전 1.1 2020.08.11
Add inputs
- Color for moon phases
- Color for Signal Line
- Signal Trigger Default is set to 0.712. You could also set to 0.5
- Repaint Signal (True/False)