• 미리보기
  • 리뷰 (3)
  • 코멘트 (41)
  • 새 소식

Currency Strength Meter Pro for MT5

5

Currency Strength Meter is the easiest way to identify strong and weak currencies. This indicator shows the relative strength of 8 major currencies + Gold: AUD, CAD, CHF, EUR, GBP, JPY, NZD, USD, XAU. Gold symbol can be changed to other symbols like XAG, XAU etc.

By default the strength value is normalised to the range from 0 to 100 for RSI algorithm:

  • The value above 60 means strong currency;
  • The value below 40 means weak currency;


This indicator needs the history data of all 28 major currency pairs and 9 timeframe. History data will be downloaded automatically as indicator will be started.


This Currency Strength Meter supports many powerful features:

  • Currency Strength Meter Dashboard (shows strength of currencies for any timeframe with sorting by name or value at one user-friendly dashboard);
  • Currency Strength Meter Graph (shows strength of currencies with graphic lines and labels near to lines or at corner of graph);
    • Candle close time graph lines calculation;
    • Time based graph lines calculation;
  • Graph lines styling for chart symbols and other symbols;
  • Allows to calculate average currency strength from specified timeframes;
  • Searching tradable pairs by several algorithms (allows to find strong and weak currencies and show them at table as tradable pairs, you do not waste your time to do this calculation manually);
  • Powerful notification manager:
    • Notifications by crossing level (levels and timeframe is set by formula);
    • Notifications by crossing lines (timeframe is set by formula);
    • Notifications when new tradable pair is found (tradable pairs are found by formula);
    • Notifications about CSM state;
  • Many algorithms for calculation of strength of currencies (MACD, RSI, CCI, RVI, MFI, Stochastic, DeMarker, Momentum);
  • Powerful tradable pairs search engine by expression;
    • Min difference between strength of strong and weak currencies;
    • Min strength level for strong currency and weak currency;
    • Max difference between strength of strong and weak currencies;
    • Moving averages alignment;
  • Coloring of any object of Currency Strength Meter;
  • History line (allows to get Currency Strength Meter value for particular time in history, it helps to backtest your trading strategy with using Currency Strength Meter);
    • Calculation on candle close time;
    • Calculation on specified time with one minute precision;
  • Moving average smoothing (allowed to smooth result with specific algorithms);
  • Latency (allowed to calculate currency strength with specified interval, thus it takes less time for calculation);
  • Allows to show data only for specified currencies (chart pair, market watch pairs, all currency pairs);
  • User-friendly interface;
  • High resolution screens support (4K);


Relative links:


Communication:

  • Join  Take Profit Channel to get latest news and updates.
  • Join Take Profit Group to discuss products of author.
  • If you want new feature contact me please.


Take profit!


리뷰 3
GoodMorningg
525
GoodMorningg 2022.09.19 21:19 
 

Индикатор - 5 звезд из 5. Поддержка от разработчика - 10 звезд из 5. Спасибо за ваш труд, хорошая поддержка дорогого стоит!

theodorp
97
theodorp 2022.09.08 17:36 
 

Excellent Product Aleksandr.

Multi Disipliner
352
Multi Disipliner 2022.04.20 13:48 
 

The best

추천 제품
Currency Strength Meter is the easiest way to identify strong and weak currencies. This indicator shows the relative strength of 8 major currencies + Gold: AUD, CAD, CHF, EUR, GBP, JPY, NZD, USD, XAU. Gold symbol can be changed to other symbols like XAG, XAU etc. By default the strength value is normalised to the range from 0 to 100 for RSI algorithm: The value above 60 means strong currency; The value below 40 means weak currency; This indicator needs the history data of all 28 major curre
VPO Profile MT5
Kyra Nickaline Watson-gordon
5 (2)
Definition : VPO is a Volume Price Opportunity. Instead of using bars or candles with an Open, High, Low, and Close price, each "bar" in a Market Profile is represented by horizontal bars against the price It is called Market Profile terminology. In other words volume-price-opportunity (VPO) profiles are histograms of how many volumes were traded at each price within the span of the profile. By using a VPO chart, you are able to analyze the amount of trading activity, based on volume, for eac
Inverted Hammer GA
Osama Echchakery
The   Inverted Hammer candlestick pattern   is formed by one single candle. Here’s how to identify the Inverted Hammer candlestick pattern: The candle has a small body The wick at the top must be big compared to the body At the bottom, it should have no wick, or be very small The color of the body doesn’t matter This 1-candle bullish candlestick pattern is a reversal pattern, meaning that it’s used to find bottoms. For this reason, we want to see this pattern after a move to the downside, showi
Pipfinite creates unique, high quality and affordable trading tools. Our tools may or may not work for you, so we strongly suggest to try the Demo Version for MT4 first. Please test the indicator prior to purchasing to determine if it works for you. We want your good reviews, so hurry up and test it for free...we hope you will find it useful. Combo Razor Scalper with Trend Laser Strategy: Scalp in the direction of the trend Watch Video: (Click Here) Features Scalping indicator using a confir
표시기는 현재 시세를 작성하여 과거 시세와 비교할 수 있으며 이를 바탕으로 가격 변동을 예측합니다. 표시기에는 원하는 날짜로 빠르게 이동할 수 있는 텍스트 필드가 있습니다. 옵션: 기호 - 표시기가 표시할 기호 선택. SymbolPeriod - 지표가 데이터를 가져올 기간 선택. IndicatorColor - 표시기 색상. HorisontalShift - 지시자가 그린 따옴표를 지정된 막대 수만큼 이동합니다. Inverse - true는 인용 부호를 반대로, false - 원래 보기를 반전합니다. ChartVerticalShiftStep - 차트를 수직으로 이동합니다(키보드의 위/아래 화살표). 다음은 날짜를 입력할 수 있는 텍스트 필드의 설정으로, '엔터'를 누르면 즉시 이동할 수 있습니다.
이 지표는 하루 중 거래 활동이 가장 많은 시간을 결정하도록 설계되었습니다. 이 계산 후 지표는 가장 중요한 거래 수준을 구축합니다. 이러한 수준을 실제 가격 움직임과 비교하면 시장 추세의 강도와 방향에 대한 정보를 얻을 수 있습니다. 지표의 특징 기간은 D1 미만이어야 합니다. 권장 기간: M15, M30 및 H1. H1 이상의 시간대는 매우 대략적인 그림을 제공할 수 있습니다. 그리고 M15 미만의 기간을 사용하면 짧은 거래 폭증으로 이어질 수 있습니다. 지표는 과거 데이터에 민감합니다. 따라서 차트 창에 최소 50,000개 이상의 막대를 설정하는 것이 좋습니다. 표시기 매개변수 Base - 거래 활동을 계산하기 위한 기준 기간을 설정합니다. day - 거래 활동은 시간을 고려하여 계산됩니다. week – 거래 활동은 시간과 요일을 고려하여 계산됩니다. Width - 선 너비. ClrMean, ClrUp 및 ClrDn은 중간, 상위 및 하위 거래 수준의 색상입니다.
Ultimate Candle Patterns
Wojciech Daniel Knoff
This is a multi-symbol and multi-timeframe table-based indicator designed for a candlestick patterns detection with 46 patterns for META TRADER 5. Each formation has own image for easier recognition. Here you find most popular formations such as "Engulfing", "Hammer", "Three Line Strike", "Piercing" or Doji - like candles. Check my full list of patterns on my screenshots below. Also you can not only switch all bearish or bullish patterns from input, but also select formation for a specified symb
Tick Speed Pro MT5
John Louis Fernando Diamante
Tick Speed Pro povides a charted record of tick speed to allow you to see the ebb and flow of market activity. Observing patterns in tick speed may allow you to better time entries to reduce slippage and re-quotes. The tick speed plot updates it's entire position to show you only the last N seconds you choose, ideal for scalping and HFT approaches. An alert is provided to signal when the instrument is getting ticks at a higher rate than the alert limit. Multiple loadings are supported to compar
IceFX VelocityMeter Mini is a very unique indicator on MetaTrader 4 platform which measures the speed of the Forex market . It is not a normal volume or other measurement indicator because IceFX VelocityMeter Mini is capable to understand market speed movements which are hidden in ticks and those valuable information cannot be read in an ordinary way from the candles. The software monitors the received ticks (frequency, magnitude of change) within a specified time range, analyzes these info and
Currency Strength Meter is the easiest way to identify strong and weak currencies.   The   indicator shows the relative strength of 8 major currencies: AUD, CAD, CHF, EUR, GBP, JPY, NZD, USD. By default the strength value is normalised to the range from 0 to 100 for RSI algorithm: The value above 60 means strong currency; The value below 40 means weak currency; The indicator is created and optimized for using it externally at an Expert Advisors or as a Custom Indicator inside your programs.
Blahtech Market Profile MT5
Blahtech Limited
5 (8)
Was: $249  Now: $99   Market Profile defines a number of day types that can help the trader to determine market behaviour. A key feature is the Value Area, representing the range of price action where 70% of trading took place. Understanding the Value Area can give traders valuable insight into market direction and establish the higher odds trade. It is an excellent addition to any system you may be using. Inspired by Jim Dalton’s book “Mind Over Markets”, this indicator is designed to suit the
PipFinite Energy Beam MT5
Karlo Wilson Vendiola
5 (1)
Pipfinite creates unique, high quality and affordable trading tools. Our tools may or may not work for you, so we strongly suggest to try the Demo Version for MT4 first. Please test the indicator prior to purchasing to determine if it works for you. We want your good reviews, so hurry up and test it for free...we hope you will find it useful. Combo Energy Beam with Swing Control Strategy: Confirm swing pullback signals Watch Video: (Click Here) Energy Beam with Trend Laser Strategy: Confirm Tr
Multi SAR MT5
Vladimir Pokora
5 (1)
This tool monitors Parabolic SAR indicators on all time frames in the selected markets. Displays a table with signals to open a BUY trade (green) or SELL trade (red). You can easily add or delete market names / symbols. If the conditions for opening a trade on multiple time frames are met, you can be notified by e-mail or phone message (according to the settings in MT5 menu Tools - Options…) You can also set the conditions for sending notifications. The list of symbols/ markets you have entered
Multicurrency and multitimeframe modification of the Relative Strength Index (RSI) indicator. You can specify any desired currencies and timeframes in the parameters. Also, the panel can send notifications when crossing overbought and oversold levels. By clicking on a cell with a period, this symbol and period will be opened. This is MTF Scanner. The key to hide the dashboard from the chart is "D" by default. Similar to the Currency Strength Meter, the Dashboard can automatically select pairs c
This indicator allows you to enjoy the two most popular products for analyzing request volumes and market deals at a favorable price: Actual Depth of Market Chart Actual Tick Footprint Volume Chart This product combines the power of both indicators and is provided as a single file. The functionality of Actual COMBO Depth of Market AND Tick Volume Chart is fully identical to the original indicators. You will enjoy the power of these two products combined into the single super-indicator! Below is
VolumeDeltaM1 MT5
Stanislav Korotky
This indicator provides the analysis of tick volume deltas. It monitors up and down ticks and sums them up as separate volumes for buys and sells, as well as their delta volumes. In addition, it displays volumes by price clusters (cells) within a specified period of bars. This indicator is similar to VolumeDeltaMT5 , which uses almost the same algorithms but does not process ticks and therefore cannot work on M1. This is the reason for VolumeDeltaM1 to exist. On the other hand, VolumeDeltaMT5 ca
This indicator provides an original mix of WPR, VSA, and volume delta. It shows ratio of buy/sell volumes scaled on 100% range based on total volume change for a selected period. The convetional VSA (Volume Spread Analysis) studies interconnections of price action and volume change in absolute values, whereas WPR (Williams Percent Range) offers a convenient approach of price moves normalization into the fixed percentage metric: 0 - 100%. Hence overbough and oversold states are easily spotted. N
Volume Profile V6
Andrey Kolesnik
4.5 (2)
Market volume profile indicator.  It works on almost all instruments - currency pairs, stocks, futures, on real volumes and on ticks.  It can be set as automatic determination of the range of building a profile, for example, for a week or a month, etc.  and set the range manually by moving the borders (two vertical lines red and blue).  Shown as a bar graph.  The width of the histogram at a given level means, conventionally, the number of trades made on it.  With the "Mode level line color" para
Mega Indicator MT5
Szymon Palczynski
Price reach indicator. It also serves as the perfect term for supports and resistance. I use it in two experts. The basic tool for professional trading. The indicator analyzes the last 500 bar and uses this to determine the levels ( but it doesn't predict the future ) . Personally, I use it on TF H1.  It is very simple. Four lines on chart and that's all. Only two input parameters.  Thousands of indicators. Why this? Is good ? No! Is very good. Please test the indicator prior to purchasing. You
Blahtech Supply Demand MT5
Blahtech Limited
4.57 (14)
Was: $299  Now: $99   Supply Demand uses previous price action to identify potential imbalances between buyers and sellers. The key is to identify the better odds zones, not just the untouched ones. Blahtech Supply Demand indicator delivers functionality previously unavailable on any trading platform. This 4-in-1 indicator not only highlights the higher probability zones using a multi-criteria strength engine, but also combines it with multi-timeframe trend analysis, previously confirmed swings
HAWA GOLD MT5 Advanced trading indicator with realistic pre-defined entry and exit levels with almost 80% win rate.  The system focuses only  Small and Steady Profits . It uses fixed stop loss for every signal to keep money management in place.  As compare to other available indicators in market, HAWA gold has unique feature of displaying total profit and loss in terms of points where 1PIP=10points and Minimum profit is 10 pips. Its smart and advanced algorithm detects trend and trend strengt
Perfect Sniper
Ignacio Agustin Mene Franco
Perfect Sniper! is a triple indicator with support resistance detection, downtrend channel, uptrend channel Bands included! where he hunts the rebounds in the red lines for sale, in the green lines mark purchase, in the lower bands that are the breaks gives another second entry either buy or sell, perfect to take advantage of the double entrance, It is used in any temporality, It is used to scalp and long on h1 or h4 to D1. It works for Forex markets, All pairs. It is used for the synthetic inde
Paladin
Tatiana Savkevych
Paladin is a fundamental technical indicator specially designed for Forex traders. It is based on a unique algorithm that forecasts future prices by analyzing historical quote data over a specific user-defined time period set in the indicator's settings. This indicator provides traders with valuable information about potential changes in price direction. Using a special formula at its core, Paladin accurately calculates signals. It effectively identifies reversal points or sharp price movemen
Magic Channel Scalper 는 MetaTrader 5 터미널의 채널 표시기입니다. 이 지표를 사용하면 가장 가능성이 높은 추세 반전 지점을 찾을 수 있습니다. 대부분의 채널 표시기와 달리 Magic Channel Scalper는 다시 그려지지 않습니다. 경고 시스템(경고, 이메일 및 푸시 알림)은 여러 거래 상품을 동시에 모니터링하는 데 도움이 됩니다. 차트에 표시기를 연결하면 신호가 나타나면 경고가 트리거됩니다. 우리의 경고 시스템을 사용하면 단 한 번의 포지션 개시 신호도 놓치지 않을 것입니다! 장점 스캘핑에 딱 맞습니다. 추세 반전을 식별하는 데 탁월합니다. 초보자와 숙련된 거래자에게 적합합니다. 모든 시간대에 작동합니다. 표시기가 다시 그려지지 않습니다. 유연한 경고 시스템. 차트 사용자 정의(선의 크기 및 색상) 권장 기호 USDCAD, EURUSD, USDCHF, AUDNZD, AUDCAD, GOLD. 사용에 대한 권장 사항
Volume by Price MT5
Brian Collard
5 (3)
The Volume by Price Indicator for MetaTrader 5 features Volume Profile and Market Profile TPO (Time Price Opportunity). Get valuable insights out of currencies, equities and commodities data. Gain an edge trading financial markets. Volume and TPO histogram bar and line charts. Volume Footprint charts. TPO letter and block marker charts including split structures. Versatile segmentation and compositing methods. Static, dynamic and flexible ranges with relative and/or absolute visualizations. Lay
The   Pairs Spread indicator   has been developed for the popular strategy known as pairs trading, spread trading, or statistical arbitrage. This indicator measures the distance (spread) between prices of two directly (positively) correlated instruments and shows the result as a curve with standard deviations. So, traders can quickly identify when the instruments are too far apart and use this information for trade opportunities.  How to use the Pairs Spread indicator Best results are attaine
PipFinite Binary Options PRO MT5
Karlo Wilson Vendiola
4.65 (17)
This LEGIT Indicator Can Accurately Predict the Outcome of One Bar. Imagine adding more filters to further increase your probability! Unlike other products, Binary Options PRO can analyze past signals giving you the statistical edge. How Increase Your Probability Information revealed here www.mql5.com/en/blogs/post/727038 NOTE: The selection of a Good Broker is important for the overall success in trading Binary Options. Benefits You Get Unique algorithm that anticipates price weaknes
Introducing "X Marks the Spot" – Your Ultimate MetaTrader 5 Indicator for Perfect Trades! Are you tired of the guesswork in trading? Ready to take your MetaTrader 5 experience to a whole new level? Look no further – "X Marks the Spot" is here to revolutionize your trading strategy! What is "X Marks the Spot"? "X Marks the Spot" is not just another indicator – it's your personal trading compass that works seamlessly on all timeframes . Whether you're a beginner or an experienced trader,
이 표시기는 필터링된 가격 정보를 표시합니다. 세 가지 색상의 히스토그램과 하나의 공통 색상 선의 형태입니다. 이것은 매우 화려하고 아름다운 지표입니다. 가격 움직임의 강도와 방향을 결정하는 데 좋습니다. 이 표시기에는 매우 간단한 설정이 있습니다. 1) 지표 계산을 위한 세 가지 옵션 중 선택: - 원래의, - 디마커, - 균형 볼륨. 2) 5개의 다른 기간 선택. 3) 표시된 색상 선택. 4) 정확도 선택. ////////////////////////////////////////////////// ////////////////////////////////////////////////// 이 지표가 성공적인 거래에 매우 유용하기를 바랍니다. 행운을 빌어요.
BoxChart MT5
Evgeny Shevtsov
5 (7)
The market is unfair if only because 10% of participants manage 90% of funds. An ordinary trader has slim changes to stand against these "vultures". This problem can be solved. You just need to be among these 10%, learn to predict their intentions and move with them. Volume is the only preemptive factor that faultlessly works on any timeframe and symbol. First, the volume appears and is accumulated, and only then the price moves. The price moves from one volume to another. Areas of volume accumu
이 제품의 구매자들이 또한 구매함
Atomic Analyst MT5
Issam Kassas
4.22 (9)
우선적으로 언급할 점은이 거래 지표가 다시 그리지 않고 지연되지 않으며 이를 통해 수동 및 로봇 거래 모두에 이상적이라는 점입니다. Atomic Analyst는 가격의 강도와 모멘텀을 활용하여 시장에서 더 나은 이점을 찾는 PA Price Action Indicator입니다. 고급 필터를 장착하여 잡음과 거짓 신호를 제거하고 거래 잠재력을 높이는 데 도움이 됩니다. 복잡한 지표의 다중 레이어를 사용하여 Atomic Analyst는 차트를 스캔하고 복잡한 수학적 계산을 간단한 신호와 색상으로 변환하여 초보 트레이더가 이해하고 일관된 거래 결정을 내릴 수 있도록합니다. "Atomic Analyst"는 새로운 및 경험이 풍부한 트레이더를위한 종합적인 거래 솔루션입니다. 프리미엄 지표와 최고 수준의 기능을 하나의 거래 전략에 결합하여 모든 종류의 트레이더에 대한 다재다능한 선택지가되었습니다. 인트라데이 거래 및 스캘핑 전략 : 빠르고 정확한 일일 거래 및 단기 거래를 위해 설계
우선 이 거래 시스템이 리페인팅, 리드로잉 및 레이그 인디케이터가 아니라는 점을 강조하는 것이 중요합니다. 이는 수동 및 로봇 거래 모두에 이상적인 것으로 만듭니다. "스마트 트렌드 트레이딩 시스템 MT5"은 새로운 및 경험이 풍부한 트레이더를 위해 맞춤형으로 제작된 종합적인 거래 솔루션입니다. 10개 이상의 프리미엄 인디케이터를 결합하고 7개 이상의 견고한 거래 전략을 특징으로 하여 다양한 시장 조건에 대한 다목적 선택이 가능합니다. 트렌드 추종 전략: 효과적인 트렌드 추이를 타기 위한 정확한 진입 및 손절 관리를 제공합니다. 반전 전략: 잠재적인 트렌드 반전을 식별하여 트레이더가 범위 시장을 활용할 수 있게 합니다. 스캘핑 전략: 빠르고 정확한 데이 트레이딩 및 단기 거래를 위해 설계되었습니다. 안정성: 모든 인디케이터가 리페인팅, 리드로잉 및 레이그가 아니므로 신뢰할 수 있는 신호를 보장합니다. 맞춤화: 개별 거래 선호도를 고려한 맞춤형 전략을 지원합니다. 최상의 전략을 찾는
Quantum Trend Sniper
Bogdan Ion Puscasu
5 (36)
소개       Quantum Trend Sniper Indicator는   추세 반전을 식별하고 거래하는 방식을 변화시키는 획기적인 MQL5 지표입니다! 13년 이상의 거래 경험을 가진 숙련된 트레이더 팀이 개발한       Quantum Trend Sniper 표시기       매우 높은 정확도로 추세 반전을 식별하는 혁신적인 방법으로 거래 여정을 새로운 차원으로 끌어올리도록 설계되었습니다. ***Quantum Trend Sniper Indicator를 구입하면 Quantum Breakout Indicator를 무료로 받을 수 있습니다!*** Quantum Trend Sniper Indicator는 추세 반전을 식별하고 세 가지 이익실현 수준을 제안할 때 경고, 신호 화살표를 제공합니다. 초보자 거래자와 전문 거래자 모두에게 적합합니다. Quantum EA 채널:       여기를 클릭하세요 MT4 버전:       여기를 클릭하세요
Advanced Supply Demand MT5
Bernhard Schweigert
4.53 (15)
현재 33% 할인! 초보자나 전문 트레이더를 위한 최고의 솔루션! 이 보조지표는 우리가 다수의 독창적 기능과 새로운 공식을 통합한 독특하고 고품질이며 저렴한 거래 도구입니다. 이 업데이트를 통해 이중 시간대를 표시할 수 있습니다. 더 높은 TF를 표시할 수 있을 뿐만 아니라 차트 TF와 더 높은 TF 모두를 표시할 수 있습니다: 중첩 영역 표시. 모든 Supply Demand 트레이더들이 좋아할 것입니다. :) 중요한 정보 공개 Advanced Supply Demand의 잠재력을 극대화하려면 다음을 방문하십시오. https://www.mql5.com/ko/blogs/post/720245   진입 또는 목표의 명확한 트리거 포인트를 정확히 찾아냄으로 해서 거래가 어떻게 개선될지 상상해 보십시오. 새로운 알고리즘을 기반으로 매수자와 매도자 간의 잠재적인 불균형을 훨씬 더 쉽게 분간할 수 있습니다. 왜냐하면 가장 강한 공급영역과 가장 강한 수요 영역과 과거에 어떻게 진행 되었는지를(이
RelicusRoad Pro MT5
Relicus LLC
4.81 (21)
이제 $ 147 (몇 가지 업데이트 후 $ 499 증가) - 무제한 계정 (PCS 또는 MACS) RelicusRoad 사용 설명서 + 교육 비디오 + 비공개 Discord 그룹 액세스 + VIP 상태 시장을 보는 새로운 방법 RelicusRoad는 외환, 선물, 암호화폐, 주식 및 지수에 대한 세계에서 가장 강력한 거래 지표로서 거래자에게 수익성을 유지하는 데 필요한 모든 정보와 도구를 제공합니다. 우리는 초보자부터 고급까지 모든 거래자가 성공할 수 있도록 기술적 분석 및 거래 계획을 제공합니다. 미래 시장을 예측할 수 있는 충분한 정보를 제공하는 핵심 거래 지표입니다. 우리는 차트에서 말이 안 되는 여러 지표 대신 완전한 솔루션을 믿습니다. 타의 추종을 불허하는 매우 정확한 신호, 화살표 + 가격 조치 정보를 표시하는 올인원 표시기입니다. 강력한 AI를 기반으로 하는 RelicusRoad는 누락된 정보와 도구를 제공하여 교육하고 성공적인 트레이더인 트레이딩 전문
소개       Quantum Breakout PRO   , 브레이크아웃 존 거래 방식을 변화시키는 획기적인 MQL5 지표! 13년 이상의 거래 경험을 가진 숙련된 트레이더 팀이 개발한       퀀텀 브레이크아웃 PRO       혁신적이고 역동적인 브레이크아웃 존 전략으로 거래 여정을 새로운 차원으로 끌어올리도록 설계되었습니다. Quantum Breakout Indicator는 5개의 이익 목표 영역이 있는 브레이크아웃 영역의 신호 화살표와 브레이크아웃 상자를 기반으로 한 손절 제안을 제공합니다. 초보자 거래자와 전문 거래자 모두에게 적합합니다. Quantum EA 채널:       여기를 클릭하세요 중요한! 구매 후 설치 매뉴얼을 받으려면 개인 메시지를 보내주십시오. 추천: 기간: M15 통화쌍: GBPJPY, EURJPY, USDJPY,NZDUSD, XAUUSD 계정 유형: 스프레드가 매우 낮은 ECN, Raw 또는 Razor 브로커 시간: GM
FX Power MT5 NG
Daniel Stein
5 (4)
모닝 브리핑 여기 mql5 와 텔레그램에서 FX Power MT5 NG 는 오랫동안 인기 있는 통화 강도 측정기인 FX Power의 차세대 버전입니다. 이 차세대 강도 측정기는 무엇을 제공합니까? 기존 FX Power에서 좋아했던 모든 것 PLUS GOLD/XAU 강도 분석 더욱 정밀한 계산 결과 개별 구성 가능한 분석 기간 더 나은 성능을 위한 사용자 정의 가능한 계산 한도 특별 멀티더 많은 것을보고 싶은 사람들을위한 특별한 다중 인스턴스 설정 모든 차트에서 좋아하는 색상을위한 끝없는 그래픽 설정 수많은 알림 옵션, 중요한 것을 다시는 놓치지 않도록 Windows 11 및 macOS 스타일의 둥근 모서리가 있는 새로운 디자인 마법처럼 움직이는 인디케이터 패널 FX 파워 키 특징 모든 주요 통화의 완전한 강세 이력 모든 시간대에 걸친 통화 강세 이력 모든 브로커 및 차트에서 고유 계산 결과 100% 신뢰할 수있는 실시간100 % 신뢰할 수있는 실시간 계산-> 다시 칠하지 않음
FX Volume MT5
Daniel Stein
4.94 (17)
모닝 브리핑을 통해 세부 정보와 스크린샷으로 매일 시장 업데이트를 받으세요 여기 mql5 및 텔레그램에서 FX 거래량은 브로커의 관점에서 시장 심리에 대한 실제 통찰력을 제공하는 최초이자 유일한 거래량 지표입니다. 브로커와 같은 기관 시장 참여자가 외환 시장에서 어떤 포지션을 취하고 있는지에 대한 훌륭한 통찰력을 COT 보고서보다 훨씬 빠르게 제공합니다. 차트에서 이 정보를 직접 확인하는 것은 트레이딩의 진정한 판도를 바꾸고 획기적인 솔루션입니다. 다음과 같은 고유한 시장 데이터 인사이트의 이점 비율 는 통화의 매수/매도 포지션 비율을 백분율로 표시 비율 변화 는 선택한 기간 내 매수 비율과 비율 변화를 표시 총 거래량 는 해당 통화의 총 거래량(롱 및 숏)을 로트 단위로 보여줍니다 Volumes Long 는 해당 통화의 모든 롱 포지션의 거래량을 보여줍니다 Volumes Short 는 해당 통화의 모든 숏 포지션의 거래량을 보여줍니다 Net Long 는 순 롱 포지션의 거래량
Entry Points Pro for MT5
Yury Orlov
4.54 (157)
다시 색을 칠하지 않고 거래에 진입할 수 있는 정확한 신호를 제공하는 MT5용 지표입니다. 외환, 암호화폐, 금속, 주식, 지수 등 모든 금융 자산에 적용할 수 있습니다. 매우 정확한 추정값을 제공하고 매수와 매도의 가장 좋은 시점을 알려줍니다. 하나의 시그널로 수익을 내는 지표의 예와 함께 비디오 (6:22)시청하십시오! 대부분의 거래자는 Entry Points Pro 지표의 도움으로 첫 거래 주 동안 트레이딩 결과를 개선합니다. 저희의   Telegram Group 을 구독하세요! Entry Points Pro 지표의 좋은점. 재도색이 없는 진입 신호 신호가 나타나고 확인되면(시그널 캔들이 완성된 경우) 신호는 더 이상 사라지지 않습니다. 여타 보조지표의 경우 신호를 표시한 다음 제거되기 때문에 큰 재정적 손실로 이어집니다. 오류 없는 거래 게시 알고리즘을 통해 트레이드(진입 또는 청산)를 할 이상적인 순간을 찾을 수 있으며, 이를 통해 이를 사용하는 모든 거래자의
TPSproTREND PrO MT5
Roman Podpora
5 (5)
TPSpro TRENDPRO  - is a trend indicator that automatically analyzes the market and provides information about the trend and each of its changes, as well as giving signals for entering trades without redrawing! The indicator uses each candle, analyzing them separately. referring to different impulses - up or down impulse. Exact entry points into transactions for currencies, crypto, metals, stocks, indices!  -  Version MT4                  DETAILED DESCRIPTION        /       TRADING SETUPS       
Bill Williams Advanced
Siarhei Vashchylka
5 (3)
Bill Williams Advanced is designed for automatic chart analysis using Bill Williams' "Profitunity" system. The indicator analyzes four timeframes at once. Manual (Be sure to read before purchasing) Advantages 1. Automatically analyzes the chart using the "Profitunity" system of Bill Williams. The found signals are placed in a table in the corner of the screen. 2. Equipped with a trend filter based on the Alligator indicator. Most of the system signals are recommended to be used only accordi
TrendMaestro5
Stefano Frisetti
note: this indicator is for METATRADER4, if you want the version for METATRADER5 this is the link:  https://www.mql5.com/it/market/product/108106 TRENDMAESTRO recognizes a new TREND in the bud, he never makes mistakes. The certainty of identifying a new TREND is priceless. DESCRIPTION TRENDMAESTRO identifies a new TREND in the bud, this indicator examines the volatility, volumes and momentum to identify the moment in which there is an explosion of one or more of these data and therefore the mome
XQ Indicator MetaTrader 5
Marzena Maria Szmit
5 (1)
Step into the realm of Forex trading with confidence and precision using XQ, a cutting-edge Forex indicator designed to elevate your trading game to unprecedented heights. Whether you're a seasoned trader or just stepping into the world of currency exchange, XQ Forex Indicator empowers you with the insights and signals needed to make informed trading decisions. The signal conditions are a combination of three indicators, and XQ Forex Indicator only display  medium and long-term trends . The ind
Quantum Heiken Ashi PRO MT5
Bogdan Ion Puscasu
4.5 (8)
시장 동향에 대한 명확한 통찰력을 제공하도록 설계된 Heiken Ashi 양초는 노이즈를 필터링하고 잘못된 신호를 제거하는 기능으로 유명합니다. 혼란스러운 가격 변동에 작별을 고하고 더 매끄럽고 신뢰할 수 있는 차트 표현을 만나보세요. Quantum Heiken Ashi PRO를 정말 독특하게 만드는 것은 전통적인 촛대 데이터를 읽기 쉬운 색상 막대로 변환하는 혁신적인 공식입니다. 빨간색과 녹색 막대는 각각 약세와 강세 추세를 우아하게 강조하여 잠재적 진입점과 퇴장점을 매우 정확하게 파악할 수 있습니다. Quantum EA 채널:       여기를 클릭하세요 MT4 버전:       여기를 클릭하세요 이 놀라운 지표는 다음과 같은 몇 가지 주요 이점을 제공합니다. 선명도 향상: Heiken Ashi 바는 가격 변동을 완화하여 시장 추세를 보다 명확하게 나타내므로 유리한 거래 기회를 쉽게 식별할 수 있습니다. 소음 감소: 종종 잘못된 신호로 이어지는 불규칙한 가격 변동
TPSpro RFI Levels MT5
Roman Podpora
5 (5)
A key element in trading is zones or levels from which decisions to buy or sell a trading instrument are made. Despite attempts by major players to conceal their presence in the market, they inevitably leave traces. Our task was to learn how to identify these traces and interpret them correctly. Reversal First Impulse levels (RFI)   -  Version MT4                  INSTRUCTIONS                 RUS                 ENG                         R ecommended to use with an indicator   -  TREND PRO  
Golden Gate Algo MT5
James David Lane
4 (6)
크리스마스 40% 할인! 1월 1일에 가격이 $250로 인상됩니다! GoldenGate Entries를 소개합니다: 혁신적인 트레이딩 솔루션! GoldenGate Entries (GGE)를 사용하여 거래하는 혁신적인 방법을 발견하세요. GGE는 귀하의 거래 경험을 향상시키기 위해 디자인된 고급 지표로, 사용자에게 정확성과 자신감을 부여하는 포괄적인 기능을 제공합니다. 페어: 아무거나 (FX - 상품 - 주식 - 주식 - 암호화폐) 타임프레임: 15분에서 H1까지 주요 기능: 매수 및 매도 화살표 표시: 팝업 알림과 함께 매수 및 매도 화살표 표시를 받아 언제나 정보를 확인할 수 있습니다. GoldenGate_Algo: 시장 상황에 대한 통찰력을 얻으려면 GoldenGate_Algo를 사용하세요. 시장이 '과매도'인지 '과매수'인지 평가하는 강력한 도구입니다. 현재 트렌드 분석: 현재 보고 있는 타임프레임에서 현재 트렌드에 액세스하여 거래를 주류 시장 방
Gartley Hunter Multi
Siarhei Vashchylka
5 (5)
Gartley Hunter Multi - An indicator for searching for harmonic patterns simultaneously on dozens of trading instruments and on all classic timeframes: (m1, m5, m15, m30, H1, H4, D1, Wk, Mn). Manual (Be sure to read before purchasing) | Version for MT4 Advantages 1. Patterns: Gartley, Butterfly, Shark, Crab. Bat, Alternate Bat, Deep Crab, Cypher 2. Simultaneous search for patterns on dozens of trading instruments and on all classic timeframes 3. Search for patterns of all possible sizes. Fr
PZ Swing Trading MT5
PZ TRADING SLU
5 (4)
Swing Trading is the first indicator designed to detect swings in the direction of the trend and possible reversal swings. It uses the baseline swing trading approach, widely described in trading literature. The indicator studies several price and time vectors to track the aggregate trend direction and detects situations in which the market is oversold or overbought and ready to correct. [ Installation Guide | Update Guide | Troubleshooting | FAQ | All Products ] Profit for market swings with
우선적으로 이 거래 시스템은 다시 그리지 않고, 다시 그리지 않으며, 지연되지 않는 것을 강조할 가치가 있습니다. 이는 전문적인 거래에 이상적입니다. "스마트 서포트 앤 레지스턴스 트레이딩 시스템"은 새로운 및 경험 많은 트레이더를 위해 개발된 고급 지표입니다. 이 시스템은 외환 시장에서 정밀도와 신뢰감을 제공합니다. 이 포괄적인 시스템은 일일 거래 전략, 스윙 거래 전략, 지원 및 저항 전략, 캔들스틱 패턴 전략, VWAP 전략, 다중 시간대 추세 전략 등을 포함한 7개 이상의 전략, 10개의 지표 및 다양한 거래 방식을 결합합니다. 이 시스템은 화살표 신호, 진입 및 출구 지점, 거래 경보, 높은 시간대 추세 분석, 실시간 거래 모니터링 및 트렌드 및 볼륨 캔들 색상 제공합니다. 자동 지원 및 저항 감지로 다양한 시장 상황에서 신중한 결정을 돕는 다면적 인 지표입니다. 스마트 서포트 앤 레지스턴스 트레이딩 시스템은 프리미엄 및 강력한 지표 및 도구 모음을 통합한 견고한
Owl Smart Levels MT5
Sergey Ermolov
4.47 (36)
MT4 버전  |  FAQ Owl Smart Levels Indicator 는 Bill Williams 의 고급 프랙탈, 시장의 올바른 파동 구조를 구축하는 Valable ZigZag, 정확한 진입 수준을 표시하는 피보나치 수준과 같은 인기 있는 시장 분석 도구를 포함하는 하나의 지표 내에서 완전한 거래 시스템입니다. 시장과 이익을 취하는 장소로. 전략에 대한 자세한 설명 표시기 작업에 대한 지침 고문-거래 올빼미 도우미의 조수 개인 사용자 채팅 ->구입 후 나에게 쓰기,나는 개인 채팅에 당신을 추가하고 거기에 모든 보너스를 다운로드 할 수 있습니다 힘은 단순함에 있습니다! Owl Smart Levels 거래 시스템은 사용하기 매우 쉽기 때문에 전문가와 이제 막 시장을 연구하고 스스로 거래 전략을 선택하기 시작한 사람들 모두에게 적합합니다. 전략 및 지표에는 눈에 보이지 않는 비밀 공식 및 계산 방법이 없으며 모든 전략 지표는 공개되어 있습니다. Owl Smart Levels를
Professional Scalping Tool on Deriv Attention! The indicator will be sold in limited quantities!!! Description: This trading indicator is designed for professional traders focused on scalping. Designed with the market in mind, it provides highly accurate spike trading signals. It works on the M1 timeframe and supports the following symbols: Boom 300 Index, Boom 500 Index, Boom 1000 Index, Crash 300 Index, Crash 500 Index, Crash 1000 Index. Functional Features: - Direction: - Trading is ca
Trend Forecaster
Alexey Minkov
5 (3)
The Trend Forecaster indicator utilizes a unique proprietary algorithm to determine entry points for a breakout trading strategy. The indicator identifies price clusters, analyzes price movement near levels, and provides a signal when the price breaks through a level. The Trend Forecaster indicator is suitable for all financial assets, including currencies (Forex), metals, stocks, indices, and cryptocurrencies. You can also adjust the indicator to work on any time frames, although it is recommen
TPA True Price Action indicator reveals the true price action of the market makers through 100% non-repainting signals strictly at the close of a candle! TPA shows entries and re-entries, every time the bulls are definitely stronger than the bears and vice versa. Not to confuse with red/green candles. The shift of power gets confirmed at the earliest stage and is ONE exit strategy of several. There are available now two free parts of the TPA User Guide for our customers. The first "The Basics"
Boom and Crash Spike Detector v1.0 Boom and Crash spike detector prints Down non repaint Arrow for catching crash spikes and Up non repaint arrow for catching boom spikes.  It is suitable for 1M time frame for majorly crash500 and Boom 500.  When the Red arrow prints in a red zone moving averages, it indicates high probability of crash spikes downwards, likewise, blue arrow printing in a blue zone of moving average, it indicates high probability of boom spikes.  Its pretty straight forward since
Consolidation Finder   An indicator that allows you to find consolidation. To work on the breakdown of the channel. Easy to use, there are only three settings: Minimum number of bars to analyze Tunnel Consolidation Indicator color It works on  all timeframes  , by default, approximate settings for the H1 timeframe are set. Works on all currency pairs. The indicator is not redrawn or recalculated. All screenshots are real!
Quantum Currency Heatmap Indicator for MT5
QUANTUM TRADING SOFTWARE LIMITED
Trading the currency markets is a complex business, not least since we are dealing with pairs of currencies, and by inference, pairs of economies. All economies around the world are interlinked, and reflected in the constant ebb and flow of currency strength and weakness. The problem for us as traders is monitoring so many pairs simultaneously, since every pair does not move independently, but reflects the interrelated nature of this market. The Quantum Currency Heatmap delivers the informatio
Advanced Currency Strength28 MT5
Bernhard Schweigert
5 (1)
초보자 또는 전문가 트레이더를 위한 최고의 솔루션! 이 지표는 우리가 독점 기능과 새로운 공식을 통합했기 때문에 독특하고 고품질이며 저렴한 거래 도구입니다. 단 하나의 차트로 28 Forex 쌍의 통화 강도를 읽을 수 있습니다! 새로운 추세 또는 스캘핑 기회의 정확한 트리거 포인트를 정확히 찾아낼 수 있기 때문에 거래가 어떻게 개선될지 상상해 보십시오. 사용 설명서: 여기를 클릭  https://www.mql5.com/en/blogs/post/697384 그것이 첫 번째, 원본입니다! 쓸모없는 지망생 클론을 사지 마십시오. 더 스페셜  강력한 통화 모멘텀을 보여주는 하위 창의 화살표 GAP가 거래를 안내합니다! 기본 또는 호가 통화가 과매도/과매도 영역(외부 시장 피보나치 수준)에 있을 때 개별 차트의 기본 창에 경고 표시가 나타납니다. 통화 강도가 외부 범위에서 떨어질 때 풀백/반전 경고. 교차 패턴의 특별 경고 추세를 빠르게 볼 수 있는 다중 시간 프레임 선택
Gartley Hunter MT5
Siarhei Vashchylka
5 (13)
Gartley Hunter - An indicator for searching for harmonic patterns (Gartley patterns) and their projections. The indicator is equipped with a system of alerts and push notifications. Manual (Be sure to read before purchasing) | Version for MT4 Advantages 1. 12 harmonic patterns: 7 classical and 5 exotic. New patterns will be added as the indicator develops. 2. Constant automatic search for harmonic patterns. The indicator is capable of finding from the smallest to the largest patterns. 3. Autom
TSO Total Top Bottom Divergence MT5
Dionisis Nikolopoulos
1 (1)
A must-have tool for any strategy based on divergence detection. 10 different oscillators can be used to detect divergences and can be combined with Double Top/Bottom patterns to confirm reversal signals. SCANNER is included . Now with Scanner you can find trading opportunities and setups easily and faster. Features Easily detect strong reversal signals. 10 different oscillators are available for divergence detection. Divergence & Top/Bottom detection can operate independently or combined. Get
IVISTscalp5
Vadym Zhukovskyi
5 (3)
당신에게 소개하는 iVISTscalp5 지표는 독특하면서도 거래 작업에서 효과적입니다. 이 지표는 시간 데이터를 기반으로 하며 금융 시장의 많은 경험과 깊은 분석의 결과입니다. iVISTscalp5 지표는 수동 거래에 뛰어난 도구입니다. 편리성, 간단함 및 시각화 - 모든 복잡성은 숨겨져 있습니다. 우리는 iVISTscalp5 지표의 설정과 사용을 최대한 단순화했습니다. 이 지표는 MT5 터미널에서 가지고 있는 모든 금융 상품에 적합합니다. 시간 기준으로 작동하는 시간은 4am에서 8pm (UTC+3)입니다. iVISTscalp5 지표 메뉴 (스크린샷 1 참조): History - 표시할 주간 수 계산 dT_min - 시간 설정 간격 선택 (분) TFline - 수평 볼륨 생성 (타임프레임) BARSline - 수평 볼륨 생성 (바 수) TFtrend1 - 매일 채널 생성 (타임프레임) BARStrend1 - 매일 채널 생성 (바 수) TFtrend2 - 주간 채널 생성 (타임프레임
제작자의 제품 더 보기
Currency Strength Meter is the easiest way to identify strong and weak currencies. This indicator shows the relative strength of 8 major currencies + Gold: AUD, CAD, CHF, EUR, GBP, JPY, NZD, USD, XAU. Gold symbol can be changed to other symbols like XAG, XAU etc. By default the strength value is normalised to the range from 0 to 100 for RSI algorithm: The value above 60 means strong currency; The value below 40 means weak currency; This indicator needs the history data of all 28 major curre
Currency Strength Meter Pro for MT4
ALEKSANDR SHUKALOVICH
4.3 (10)
Currency Strength Meter is the easiest way to identify strong and weak currencies. This indicator shows the relative strength of 8 major currencies + Gold: AUD, CAD, CHF, EUR, GBP, JPY, NZD, USD, XAU. Gold symbol can be changed to other symbols like XAG, XAU etc. By default the strength value is normalised to the range from 0 to 100 for RSI algorithm: The value above 60 means strong currency; The value below 40 means weak currency; This indicator needs the data of all 28 major currency pair
Currency Strength Meter is the easiest way to identify strong and weak currencies. This indicator shows the relative strength of 8 major currencies + Gold: AUD, CAD, CHF, EUR, GBP, JPY, NZD, USD, XAU. Gold symbol can be changed to other symbols like XAG, XAU etc. By default the strength value is normalised to the range from 0 to 100 for RSI algorithm: The value above 60 means strong currency; The value below 40 means weak currency; This indicator needs the data of all 28 major currency pair
Currency Strength Meter is the easiest way to identify strong and weak currencies. This indicator shows the relative strength of 8 major currencies + Gold: AUD, CAD, CHF, EUR, GBP, JPY, NZD, USD, XAU. Gold symbol can be changed to other symbols like XAG, XAU etc. By default the strength value is normalised to the range from 0 to 100 for RSI algorithm: The value above 60 means strong currency; The value below 40 means weak currency; This indicator needs the data of all 28 major currency pair
Trend Power for MT4
ALEKSANDR SHUKALOVICH
4.67 (3)
Trend Power Indicator is an indicator which helps to identify trend direction and its power by using moving averages ZigZag pattern and correlations of tradable instruments. It provides trend power data with user-friendly interface which can be read easily and fast.   This indicator by default is configured for trading of   Adam Khoo's   ( Piranhaprofit ) strategies. It saves mass of time for searching of tradable pairs by his strategies. It indicates when all required moving averages are align
News Scalping Executor Pro is an utility which helps to trade high impact and huge volatility   news . This utility helps to create two opposite orders with risk management and profit protection. It moves automatically stop loss level to avoid losses as much as possible by using many different algorithms. It helps to avoid trading the news if spread suddenly becomes very huge. It can lock profit by moving stop loss or partially closing of orders. To be profitable with this type of trading y
News Scalping Executor Pro is an advisor which helps to trade news with high impact and huge volatility. This advisor helps to create two opposite orders with risk management and profit protection. It moves automatically stop loss level to avoid losses as much as possible by using many different algorithms. It helps to avoid trading the news if spread suddenly becomes very huge. It can lock profit by moving stop loss or partially closing of orders. To be profitable with this type of trading
FREE
News Scalping Executor is an advisor which helps to trade news with high impact and huge volatility. This advisor helps to create two opposite orders with risk management. It moves automatically stop loss level to avoid losses as much as possible by using many different algorithms. It helps to avoid trading the news if spread suddenly becomes very huge. To be profitable with this type of trading you should choose the most volatile types of news such as: GDP, CPI, Unemployment Claims, Intere
FREE
News Scalping Executor Pro is an utility which helps to trade high impact and huge volatility   news . This utility helps to create two opposite orders with risk management and profit protection. It moves automatically stop loss level to avoid losses as much as possible by using many different algorithms. It helps to avoid trading the news if spread suddenly becomes very huge. It can lock profit by moving stop loss or partially closing of orders. To be profitable with this type of trading yo
FREE
News Scalping Executor is an utility which helps to trade high impact and huge volatility   news . This utility helps to create two opposite orders with risk management and profit protection. It moves automatically stop loss level to avoid losses as much as possible by using many different algorithms. It helps to avoid trading the news if spread suddenly becomes very huge. It can lock profit by moving stop loss or partially closing of orders. To be profitable with this type of trading you sh
FREE
News Scalping Executor is an advisor which helps to trade news with high impact and huge volatility. This advisor helps to create two opposite orders with risk management. It moves automatically stop loss level to avoid losses as much as possible by using many different algorithms. It helps to avoid trading the news if spread suddenly becomes very huge. To be profitable with this type of trading you should choose the most volatile types of news such as: GDP, CPI, Unemployment Claims, Intere
News Scalping Executor Pro is an advisor which helps to trade news with high impact and huge volatility. This advisor helps to create two opposite orders with risk management and profit protection. It moves automatically stop loss level to avoid losses as much as possible by using many different algorithms. It helps to avoid trading the news if spread suddenly becomes very huge. It can lock profit by moving stop loss or partially closing of orders. To be profitable with this type of trading
Currency Strength Meter is the easiest way to identify strong and weak currencies. The indicator shows the relative strength of 8 major currencies: AUD, CAD, CHF, EUR, GBP, JPY, NZD, USD. By default the strength value is normalised to the range from 0 to 100 for RSI algorithm: The value above 60 means strong currency; The value below 40 means weak currency; The indicator is created and optimized for using it externally at an Expert Advisors or as a Custom Indicator inside your programs. For
Chart State Saver for MT4 is utility which helps to save states of all your charts even if they will be closed. And then all saved charts' states can be easily loaded back to charts. It stores templates for each particular currency pair and automatically applies them to charts once they will be opened at next time. Also they can be applied to the charts by your own needs. Thus you can close any chart at your MT4 without scaring to lose chart's data like drawls, messages, chart styling and so
MA Bounce Strategy for MT4
ALEKSANDR SHUKALOVICH
The MA Bounce Strategy is a strategy that seeks to long FX pairs on a strong uptrend as they bounce off their MA support and shorting FX pairs on a strong downtrend as they bounce off MA resistance. The best suitable periods of moving averages for that strategy are 18, 30, 50. This indicator helps to identify and find place for potential market entry by MA bounce strategy. Read   More information about  MA Bounce Strategy . By default MA Bounce Strategy indicator is configured for trading of M1
News Scalping Executor is an utility which helps to trade high impact and huge volatility   news . This utility helps to create two opposite orders with risk management and profit protection. It moves automatically stop loss level to avoid losses as much as possible by using many different algorithms. It helps to avoid trading the news if spread suddenly becomes very huge. It can lock profit by moving stop loss or partially closing of orders. To be profitable with this type of trading you s
Currency Strength Meter is the easiest way to identify strong and weak currencies. This indicator shows the relative strength of 8 major currencies + Gold: AUD, CAD, CHF, EUR, GBP, JPY, NZD, USD, XAU. Gold symbol can be changed to other symbols like XAG, XAU etc. By default the strength value is normalised to the range from 0 to 100 for RSI algorithm: The value above 60 means strong currency; The value below 40 means weak currency; This indicator needs the history data of all 28 major curre
Currency Strength Meter is the easiest way to identify strong and weak currencies.   The   indicator shows the relative strength of 8 major currencies: AUD, CAD, CHF, EUR, GBP, JPY, NZD, USD. By default the strength value is normalised to the range from 0 to 100 for RSI algorithm: The value above 60 means strong currency; The value below 40 means weak currency; The indicator is created and optimized for using it externally at an Expert Advisors or as a Custom Indicator inside your programs.
Trend Power for MT5
ALEKSANDR SHUKALOVICH
5 (1)
Trend Power Indicator is an indicator which helps to identify trend direction and its power by using moving averages ZigZag pattern and correlations of tradable instruments. It provides trend power data with user-friendly interface which can be read easily and fast.   This indicator by default is configured for trading of   Adam Khoo's   ( Piranhaprofit ) strategies. It saves mass of time for searching of tradable pairs by his strategies. It indicates when all required moving averages are align
Chart State Saver for MT5 is utility which helps to save states of all your charts even if they will be closed. And then all saved charts' states can be easily loaded back to charts. It stores templates for each particular currency pair and automatically applies them to charts once they will be opened at next time. Also they can be applied to the charts by your own needs. Thus you can close any chart at your MT5 without scaring to lose chart's data like drawls, messages, chart styling and so o
MA Bounce Strategy for MT5
ALEKSANDR SHUKALOVICH
The MA Bounce Strategy is a strategy that seeks to long FX pairs on a strong uptrend as they bounce off their MA support and shorting FX pairs on a strong downtrend as they bounce off MA resistance. The best suitable periods of moving averages for that strategy are 18, 30, 50. This indicator helps to identify and find place for potential market entry by MA bounce strategy.  More information about  MA Bounce Strategy can be read by this link  https://www.mql5.com/en/blogs/post/743037 .  By defau
필터:
GoodMorningg
525
GoodMorningg 2022.09.19 21:19 
 

Индикатор - 5 звезд из 5. Поддержка от разработчика - 10 звезд из 5. Спасибо за ваш труд, хорошая поддержка дорогого стоит!

ALEKSANDR SHUKALOVICH
6341
개발자의 답변 ALEKSANDR SHUKALOVICH 2022.09.22 00:26
Спасибо за ревью. Будут предложения по улучшению продукта, с удовольствием рассмотрю их.
theodorp
97
theodorp 2022.09.08 17:36 
 

Excellent Product Aleksandr.

ALEKSANDR SHUKALOVICH
6341
개발자의 답변 ALEKSANDR SHUKALOVICH 2022.09.08 20:09
Thanks a lot. It's very importnt for me.
Multi Disipliner
352
Multi Disipliner 2022.04.20 13:48 
 

The best

ALEKSANDR SHUKALOVICH
6341
개발자의 답변 ALEKSANDR SHUKALOVICH 2022.04.20 18:10
Thanks for your review. It's very important for me.
리뷰 답변
버전 7.0 2023.12.18
Improved CCI algorithm and its coordinate system is converted to dimension from 0 to 100 values.
Improved RVI algorithm and its coordinate system is converted to dimension from 0 to 100 values.
Improved Momentum algorithm and its coordinate system is converted to dimension from 0 to 100 values.
Improved DeMarker algorithm.
Improved MACD algorithm.
Added ADX algorithm for instruments' volatility measurement (not to measure strength, the higher the value, the higher the volatility of the instrument).
Changed graph timeframes expression from "Current:[Current]" to "M1:[M5];M5:[AV[M15,M30]];M15:[H1];M30:[H4];H1:[H4];H4:[D1]" (To change it back set property "Graph timeframes expression" tp "Current:[Current]").
"Current:[Current]" expression means: for current chart timeframe show strength which would be calculated on the same timeframe;
"M1:[M5];M5:[AV[M15,M30]];M15:[H1];M30:[H4];H1:[H4];H4:[D1]" expression means:
M1:[M5] - M1 chart timeframe show graph lines which would be calculated on M5 timeframe candles for every one minute (M1);
M5:[AV[M15,M30]] - M5 chart timeframe show graph lines which would be calculated as average of M15 and M30 timeframes candles for every 5 minutes (M5);
M15:[H1] - M15 chart timeframe show graph lines which would be calculated on H1 timeframe candles for every 15 minute (M15);
Other parts of expression can be defined similar to above;
Graph lines labels are visible now by default (to hide them set property "Is graph line labels visible" to false).
Changed default font size for graph lines labels from 14 to 11 (to change it back set property "Line labels font size" to 14).
Changed default table's cell width for simple table from 60 to 62 to accommodate time at info cell.
Log level changed from "Disabled" to "Error" (if you do not need logs messages you have to change property "Log level" to "Disabled").
"Update on every tick " now updates CSM data if new quote would be received for any of monitoring pairs.
Fixed blinking of tables on dashboard.
Fixed clicking on grid of table's headers cells.
Added information cell on table's header which can show different types of information or be as a "Button" to do some work.
Updated contact information at indicator's "About" property tab.
Added possibility to get alerts separately for all found tradable pairs.
Added seconds to notification's time in notifications signals.
Improved logging.
Added possibility to move dashboard to main window and any sub-window of a chart.
Fixed incorrect focus of dashboard's controls if there are several sub windows on a chart.
Added possibility to use "." and ";" symbols as a separator for timeframes formula for average value calculation of simple and sorted dashboard tables.
Improved parsing of "Graph timeframes Expression":
* Fixed indicator initialization failure if there is no binding between graph lines timeframes and current chart timeframe.
* Added possibility to set empty string to "Graph timeframes Expression", it works similar like "Current[Current]" expression.
Recompiled with new MQL compiler and others minor improvements and fixes.
버전 6.10 2023.02.28
Added possibility to change number of decimals for simple table, sorted table, graph labels and graph lines libels.
버전 6.0 2023.02.17
Added sessions time for throwing notifications.
Added possibility to choose show or not show cross lines notification for instruments' for which symbol does not exist.
Improved support of partial strength calculation if not all required history data is available.
Improved indicator work stability.
Improved trace messages.
Fixed mistype at trace messages.
Fixed algorithm of moving average value calculation.
Fixed tradable pairs searching with moving average algorithm in some cases.
Fixed not throwing of cross lines notification if at least one of 28 symbols does not exists.
Fixed out of range error in some cases.
버전 5.41 2022.10.18
Fixed indicator loading if some history data is missed for MACD algorithm.
버전 5.40 2022.10.17
Added MACD algorithm for currencies' strength value calculation.
Added LM (max level boundary) algorithm for tradable pairs searching.
버전 5.30 2022.09.22
Fixed of not needed drawing for invisible graph lines in some cases.
Added better support of x0.5 scaling.
Window's title icon, Window's caption text and Window's main buttons icons are aligned by center.
버전 5.22 2022.09.11
Added possibility to show label for history line with history line's date and time.
버전 5.12 2022.08.30
Workaround incorrect GBP symbols parsing by IG broker.
버전 5.11 2022.08.23
Workaround incorrect symbol parsing by IG broker.
버전 5.10 2022.07.25
Prevented redundant log writing if dashboard window is invisible.
Improved strength value calculation if new candle for some pairs of 28 is appeared and for some pairs of 28 new candle is not appeared yet (haven't received new ticks for some pairs of 28 at time when new candle should be formed).
버전 5.0 2022.06.19
Added possibility to show graph lines for multiple timeframes for the same instrument at one sub-window.
Added possibility to change table header text color for all tables.
Added possibility to change text color of table cells for weak, strong and neutral currencies strengths.
Added possibility to chose speed optimization for calculation graph lines for "Time based calculation" (Set property "Use fast time based calculation" to false for dip history back testing. It's slow but very accurate. Use this method for back testing your strategy.. Set property "Use fast time based calculation" to true for fast calculation. It can show little different values dip in history. Use this method for trading.).
Added average strength calculation from different timeframes for graph lines (values of graph lines are calculated by average CSM value of specified Timeframes f.e. AV[H1,H4]).
Added possibility to use specified graph lines timeframes according to current chart timeframe (f.e. Chart timeframe M15 - graph lines timeframes AV[H1, H4];H1 or Chart timeframe H1 - graph lines timeframes AV[H4, D1];H4).
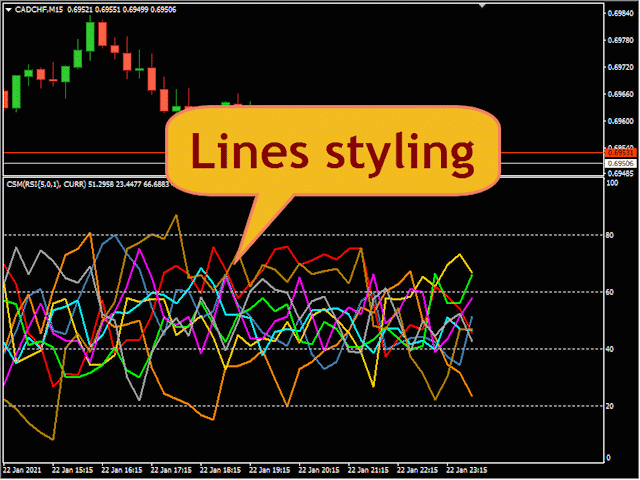
Added graph lines styling for lines of current chart timeframe.
Added graph lines styling for lines of current chart instrument and current chart timeframe at the same time.
Added possibility to show maximum available points to draw graph lines if user has requested data for more than available points by "Candles for calculation" property.
Added "Disabled" log level and it's used by default.
Added possibility to change Libels view of Graph Lines by expression with 3 different replacement variables: ${Instrument}, ${Timeframe}, ${Strength}.
Added possibility to change symbol of current chart by clicking instruments names on headers of simple table rows on dashboard.
Added possibility to change timeframe of current chart by clicking on timeframes on header of simple table columns on dashboard.
Added possibility to change timeframe of current chart by clicking on timeframes on header of sorted table columns on dashboard.
Updated GUI Processor with many graphical improvements and bug fixes of UI processor.
Improved strength calculation speed.
Improved loading speed of graph lines by caching values.
Improved calculation speed of indicator processors for "Time based process" (if possible it passes calculation to "Index base process" which is much faster than "Time based process").
Improved initialization speed of CorrelatedIndicatorProcessor for MT5.
Improved log messages and added new messages to log.
Workaround incorrect symbol parsing by XM broker.
Fixed not updating indicator strength values in some cases (when history time equals to 0, transmitting to "Index base" calculation).
Fixed slow loading data of simple table on dashboard.
Fixed invalid data for drawing on graph lines if "Candles for calculation" property is set to 0.
Fixed wrong average strength value calculation in some cases.
Refactoring and many other improvements.
버전 4.0 2021.12.31
Added possibility to run many instances of indicator to the same chart window.
Added application source description for all notifications, it helps to identify from which instance of indicator a notification was thrown.
Added possibility to change the names of tradable pairs table's columns.
Added tracing for terminal information, broker information, MQL program information and input parameters information.
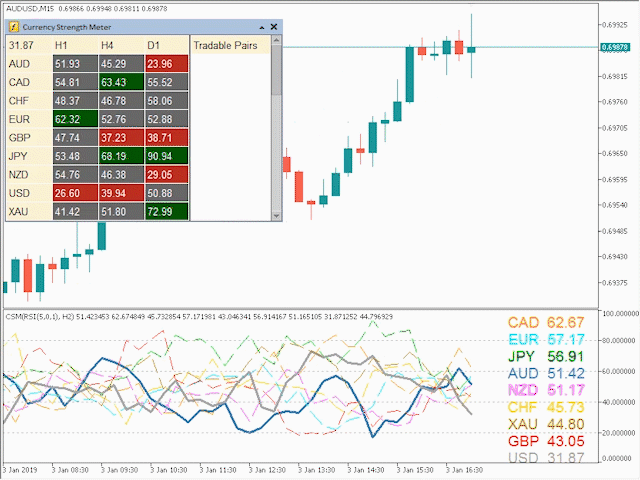
Added "Get instruments from" property for Simple Table, Sorted Table and Tradable Pairs Table to show strength only for specified instruments.
Added possibility to draw graph lines for instruments from specified symbols or specified instruments.
Added possibility to show Cross Lines Notification for instruments from specified symbols or specified instruments.
Added possibility to show Cross Level Notification for instruments from specified symbols or specified instruments.
Added possibility to show Tradable Pairs Notification for instruments from specified symbols or specified instruments.
Added possibility to show Currencies Strength State Notification for instruments from specified symbols or specified instruments.
Added possibility to change table head color for all tables (Simple table, Sorted table, Tradable pairs table).
Added possibility to highlight tables' timeframes cell for current chart timeframe by different color.
Added possibility to highlight tables' instruments cells for current chart symbol by different color.
Added cross level notifications for average strength from multiple timeframes.
Added cross lines notifications for average strength from multiple timeframes.
Added possibility to search crosses lines for cross lines notifications on different timeframe together at the same time (works as AND condition) like it was done for crosses levels notifications.
Added new filtering algorithm for tradable pairs searching. It's called "Symbols". It allows to search tradable pairs with pairs which are listed by user or ignore pairs which are listed by user.
Changed MA algorithm rules for search of tradable pairs (If you are using custom tradable pairs expression do not forget to update your expression according new rules for MA algorithm).
Improved indicator initialization stability.
Fixed not showing last tradable pair at tradable pairs table if all pairs should be shown by condition.
Fixed not getting tradable pairs notifications.
Fixed typo mistakes at input parameters of indicator.
버전 3.3 2021.08.21
Optimized of CSM values calculation by caching values for every update circle (7 times faster, load of CPU for CSM values calculation is reduced for 85 percent).
Added several algorithms for processing of TradablePair table's cell clicking (open pair at new chart, open pair at other chart or new one if it is not opened yet).
Added scrolling of chart to history line time if it is out of view (it allows do not lose history line).
Fixed DeMarker algorithm name.
Speed up of tradable pairs searching with MA algorithm at indicator init time and switching timeframes.
버전 3.2 2021.06.26
Added 5 properties for tradable pairs expression (this properties are concatenated together and it allows to avoid MQL limits for property length of 226 chars, now it's possible to use expression with 1130 chars length).
버전 3.1 2021.06.23
Added possibility to enable tradable pairs notifications only for specified columns.
버전 3.0 2021.06.07
Added possibility to backtest history data with history line at specified time with one minute accuracy (not only with close time of candle).
Added time based graph lines calculation (It allows to show currencies strength which is calculated on specified timeframe on candle close time of current chart timeframe).
Added possibility to change Gold symbol. It allows to use any different symbol not only gold but XAG, XAU etc.
Added Bullish or Bearish direction of tradable pairs in tradable pairs notification message.
Sorting of tradable pairs alphabetically.
Adding history line object to visible list of chart objects.
Keeping history line state on chart even if indicator's properties have changed.
Momentum algorithm values for strength calculation is multiplied by 100.
RVI algorithm values for strength calculation is multiplied by 100.
Disabled ray property of history line.
Fixed out of range index error for indicator buffer for some CSM Algorithms.
Fixed wrong shift between text labels and graph lines for extended timeframes at MT5 (M2, M6,M10,H2...).
버전 2.12 2021.04.05
Fixed indicator buffer index out of range error for some CSM Algorithms.
버전 2.11 2021.03.31
Fixed tradable pairs finder for MA alignment algorithm if Gold is enabled.
버전 2.10 2021.03.29
Added navigation through tradable pairs by left mouse click on calls of tradable pairs table.
Added bearish and bullish coloring of tradable pairs table according to expression at indicator properties.
Added possibility to change color for bearish and bullish of tradable pairs cells.
Added bearish or bullish description next to tradable pair for Currency Strength State Notification.
Added new DM (Difference max between currencies' strength) algorithm for tradable pair search engine.
Added Moving Averages Alignment algorithm for tradable pair search engine.
Fixed D (Min Difference between currencies' strength) algorithm for tradable pair search engine for (CCI, RVI and Momentum algorithms).
Fixed indicator initialization if cross level expression is empty at indicator properties.
버전 2.3 2020.12.31
Added possibility to use multiple tradable pairs finders.
Added tradable pairs state to Currency Strength State Notification.
Added possibility to change visible rows count for tradable pairs table.
버전 2.2 2020.11.23
Added possibility to add dashboard window to chart main window.
버전 2.1 2020.11.20
Fixed sending Tradable Pairs notification.
버전 2.0 2020.11.17
Added high resolution screens support (4K).
Added User Interface (UI) scaling and Font scaling.
Added support of strength identification for Gold.
Added expression based tables columns visibility, It allows to customize tables columns.
Added possibility to get notification once N period candle is closed.
Added expression based notification for levels crossing, which allows to get notifications when there is a cross on many different timeframes all at once.
Added averaging CSM values for different timeframe for tradable pairs finder.
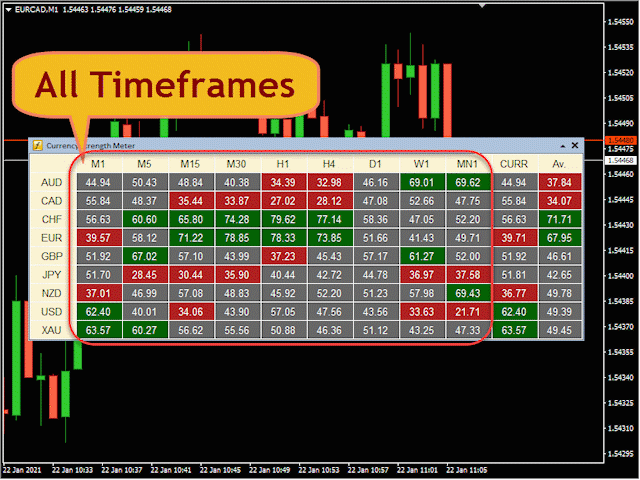
Added support for all timeframes (M1,M2,M3,M4,M5,M6,M10,M12,M15,M20,M30,H1,H2,H3,H4,H6,H8,H12,D1,W1,MN1,Current).
Added new Currencies Strength State Notification which shows strength of all currencies as N period candle is closed.
Added averaging CSM values for Currencies Strength State Notification.
Improved history data loading. It allows to show indicator data more faster if history data is missed.
Improved logging at notifications area.
Fixed delay of dashboard data updating after timeframe switching.
Fixed updating indicator data when market is closed, when there is not any ticks.
Fixed not sending of notifications on some conditions.
Fixed typo mistakes.
버전 1.10 2020.07.09
Added auto detection of symbols suffix.
Restore dashboard state when change chart symbol, timeframe, reconnection to the server and changing indicator properties.
Added highlighting of graph lines for current chart instruments.
Added scale ration parameter for RSI algorithm.
Fixed showing of graph lines if selected "Chart Symbols" for "Symbol Type" property.