Trend Agile
- 지표
- Ivan Simonika
- 버전: 1.0
- 활성화: 5
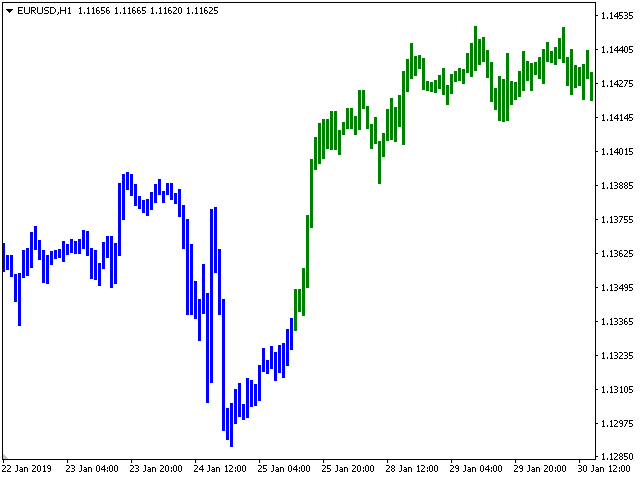
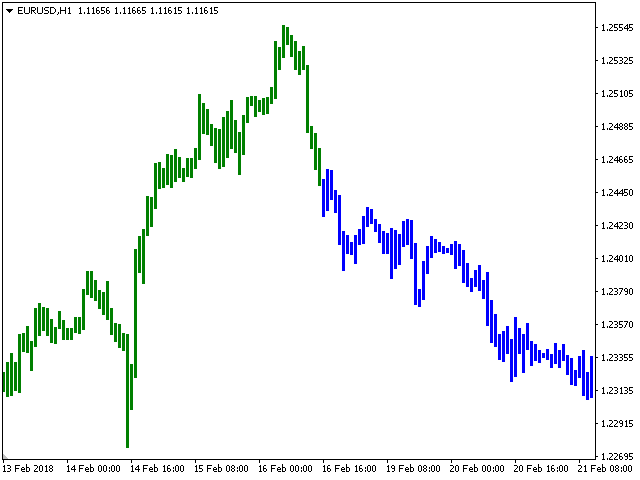
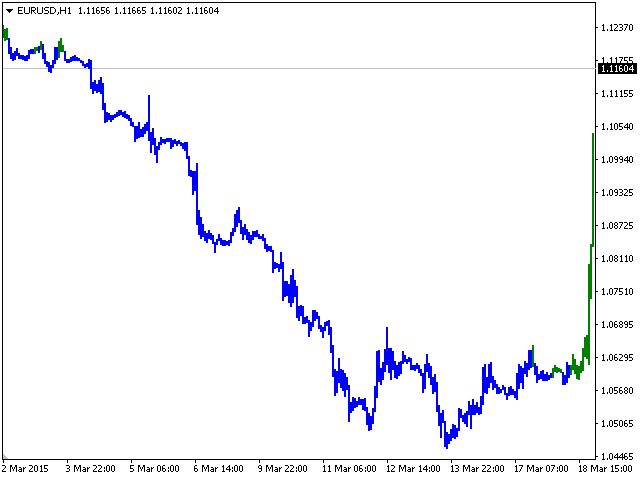
The Trend Agile indicator tracks the market trend with very high reliability. Sharp price fluctuations, as well as noise around
averaged prices, are ignored. All intersection points will be ideal points at which the direction of the trend changes. Signal points,
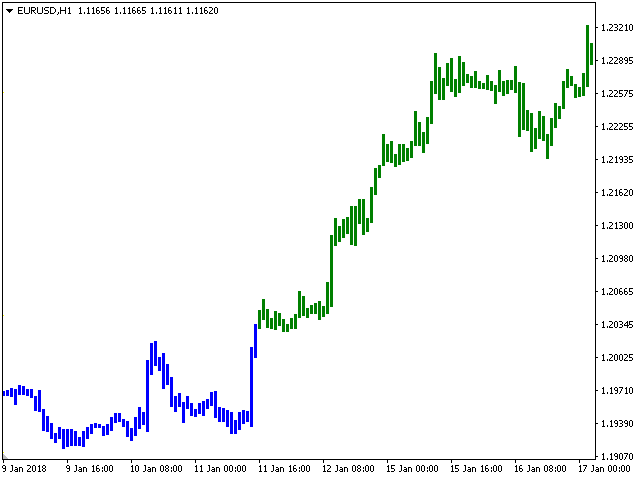
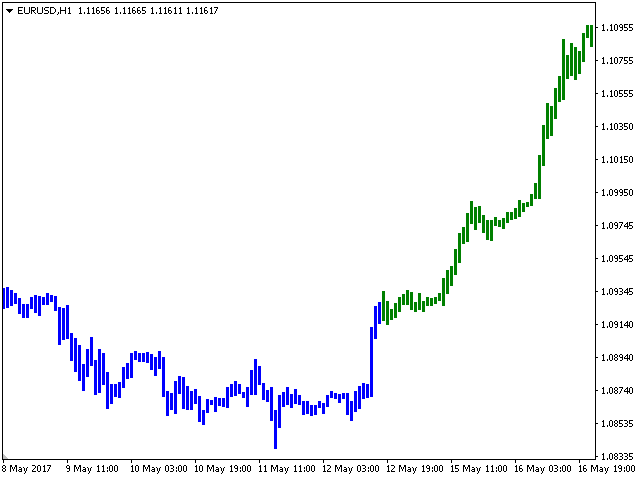
places where color changes, can be used as points of potential market reversal. This development can be used both for long-term trading, and
for piping on small periods. The indiuctor algorithm implements a variety of technical analysis based on the idea that the market is
cyclical in nature. It signals a new trend and shows favorable moments of entry into the market.