Trade History Drawer
- 지표
- David Leander Tschacher
- 버전: 1.0
- 활성화: 5
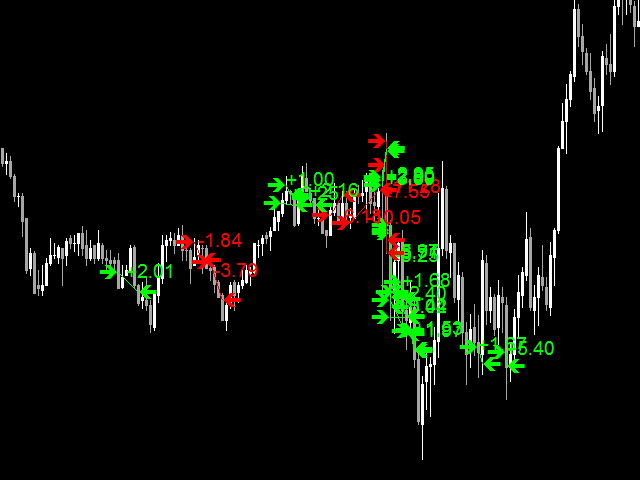
Trade History Drawer is an indicator for MetaTrader 4.
It shows trades on the chart and draws them in customized colors.
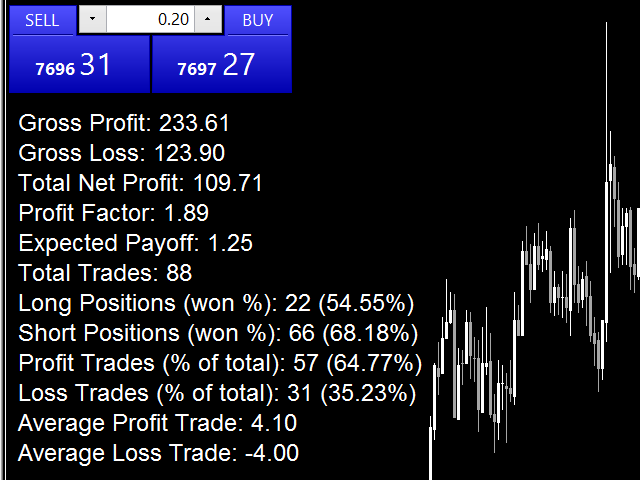
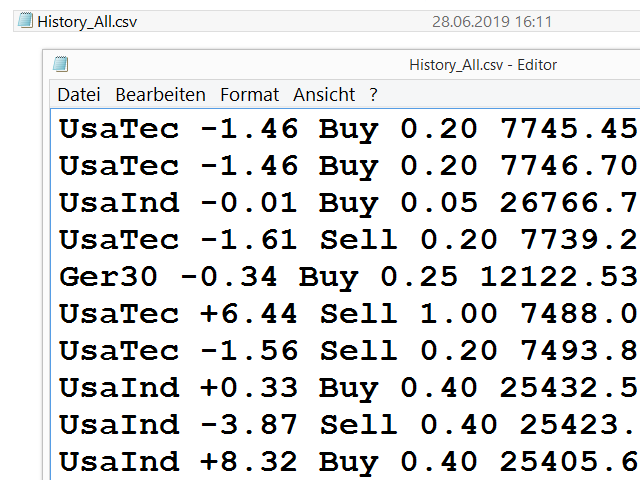
Furthermore, the indicator shows a trade summary and saves a CSV history file for either one selected pair or all pairs.
Inputs
General Settings
CSV File Settings
Color Settings
Trade Summary Settings
It shows trades on the chart and draws them in customized colors.
Furthermore, the indicator shows a trade summary and saves a CSV history file for either one selected pair or all pairs.
Inputs
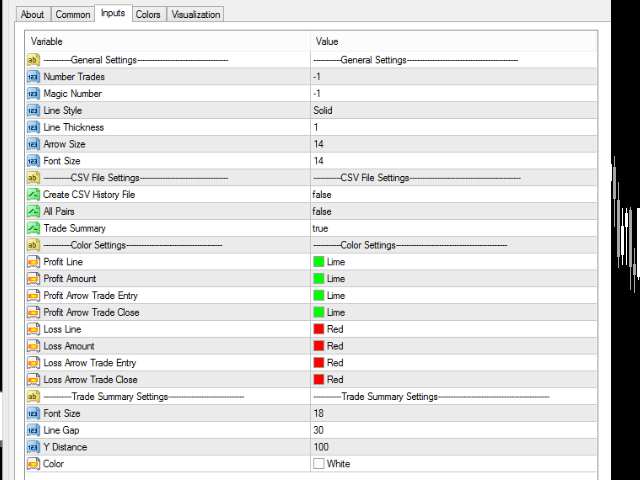
General Settings
Number Trades: Number of trades to be drawn on the chart, if -1 then all trades
Magic Number: Only trades with this magic number, if -1 then ignore
Line Style: Line Style
Line Thickness: Line Thickness
Arrow Size: Arrow Size
Font Size: Font Size
CSV File Settings
Create CSV History File: Whether or not a CSV Button should be shown
All Pairs: Whether or not all Pairs should be considered
Trade Summary: Whether or not a trade summary should be shown and saved
Color Settings
Profit Line: Color Profit Line
Profit Amount: Color Profit Amount
Profit Arrow Trade Entry: Color Profit Arrow Trade Entry
Profit Arrow Trade Close: Color Profit Arrow Trade Close
Loss Line: Color Loss Line
Loss Amount: Color Loss Amount
Loss Arrow Trade Entry: Color Loss Arrow Trade Entry
Loss Arrow Trade Close: Color Loss Arrow Trade Close
Trade Summary Settings
Font Size: Font Size of the trade summary
Line Gap: Line gap of the trade summary
Y Distance: Y Distance of the trade summaryColor: Font color of the trade summary