Pivot MT5
- 지표
- Dmitrij Isaenko
- 버전: 1.21
- 업데이트됨: 19 4월 2023
- 활성화: 5
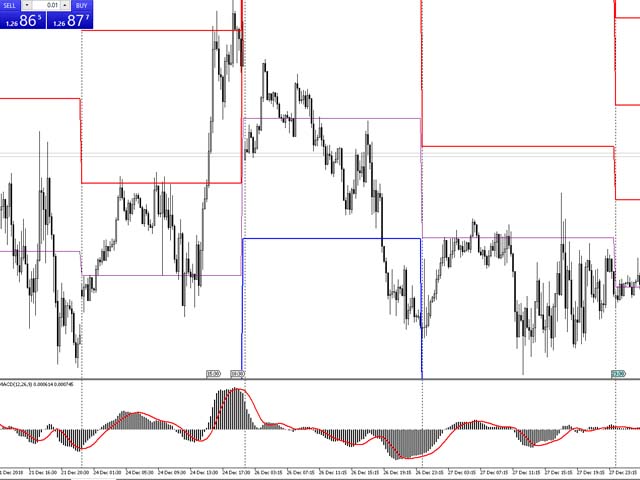
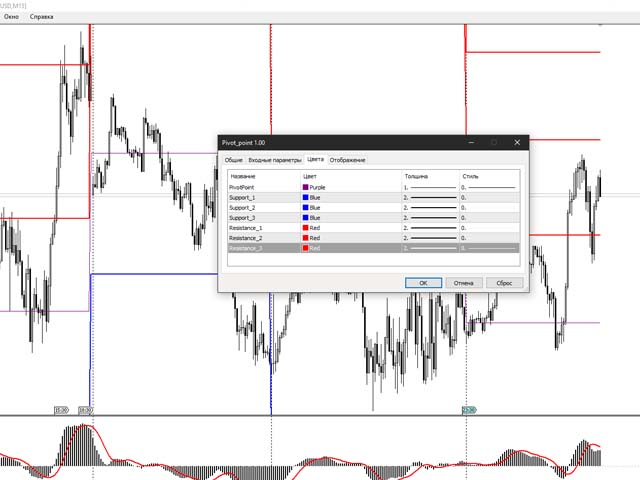
The indicator draws daily support and resistance lines on the chart, as well as the Pivot level (reversal level).
Adapted to work in MT5
The standard timeframe for calculating support and resistance levels is D1.
You can choose other timeframes according to your strategy (for example, for M1-M15, the optimal timeframe for calculations is H1)
The function for calculating support and resistance levels has been updated; in this calculation option, fibonacci levels are taken into account, respectively, for each of the timeframes.
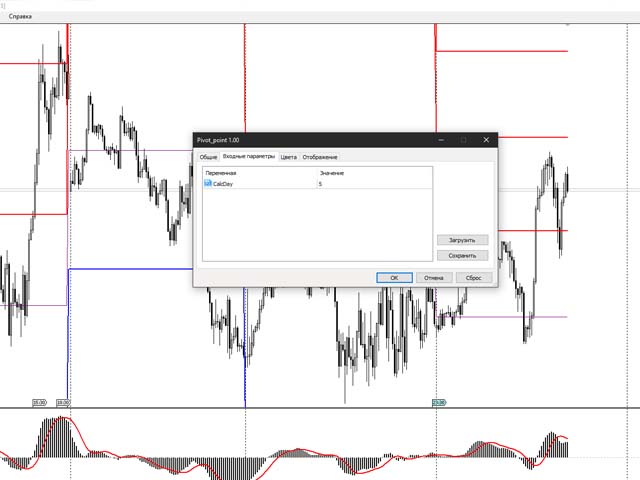
Indicator parameters:
- Period_TF - timeframe for calculating support and resistance levels

사용자가 평가에 대한 코멘트를 남기지 않았습니다