Mercadulls
- 지표
- Gilberto Rodrigues
- 버전: 2.21
- 활성화: 5
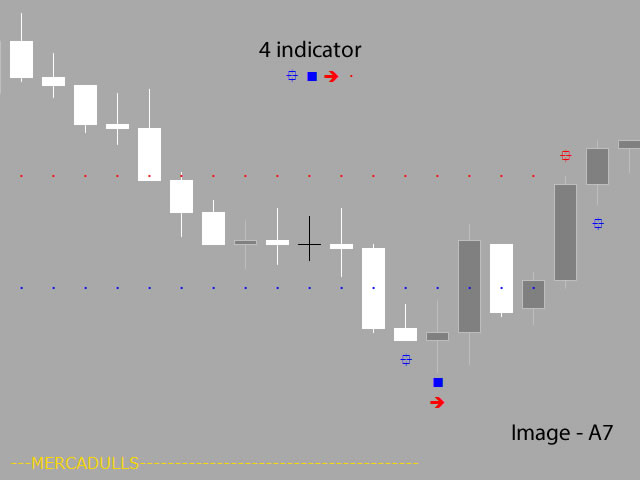
The Mercadulls Indicator gives to you 4 signals types, detecting supports, resistances and accumulation/distribution zones. The indicator constantly checks the graph for direct analysis and the appearance of long trends.
Main characteristics
- No repaint!
- Stop loss and take profit levels are provided by the indicator.
- Suitable for Day Traders, Swing Traders, and Scalpers.
- Optimized algorithm to increase the accuracy of signals.
Technical analysis indicator for all assets available in the market.
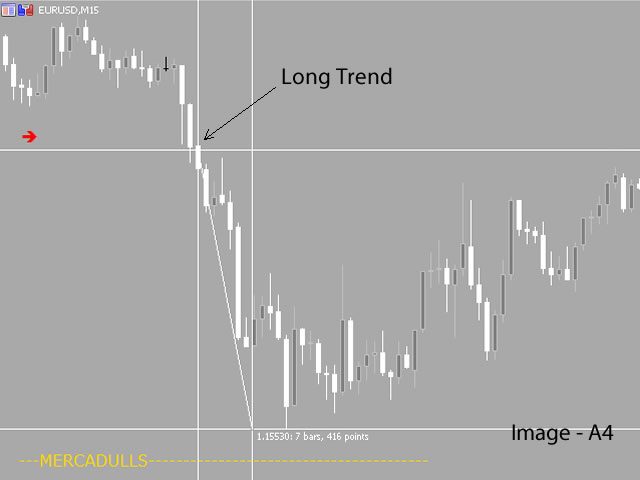
Long Trend. The buy signal (Image A3) and the sell signal (Image A4).
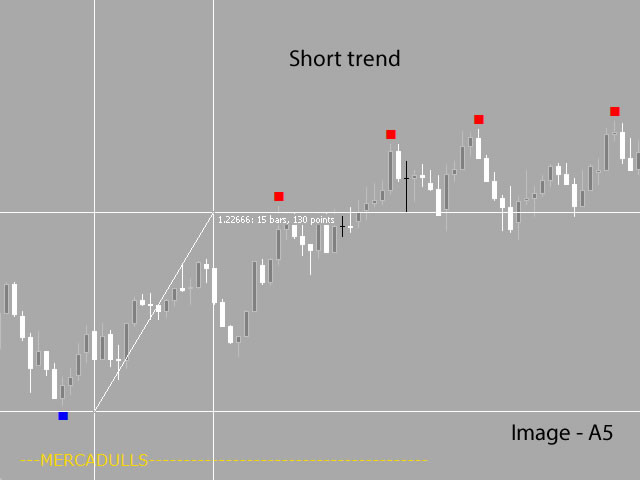
Force Trend. This parameter can be changed to have precision of the support and resistance lines, the values can be tested and optimized by the user, the default value is 34. See Image A5.
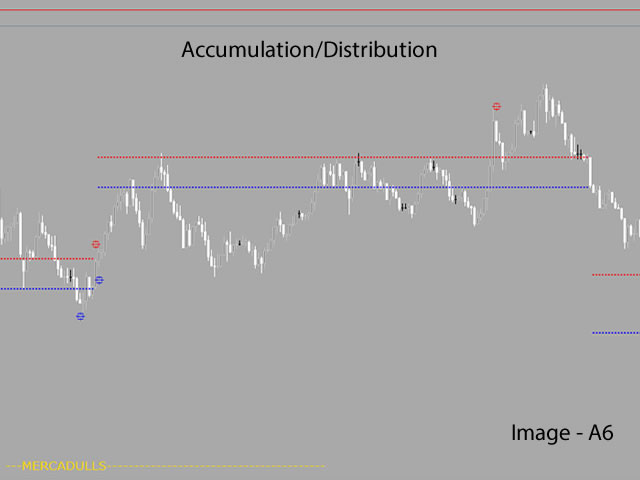
Accumulation/Distribution - Its function is to indicate the direction of market pressure, either accumulation (high) or distribution (low). See Image A6.
All Periods:
- M1
- M5
- M15
- M30
- H1
- H4
- D1
This indicator does not repaint signs. It gives immediate signal when a new candle opens.
Easy to use.
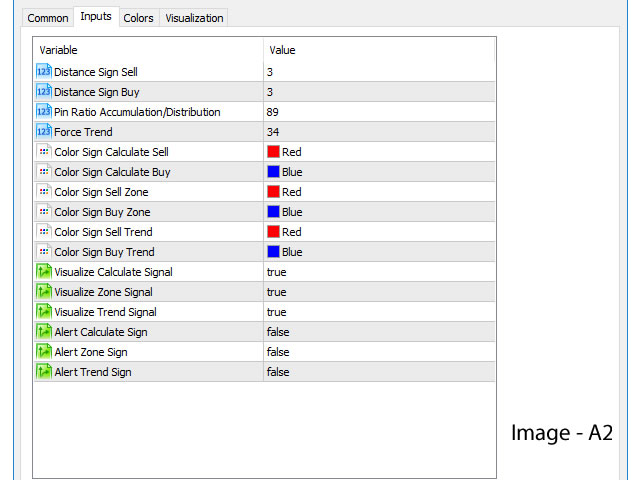
Display Settings
- Distance Sign Sell - The distance of the buy signal. The default value is three.
- Distance Sign Buy - Distance of the sell signal. The default value is three.
- Pin Ratio Accumulation/Distribution - Radius value to calculate of the accumulation and distribution zone. The default value is 89.
- Force Trend - Market force trend. The default value is 34.
- Color Sign Calculate Sell - Sell calculation color signal. The default value is red.
- Color Sign Calculate Buy - Buy calculation color signal. The default value is blue.
- Color Sign Sell Zone - Sell zone color signal. The default value is red.
- Color Sign Buy Zone - Buy zone color signal. The default value is blue.
- Color Sign Sell Trend - Selling trend color signal. The default value is red.
- Color Sign Buy Trend - Buying trend color signal. The default value is blue.
- Visualize Calculate Signal - Display the calculation signal from the indicator. The default value is true.
- Visualize Zone Signal - Display the zone signal from the indicator. The default value is true.
- Visualize Trend Signal - Display the trend signal from the indicator. The default value is true.
- Alert Calculate Sign - Alert message to the indicator calculation signal. The default value is false.
- Alert Zone Sign - Alert message to the indicator zone signal. The default value is false.
- Alert Trend Sign - Alert Message to the indicator trend signal. The default value is false.
Manage your risks, this indicator is only a tool to help you with technical analysis.
For Developers
Index to configure the trading experts:
- Force Trend - Index 0
- Sell Calculate = Index 1
- Buy Calculate = Index 2
- Accumulation and Distribution Sell Zone = Index 3
- Accumulation and Distribution Buy Zone = Index 4
- Exit from Accumulation and Distribution Sell Zone = Index 5
- Exit from Accumulation and Distribution Buy Zone = Index 6
- Sell Trend = Index 8
- Buy Trend = Index 9


사용자가 평가에 대한 코멘트를 남기지 않았습니다