Helper for parameter selection MTF MT5
- 유틸리티
- Aleksej Poljakov
- 버전: 3.0
- 업데이트됨: 2 5월 2023
The script allows selecting the required 'Filter level' value of the AIS-MTF MT5 indicator.
Run the script on the required chart and selected timeframe. Once its operation is complete, the HPS.csv file will be created in the Files folder.
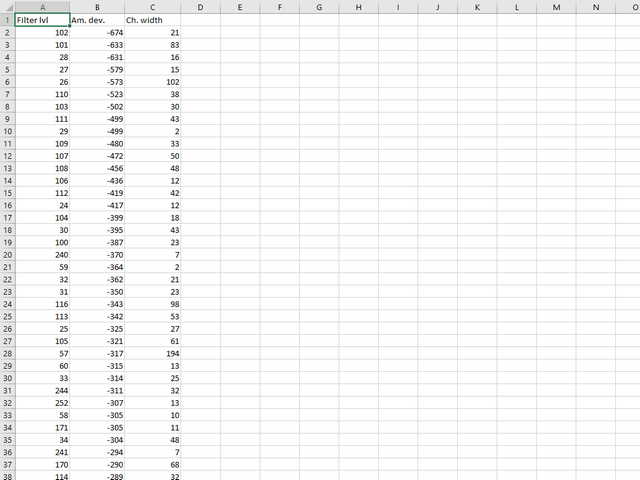
Open the file. You will see three columns.
- The 'Filter lvl' column represents the value of the 'Filter level' for the AIS-MTF indicator.
- Am. dev. - degree and direction of the indicator's deviation from the price level (sorted in ascending order). Negative values indicate that the indicator values approach the price level from below. Positive values mean that the indicator is often above the price level. Values close to zero show that the indicator fluctuates near the price level.
- Ch. width - width of the indicator channel.


사용자가 평가에 대한 코멘트를 남기지 않았습니다