Advanced Currency Impulse with Alert MT5
- 지표
- Bernhard Schweigert
- 버전: 7.0
- 업데이트됨: 30 3월 2024
- 활성화: 5
초보자 또는 전문가 트레이더를 위한 최고의 솔루션!
이 지표는 우리가 독점 기능과 비밀 공식을 통합했기 때문에 독특하고 고품질이며 저렴한 거래 도구입니다. 단 하나의 차트로 28개 통화 쌍 모두에 대한 경고를 제공합니다. 새로운 추세 또는 스캘핑 기회의 정확한 트리거 포인트를 정확히 찾아낼 수 있기 때문에 거래가 어떻게 개선될지 상상해 보십시오!
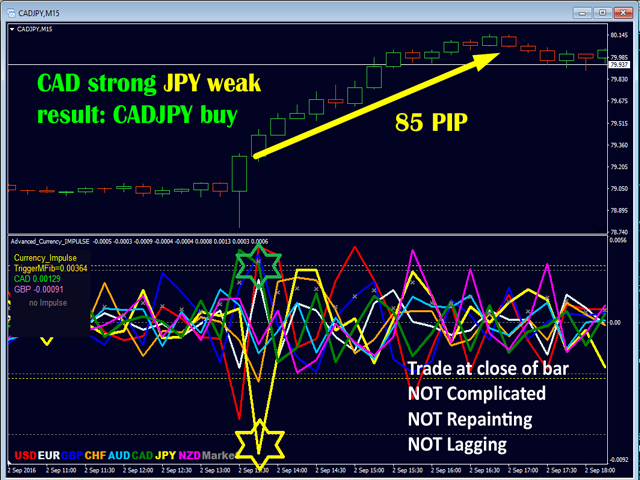
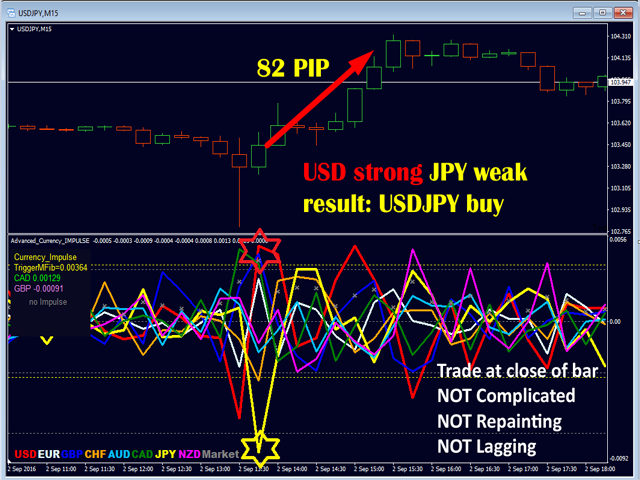
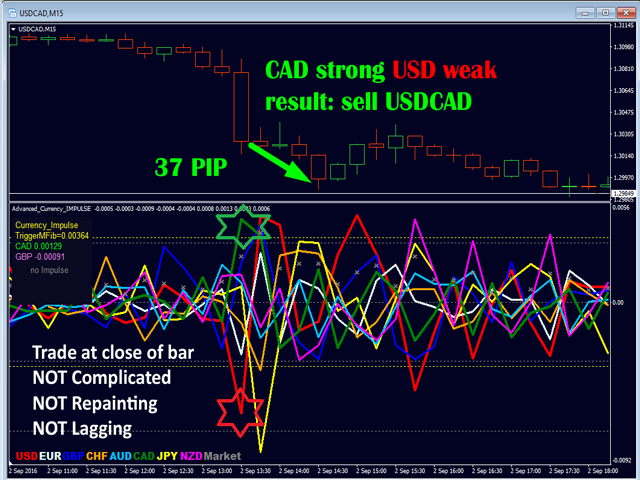
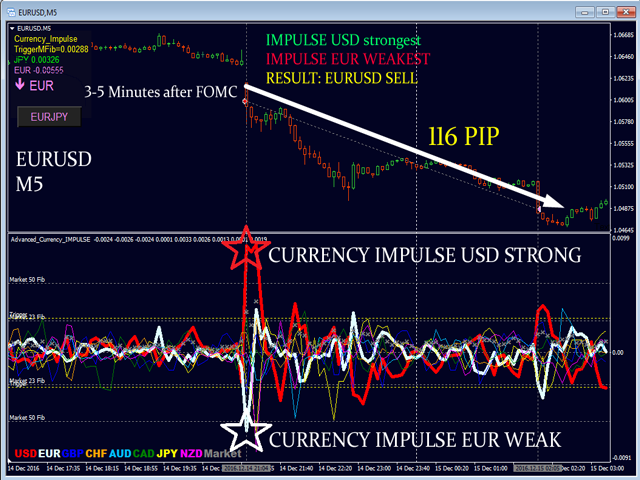
새로운 기본 알고리즘을 기반으로 구축되어 잠재적인 거래를 훨씬 더 쉽게 식별하고 확인할 수 있습니다. 이는 통화의 강세 또는 약세가 가속되는지 여부를 그래픽으로 표시하고 가속 속도를 측정하기 때문입니다. 자동차의 속도계처럼 생각하면 됩니다. 가속화할 때 Forex 시장에서 동일한 일이 분명히 더 빠르게 발생합니다. 즉, 반대 방향으로 가속화되는 통화를 페어링하면 잠재적으로 수익성 있는 거래를 식별한 것입니다.
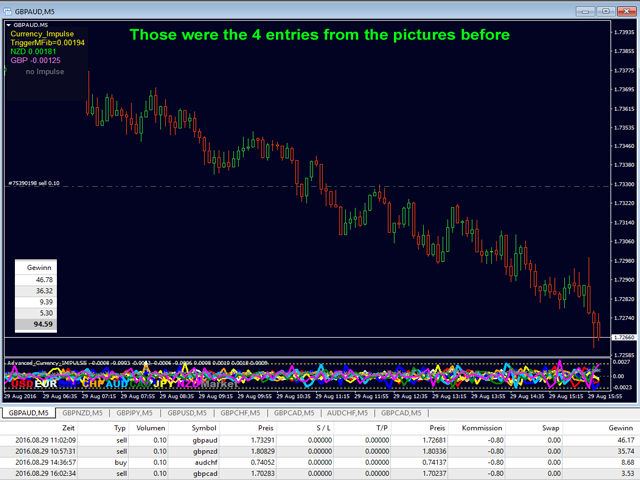
통화 모멘텀의 수직선과 화살표가 거래를 안내합니다!
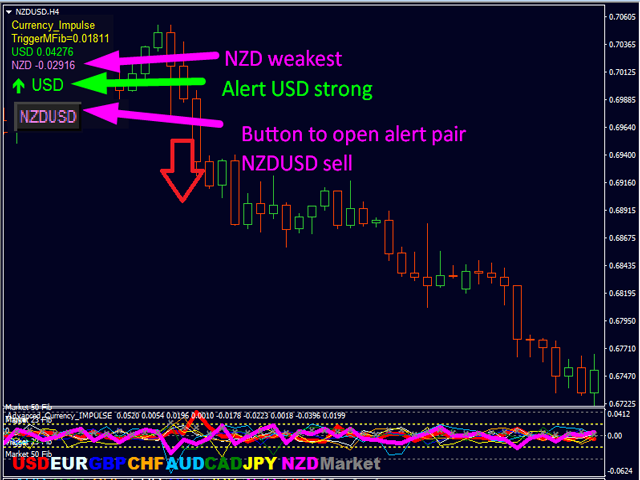
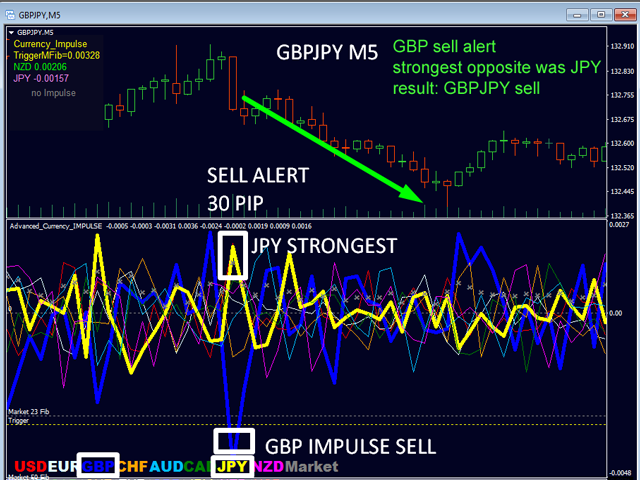
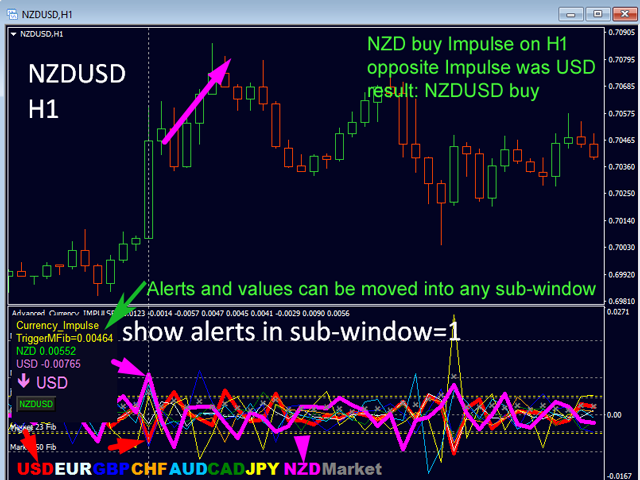
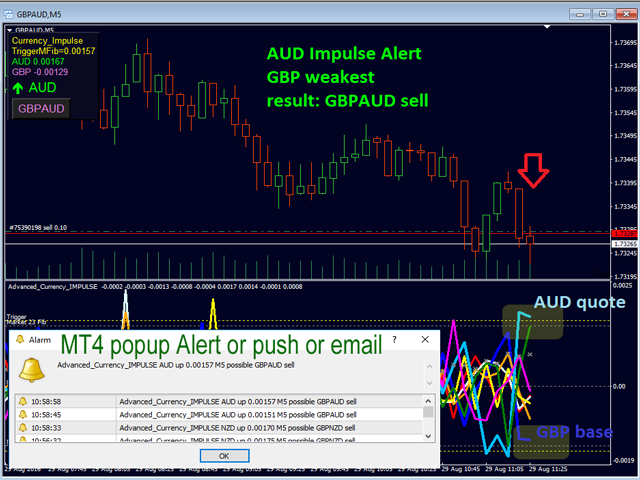
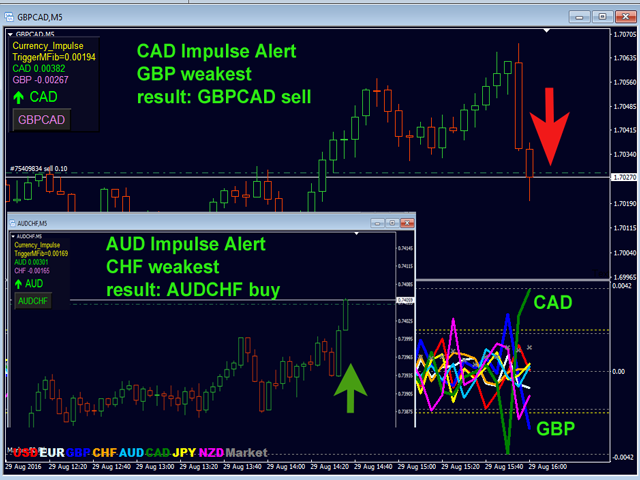
역동적인 Market Fibonacci 23 레벨은 경고 트리거로 사용되며 시장 활동에 적응합니다. 임펄스가 노란색 트리거 라인에 도달하면 MetaTrader 또는 이메일 또는 푸시 알림에 대한 알림을 받게 됩니다. 그런 다음 트레이더로서 무엇을 해야 하는지 알고 있습니다. 쌍과 방향은 이미 주어져 있습니다. 경고 버튼을 클릭하기만 하면 쌍으로 전환하거나 추가 분석을 위해 새 차트를 열 수 있습니다. 경보 수준은 사용자 입력으로 변경할 수 있으며 3가지 민감도 수준을 선택할 수 있습니다.
새로운 트렌드의 초기화 트리거를 조기에 잡아보세요! 이 가속 및 감속은 스윙 트레이더와 스캘퍼 모두 사용할 수 있습니다. 스윙 트레이더에게는 새로운 추세가 촉발되었을 때를, 스캘퍼에게는 어떤 쌍이 움직일 것인지를 보여줍니다. 고객과 우리 자신의 경험을 통해 우리는 두 지표가 함께 잘 작동하여 진정으로 1+1=3의 경우라는 것을 알고 있습니다!
표시기 매개변수 사용 설명서의 전체 목록을 참조하십시오!
- 임펄스 감도 - 느림/중간/빠름.
- 선 너비 기준 및 견적 CS - 차트의 통화를 두껍게 만듭니다.
- ...
경고 설정
- Fib 시장에서 CS-Impulse 트리거(높음=강함).
- V-Line에 대한 GAP 값(높음=강함).
- 임펄스 경고를 위해 화살표를 그립니다.
- ... 다른 사람
팁
- 내 템플릿을 사용하십시오.
- 경고 트리거 값은 설정의 모든 시장 피보나치 수준에서 편집할 수 있습니다. 임의의 숫자가 될 수 있습니다. 기본값은 25입니다. 노란색 선은 차트의 수준을 나타냅니다.
- 그런 다음 가장 높은 임펄스 값과 가장 낮은 임펄스 값을 볼 수 있습니다.
- 트리거 값에 도달한 통화가 뒤따릅니다(있는 경우).
- 그러면 추천 쌍이 있는 버튼이 나타납니다. 그것을 클릭하면 차트의 쌍이 변경됩니다. 조건이 더 이상 충족되지 않으면 버튼이 변경되거나 사라질 수 있습니다. 그래도 차트를 볼 수 있습니다.
- 지표를 중단하지 않으려면 "새 창에서 차트 열기"를 사용하십시오.
- 거래 시스템 및 거래 사례는 프로필에서 내 뉴스와 블로그를 확인하세요.
- 완전한 거래 시스템을 연구하십시오.
- 개인 메시지를 보내주세요. 자세한 정보, 링크, 템플릿은 STARTER-PACK 이메일을 요청하십시오. 나는 당신이 성공하기를 바랍니다!
질문이 있으시면 항상 도와 드리겠습니다.
앞으로도 많은 그린피를 기원합니다.
자동 번역! 영어 원본 여기를 클릭 https://www.mql5.com/en/market/product/22899


very good thank you bernhard