AIS Correct Averages MT5
- 지표
- Aleksej Poljakov
- 버전: 3.0
- 업데이트됨: 1 7월 2022
- 활성화: 5
AIS 올바른 평균 표시기를 사용하면 시장에서 추세 움직임의 시작을 설정할 수 있습니다. 지표의 또 다른 중요한 품질은 추세의 끝을 알리는 명확한 신호입니다. 표시기는 다시 그리거나 다시 계산되지 않습니다.
표시된 값
h_AE - AE 채널의 상한
l_AE - AE 채널의 하한
h_EC - 현재 막대에 대한 높은 예측 값
l_EC - 현재 막대에 대한 낮은 예측 값
표시기로 작업할 때의 신호
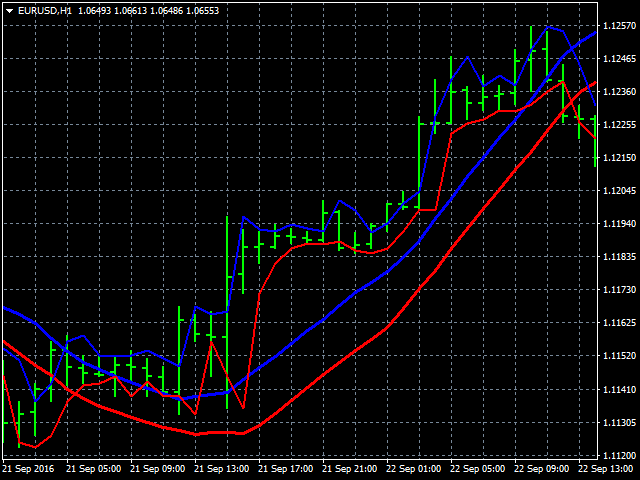
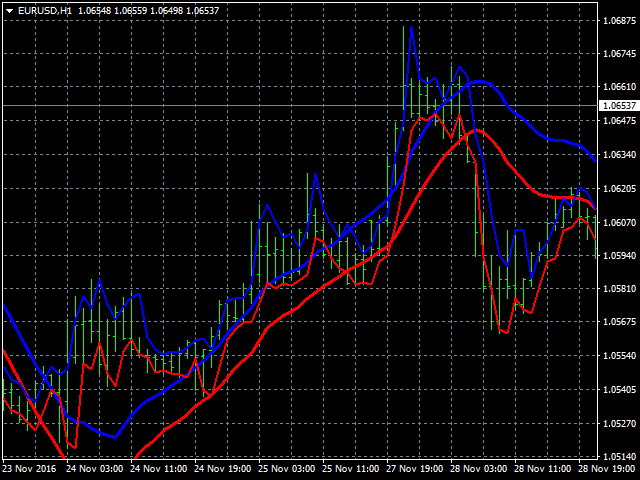
주 신호는 채널 AE와 EC의 교차점입니다.
l_EC선이 h_AE선 위에 있을 때 상승세가 시작될 수 있습니다.
하락추세의 시작은 h_EC선이 l_AE선 아래로 떨어지면서 예상할 수 있습니다.
이 경우 h_AE와 l_AE 라인 사이의 채널 너비에 주의해야 합니다. 그들 사이의 차이가 클수록 추세는 더 강해질 것입니다. 또한 AE 채널에 의한 로컬 고/저 달성에 주의를 기울여야 합니다. 이때 가격변동의 경향이 가장 강해진다.
사용자 지정 가능한 지표 매개변수
표시기 설정은 시간 프레임에 따라 LRH 매개변수를 선택하는 것으로 구성됩니다. 이 매개변수의 유효한 값 범위는 1~350입니다.
이 매개변수가 작을수록 표시기가 더 민감해지고 잘못된 신호가 증가할 수 있습니다. 반면에 이 매개변수는 너무 높게 설정하면 안 됩니다. 표시기가 덜 민감해지고 신호를 건너뛸 것이기 때문입니다.