MACD Divergence MT5
- 지표
- Sergey Deev
- 버전: 1.1
- 업데이트됨: 14 6월 2019
- 활성화: 5
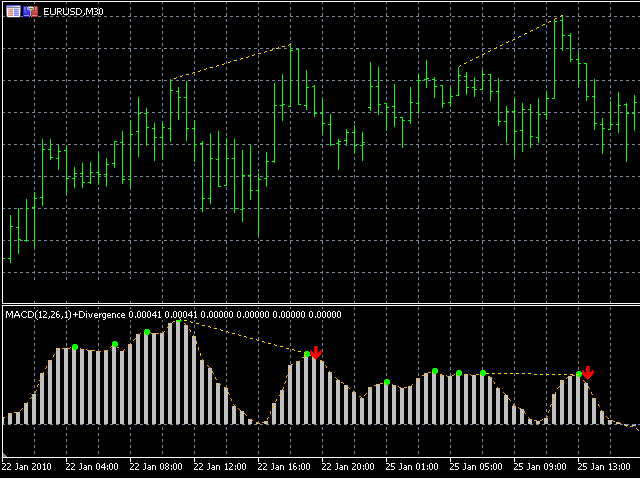
The indicator detects divergence signals - the divergences between the price peaks and the MACD oscillator values. The signals are displayed as arrows in the additional window and are maintained by the messages in a pop-up window, e-mails and push-notifications. The conditions which formed the signal are displayed by lines on the chart and in the indicator window.
The indicator parameters
- MacdFast - fast MACD line period
- MacdSlow - slow MACD line period
- MacdSignal - MACD signal line period
- MacdPrice - MACD indicator price
- PeakPoints - amount of bars for the MACD peak detection
- PeakDistance - the minimum distance between the MACD peaks
- lineColor - line color to display conditions on the chart
- UseAlert - enable pop-up window
- UseNotification - enable PUSH message
- UseMail - enable Email


사용자가 평가에 대한 코멘트를 남기지 않았습니다