• 미리보기
  • 리뷰 (2)
  • 코멘트 (8)
  • 새 소식

AO and AC Zones

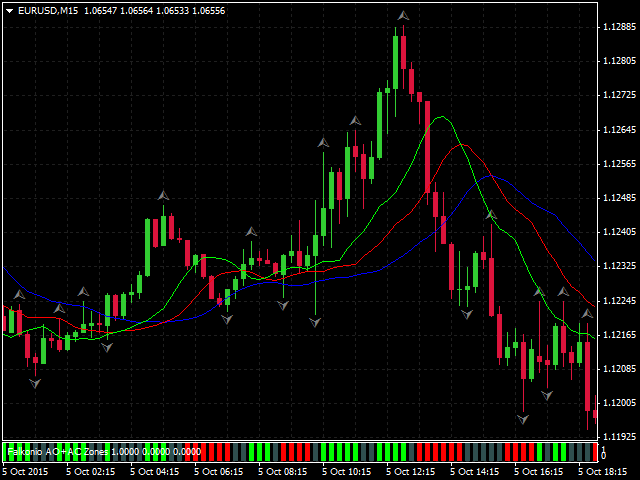
According to Bill Williams' trading system, the zone is formed by the combination of Accelerator Oscillator (AC) and Awesome Oscillator (AO). When they go up, we are in the green zone. When AO and AC bars are red, we are in the red zone. If one of the bars is red, while another is green, we are in the gray zone.

  • When the current AC and AO histogram bars exceed the previous ones, the indicator is colored in green.
  • If the current AC and AO histogram bars are below the previous ones, the indicator is colored in red.
  • If АО and АС have different colors, the indicator is gray.

Green and red zones

The zone allows you to trade aggressively and adjust the balance line signal in various zones. You can also actively add to your current positions.

Gray zone

Gray bars indicate that the driving force has one direction, while acceleration is aimed in the opposite direction. This may mean that the market (both buyers and sellers) temporarily loses interest in maintaining the current direction. We do not add to positions if the indicator is gray.

추천 제품
Black series MT4
Dmitriy Kashevich
1 (1)
Black series MT4 - The indicator is designed for trading on binary options with Timeframe M1-M5-M15 Multicurrency (Works on cryptocurrency and currency pairs) The signal appears when the candle opens Up to 90% correct signals There is no signal redrawing at all Can be used with other indicators. Good for scalping! In Settings there is: -Indicator working methods -I Allert Arrow color Red signal down Blue signal up Also watch the video how the indicator works and signals
GG TrendBar Indicator
Biswarup Banerjee
5 (1)
GG TrendBar Indicator - Your Multitimeframe ADX Trading Solution Experience the power of multi-timeframe trading with the "GG TrendBar Indicator." This versatile tool, built upon the ADX indicator, offers precise insights by considering multiple timeframes, ensuring you make well-informed trading decisions. Basic Details : Indicator Type : GG TrendBar Indicator (Multi-Timeframe ADX) Key Metrics : Real-time ADX analysis across multiple timeframes. Customization : Enable or disable specific timefr
ShinZuka
Muhammad Asyraf Bin Mohamad
Using MACD value for direction. Using RSI as reversal indicator. Using open trading hour. (Recommend Hour 10,11,15 & 19 : MT4-Time) Counter trade if signal failed. Cutloss trade if signal failed. Auto lot calculate based on target profit & takeprofit. Able to set counter trade value. Suitable for commodities & currency.  Timeframe H1. Able to set limit lot open. Able to select day to trade.
VR Cub
Vladimir Pastushak
VR Cub 은 고품질 진입점을 얻는 지표입니다. 이 지표는 수학적 계산을 용이하게 하고 포지션 진입점 검색을 단순화하기 위해 개발되었습니다. 지표가 작성된 거래 전략은 수년 동안 그 효율성을 입증해 왔습니다. 거래 전략의 단순성은 초보 거래자라도 성공적으로 거래할 수 있다는 큰 장점입니다. VR Cub은 포지션 개시 지점과 이익 실현 및 손절매 목표 수준을 계산하여 효율성과 사용 편의성을 크게 높입니다. 간단한 거래 규칙을 이해하려면 아래 전략을 사용한 거래 스크린샷을 살펴보세요. 설정, 세트 파일, 데모 버전, 지침, 문제 해결 등은 다음에서 얻을 수 있습니다. [블로그] 다음에서 리뷰를 읽거나 작성할 수 있습니다. [링크] 버전 [MetaTrader 5] 진입점 계산 규칙 포지션 개설 진입점을 계산하려면 VR Cub 도구를 마지막 최고점에서 마지막 최저점까지 늘려야 합니다. 첫 번째 지점이 두 번째 지점보다 빠른 경우, 거래자는 막대가 중간선 위에서 마감될 때까지 기다립
Candle Inside
Yuriy Vins
5 (1)
Candle Inside indicator - draws Japanese candlesticks of a higher timeframe on the chart. Now, after loading the indicator, it is possible to see what is happening inside each candle. In addition to the standard buttons for selecting the timeframe in the MT-4 terminal, additional buttons are added, when clicked, an older period is selected to display Japanese candles or zones. For example, if you select the standard period M1 and the period of the indicator M5, then the chart will display minute
MACD Divergence Finder
Segundo Calvo Munoz
MACD Divergence Finder Indicator will help you to find Divergences between your typical MACD values and the Chart Prices as potential points of actual Trend Reversion or Pull Backs to increase your positions as per the current Trend. Indicator Windows draws MACD value and Divergence arrows but not MACD Signal as it is not considered relevant to detect this kind of Classic Divergences. In some computer/VPS with old microprocessors or low RAM size, when you launch this Indicator (attach it, change
Skynet Lasso
Roman Yablonskiy
This indicator displays entry and exit points in the market. The indicator is based on Parabolic and various mathematical and statistical methods to increase profitability and reduce the number of losing trades. The indicator helps in many cases to skip false inputs, the support and resistance lines go around the price in a certain mode, reducing losses. The dashboard shows the results of the indicator so that you can adjust it more accurately and see how the parameters affect the result. The
GeoWprPro
Georgij Komarov
WPR by Profile, or WPR for Professionals Geo_WprPro is one of the well-known currency profile indicators. It simultaneously displays two WPR indicators with different parameters in the matrix form on all timeframes of multiple currency pairs forming the currency profile . As follows from the description, " WPR is a leading indicator that often goes ahead of the price chart. The oscillator frequently reaches extreme values before the price reversal as if anticipating that event: it almost always
A top-quality from the famous XSuper Trend indicator. It is completely loyal to the original algorithm, and implements many useful features Which includes Trend Indicators as Filters like MACD,CCI and Alligator. The Chefs Super Trend Plus Indicator is a great way to identify the current market trend. The indicator shows a clear distinction between uptrends and downtrends. The indicators has optional filters for sound signal. Suitable for the following trending pairs: EUR/USD, GBP/USD, USD/JPY,
移動平均線クロス、ボリンジャーと移動平均線のクロス、移動平均線の角度でサイン表示 MT5インジケータ こちらに サイト とがあります。 このインジケータは3つのパターンでサインを表示(切り替え可能)します。 ①   移動平均線のクロス ②   ボリンジャーバンドと短期移動平均線とのクロス ③   ボリンジャーバンドと短期移動平均線とのクロスと、中期移動平均線と長期移動平均線の角度 移動平均線のクロス 指定した短期移動平均線と長期移動平均線のゴールデンクロスでは買いサイン、デットクロスでは売りサインを表示します。 ディフォルトでは短期は5,長期は20となっています。 もちろん変更可能になります。 移動平均線の種類をEMA(指数平滑移動平均線)やSMMA(平滑化移動平均)などに変更可能で適する価格も変更可能になります。 ボリンジャーバンドと短期移動平均線のクロス ボリンジャーバンド(以降BB)と短期移動平均線のクロスでサインを表示します。 ディフォルトではBB+1σと5MAのゴールデンクロスで買いサイン、BB-1σと5MAのデットクロスで売りサインでサインを表示します。 BBの期間や
DigiGrid EA
Sergey Belov
5 (3)
The Expert Advisor builds a grid of orders at prices near support or resistance levels. Entry points are calculated by the EA using the author's algorithm and based on a variety of factors. The EA uses several time ranges for analysis. The built-in trend filter allows to make more accurate entries with a greater likelihood of closing them with profit and thus reducing the number of simultaneously open orders. All orders are closed upon reaching the expected profit. Through the use of TakeProfit
SystemBinaryM1
Andrey Spiridonov
SystemBinaryM1 - a professional indicator for trading short-term binary options, is a complete, self-contained author's strategy for working in the binary options market. The unique algorithm for analyzing the foreign exchange market is based on the calculation of reference points on three different time periods M15, M5. M1. Thus, the indicator simultaneously analyzes the long-term, medium-term and short-term price behavior before issuing a signal. The indicator is set in the usual way and work
GMMA Trade X is an EA based on GMMA. GMMA parameters such as MovingAveragePeriod1-24, MovingAverageMAShift1-24, MovingAverageShift1-24 and CandlestickShift1-24 can be adjusted. GMMA Trade X applies BTN TECHNOLOGY's state-of-the-art intelligent technology to help you create optimal results for your trades. May your dreams come true through GMMA Trade X. Good luck. = == == Inquiries = == == E-Mail:support@btntechfx.com
Diamond Trend
Segundo Calvo Munoz
Indicator which identifies Trend and also buy/sell opportunities. Use for entries aligned to the Trend.  Although Diamond Trend is very accurate identifying entry points, it is always recommended to use a support indicator in order to reconfirm the operation. Remind to look for those Assets and Timeframes which best fit to your trader behavior/need... Valid for Scalping and Long Term operations. Please, set up a Bars Chart to be able to visualize the indicator properly...  ...And remind to give
This system never paints.   This system created by using Envolpes bands and reverse bar count.   This indicator is only working in M5 period.   This system is for long term and profitable.   Signals are shown as arrows. as an optional limit orders.   You can set a voice alarm or email notification.   You can fins our other products from link : https://www.mql5.com/en/users/drbastem/seller   Also, you can ask all your questins from email : haskayafx@gmail.com or mobile : +90 530 867 5076 or @Meh
MACDivergence MTF
Pavel Zamoshnikov
4.29 (7)
Advanced ideas of the popular MACD indicator: It detects and displays classic and reverse divergences (three methods of detecting divergences). It uses different color to highlight an uptrend and a downtrend. Two methods of determining a trend: а) MACD crosses the 0 level (classic signal); б) MACD crosses its own average (early signal). This is a multi-timeframe indicator: it can display MACD data from other timeframes. Two methods of drawing: classic histogram and line. It generates sound and v
AI Concept
Shamary A Guy
The AI Concept EA is a 100% hands free Auto Trader that is designed to trade and maximize your financial status, it's also designed to a certain trading behavior by which profits will always be stabled throughout your trading journey . This EA use Martingale Strategy but in the very safe and effective way of multiplying Lots to your balance. This AI Expert Advisor search for a particular price action behavior that investors haven't come across as yet, in other words this EA searches for secret d
DSS Candles AM
Andriy Matviyevs'kyy
This indicator displays  DSS Bressert AM  signals on the price chart. The calculation of DSS Bressert values is similar to the stochastic indicator. The confirmation of the indicator's signal is the overcoming by the price of the high/low of the bar on which the signal was given by the indicator. Settings: Price - the price at which the indicator is calculated; EMA_Period - smoothing period; Stoch_Period - oscillator period; OB_Level - overbought level; OS_Level - oversold level;
Japanese Candlesticks Monitor scans Japanese candlesticks. It shows a vertical line and a name of a probable candlestick pattern. The indicator is constantly updated, and new patterns are added. Your feedback is most welcome. I have just started working on the indicator, and your opinions are highly appreciated . The indicator does not work on history data . If the indicator has not been launched at a candle opening, that candle is not considered. This means that the indicator works in real time
Are you tired of channeling? This indicator is designed to draw channels. Triple graphics channels, automatically installs 3 different graphics channels. These channels are shown on a single graphic. These channels are calculated by a number of different algorithms. Automatically draws on the screen. You can select three time zones. Parameters Period1 - from here you can select the first period. It can be selected from 1 minute time period to monthly time period. Period1_Channel_Color - period
Oscillator helps determine the direction of the market Shows the direction of the price movement and is painted in the appropriate color. Allows you to conduct trend and counter trend trading It works on all timeframes, on any currency pairs, metals and cryptocurrency Can be used when working with binary options Distinctive features Does not redraw; Simple and clear settings; It works on all timeframes and on all symbols; Suitable for trading currencies, metals, options and cryptocurrency (Bitco
FREE
AMS Scalper
Aleksandr Makarov
AMS Scalper An excellent indicator for the entry point into the market; we use indicator signals only according to the trend. Settings: Range - 50 (range size for signal search.) Maximum candles Back - 3 (after how many candles to set a signal) P.S. For the signal to appear on the zero candle, set 0. We recommend a trend indicator -  Trend Arrow Super Still have questions? do you need help?, I'm always happy to help, write to me in private messages or In telegram
Multi Divergence Indicator for MT4 - User Guide Introduction Overview of the Multi Divergence Indicator and its capabilities in identifying divergences across multiple indicators. Importance of divergence detection in enhancing trading strategies and decision-making. List of Indicators RSI CCI MACD STOCHASTIC AWSOME MFI ACCELERATOR OSMA MOMENTUM WPR( Williams %R) RVI Indicator Features Indicator Selection: How to enable/disable specific indicators (RSI, CCI, MACD, etc.) for divergence detection.
Professional forex expert   Black Angel   (for EURUSD, GBPUSD pairs) alyzing the market using the Elliot Wave Index. Elliott wave theory is the interpretation of processes in financial markets through a system of visual models (waves) on price charts. The author of the theory, Ralph Elliott, identified eight variants of alternating waves (of which five are in the trend and three are against the trend). The movement of prices in the markets takes the form of five waves. Three of them (1, 3, 5)
Distinctive
Tatiana Savkevych
Distinctive is a forex trending arrow indicator for identifying potential entry points. I like it, first of all, because it has a simple mechanism of work, adaptation to all time periods and trading tactics. Created on the basis of a regression channel with filters. Plotting the Lawrence indicator signals on a price function chart using a mathematical approach. How it works - when the price breaks out in the overbought / oversold zone (channel levels), a buy or sell signal is generated. Every
SmartStrategy
Pavel Krysanov
The Smart Strategy Indicator is a trading system that allows you to analyze the market in terms of several aspects of technical analysis. The first of them is a price channel, which is built automatically and allows the trader to see the main direction of price movement. It also makes it possible to analyze the market using a channel strategy (breakout and rebound from channel lines). Block 2 is the SAR system, which gives general information about the micro-movements in the market and this i
Profit XHunter
Hafis Mohamed Yacine
Many traders, especially the beginners, get tired of manual trading and start using robots. Of course, advertising plays a significant role in choosing the algorithm. Often, system and EA vendors hide information about their product until the customer buys it. Profit Hunter EA is no exception, so in our review we will try to find out whether this robot is efficient or you should better search for its counterparts. Profit Hunter EA  A variation of the "martingale" technique used in the EA is
RenkoMaStoch
Sergey Deev
1 (1)
The indicator displays renko bars on a chart, uses them to plot the fast and slow moving average and Stochastic, as well as it provides buy/sell signals: a buy signal is generated when the fast moving is above the slow one, and the signal line of Stochastic crosses the lower level from bottom up; a sell signal is generated when the fast moving is below the slow one, and the signal line of Stochastic crosses the upper level from top to bottom; Renko is a non-trivial price display method. Instead
RTSPattern
Tomas Belak
The indicator provides a superior alternative to price action analysis. It enables the identification of normalized patterns, which are then transformed into a graphical representation to forecast future steps within a time series. In the top-left corner, you'll find information regarding the expected prediction accuracy, determined through a complex MSQE calculation. You have the flexibility to adjust the time window, making it easy to validate the indicator's performance. Additionally, you can
Monkey EA
Vojtech Svobodnik
Monkey EA is fully automatic Expert Advisor for trading on GBPUSD . It based on Exponential Moving Average and Bollinger Bands. Monkey EA has been tested from year 2003 to March 2021 . You can download the demo and test it yourself. My test used the real tick data with 99,90% accuracy. I made Monte Carlo test with 200 simulations used too. Monkey EA offers hight profit factor  and small drawndown . All trades are covers by TakeProfit  and StopLoss ! Doesn't use Martingale or other dangerous star
이 제품의 구매자들이 또한 구매함
Gann Made Easy
Oleg Rodin
4.96 (45)
Gann Made Easy 는 mr.의 이론을 사용하여 최고의 거래 원칙을 기반으로 하는 전문적이고 사용하기 쉬운 Forex 거래 시스템입니다. W.D. 간. 이 표시기는 Stop Loss 및 Take Profit Levels를 포함하여 정확한 BUY 및 SELL 신호를 제공합니다. PUSH 알림을 사용하여 이동 중에도 거래할 수 있습니다. 구매 후 연락주세요! 내 거래 팁과 훌륭한 보너스 지표를 무료로 공유하겠습니다! 아마도 Gann 거래 방법에 대해 이미 여러 번 들었을 것입니다. 일반적으로 Gann의 이론은 초보자 거래자뿐만 아니라 이미 거래 경험이 있는 사람들에게도 매우 복잡한 것입니다. Gann의 거래 방식은 이론적으로 적용하기 쉽지 않기 때문입니다. 나는 그 지식을 연마하고 Forex 지표에 최고의 원칙을 적용하기 위해 몇 년을 보냈습니다. 표시기는 적용하기가 매우 쉽습니다. 차트에 첨부하고 간단한 거래 권장 사항을 따르기만 하면 됩니다. 지표는 지속적으로 시장 분석 작업
Atomic Analyst
Issam Kassas
5 (1)
우선적으로 언급할 점은이 거래 지표가 다시 그리지 않고 지연되지 않으며 이를 통해 수동 및 로봇 거래 모두에 이상적이라는 점입니다. Atomic Analyst는 가격의 강도와 모멘텀을 활용하여 시장에서 더 나은 이점을 찾는 PA Price Action Indicator입니다. 고급 필터를 장착하여 잡음과 거짓 신호를 제거하고 거래 잠재력을 높이는 데 도움이 됩니다. 복잡한 지표의 다중 레이어를 사용하여 Atomic Analyst는 차트를 스캔하고 복잡한 수학적 계산을 간단한 신호와 색상으로 변환하여 초보 트레이더가 이해하고 일관된 거래 결정을 내릴 수 있도록합니다. "Atomic Analyst"는 새로운 및 경험이 풍부한 트레이더를위한 종합적인 거래 솔루션입니다. 프리미엄 지표와 최고 수준의 기능을 하나의 거래 전략에 결합하여 모든 종류의 트레이더에 대한 다재다능한 선택지가되었습니다. 인트라데이 거래 및 스캘핑 전략 : 빠르고 정확한 일일 거래 및 단기 거래를 위해 설계
TPSproTREND PrO
Roman Podpora
5 (15)
TPSpro TRENDPRO  - is a trend indicator that automatically analyzes the market and provides information about the trend and each of its changes, as well as giving signals for entering trades without redrawing! The indicator uses each candle, analyzing them separately. referring to different impulses - up or down impulse. Exact entry points into transactions for currencies, crypto, metals, stocks, indices!  -  Version MT5               DETAILED DESCRIPTION        /       TRADING SETUPS           
Quantum Trend Sniper Indicator MT4
Bogdan Ion Puscasu
4.59 (39)
소개       Quantum Trend Sniper Indicator는   추세 반전을 식별하고 거래하는 방식을 변화시키는 획기적인 MQL5 지표입니다! 13년 이상의 거래 경험을 가진 숙련된 트레이더 팀이 개발한       Quantum Trend Sniper 표시기       매우 높은 정확도로 추세 반전을 식별하는 혁신적인 방법으로 거래 여정을 새로운 차원으로 끌어올리도록 설계되었습니다. ***Quantum Trend Sniper Indicator를 구입하면 Quantum Breakout Indicator를 무료로 받을 수 있습니다!*** Quantum Trend Sniper Indicator는 추세 반전을 식별하고 세 가지 이익실현 수준을 제안할 때 경고, 신호 화살표를 제공합니다. 초보자 거래자와 전문 거래자 모두에게 적합합니다. Quantum EA 채널:       여기를 클릭하세요 MT5 버전:       여기를 클릭하세요
Trend Screener
STE S.S.COMPANY
4.83 (86)
트렌드 표시기, 트렌드 트레이딩 및 필터링을 위한 획기적인 고유 솔루션, 하나의 도구 안에 내장된 모든 중요한 트렌드 기능! Forex, 상품, 암호 화폐, 지수 및 주식과 같은 모든 기호/도구에 사용할 수 있는 100% 다시 칠하지 않는 다중 시간 프레임 및 다중 통화 표시기입니다. Trend Screener는 차트에 점이 있는 화살표 추세 신호를 제공하는 효율적인 지표 추세 추종 지표입니다. 추세 분석기 표시기에서 사용할 수 있는 기능: 1. 트렌드 스캐너. 2. 최대 이익 분석이 있는 추세선. 3. 추세 통화 강도 측정기. 4. 경고가 있는 추세 반전 점. 5. 경고가 있는 강력한 추세 점. 6. 추세 화살표 Trend Screener Indicator가 있는 일일 분석 예, 일일 신호 성능...등은 여기에서 찾을 수 있습니다.   여기를 클릭하십시오. LIMITED TIME OFFER : Trend Screener Indicator는 50 $ 및 평생 동안만 사용할 수 있
Scalper Vault
Oleg Rodin
5 (27)
Scalper Vault 는 성공적인 스캘핑에 필요한 모든 것을 제공하는 전문 스캘핑 시스템입니다. 이 표시기는 외환 및 바이너리 옵션 거래자가 사용할 수 있는 완전한 거래 시스템입니다. 권장 시간 프레임은 M5입니다. 시스템은 추세 방향으로 정확한 화살표 신호를 제공합니다. 또한 상단 및 하단 신호와 Gann 시장 수준을 제공합니다.  이 시스템은 사용하기가 매우 쉽습니다. 원하는 시장 지역의 화살표만 따라가면 됩니다. 엑시트는 가격이 적정 수준에 도달하거나 시장의 고점 또는 저점 신호가 나타날 때 수행됩니다.  표시기는 PUSH 알림을 포함한 모든 유형의 경고를 제공합니다. 인디케이터 구매 후 연락주세요. 내 개인 거래 권장 사항과 훌륭한 보너스 지표를 무료로 공유합니다! 나는 당신에게 행복하고 유익한 거래를 기원합니다!
TPSpro RFI Levels
Roman Podpora
5 (13)
A key element in trading is zones or levels from which decisions to buy or sell a trading instrument are made. Despite attempts by major players to conceal their presence in the market, they inevitably leave traces. Our task was to learn how to identify these traces and interpret them correctly. Reversal First Impulse levels (RFI)   -  Version MT5                INSTRUCTIONS                 RUS                 ENG                                       R ecommended to use with an indicator   -  
Advanced Currency Strength28 Indicator
Bernhard Schweigert
4.9 (662)
현재 26% 할인 초보자 또는 전문가 트레이더를 위한 최고의 솔루션! 이 지표는 우리가 독점 기능과 새로운 공식을 통합했기 때문에 독특하고 고품질이며 저렴한 거래 도구입니다. 단 하나의 차트로 28 Forex 쌍의 통화 강도를 읽을 수 있습니다! 새로운 추세 또는 스캘핑 기회의 정확한 트리거 포인트를 정확히 찾아낼 수 있기 때문에 거래가 어떻게 개선될지 상상해 보십시오. 사용 설명서: 여기를 클릭  https://www.mql5.com/en/blogs/post/697384 그것이 첫 번째, 원본입니다! 쓸모없는 지망생 클론을 사지 마십시오. 더 스페셜  강력한 통화 모멘텀을 보여주는 하위 창의 화살표 GAP가 거래를 안내합니다! 기본 또는 호가 통화가 과매도/과매도 영역(외부 시장 피보나치 수준)에 있을 때 개별 차트의 기본 창에 경고 표시가 나타납니다. 통화 강도가 외부 범위에서 떨어질 때 풀백/반전 경고. 교차 패턴의 특별 경고 추세를 빠르게 볼 수 있는
우선적으로, 이 거래 도구는 전문적인 거래에 이상적인 비-다시 그리기 및 지연되지 않는 지표입니다.  스마트 가격 액션 컨셉트 인디케이터는 신규 및 경험 많은 트레이더 모두에게 매우 강력한 도구입니다. Inner Circle Trader Analysis 및 Smart Money Concepts Trading Strategies와 같은 고급 거래 아이디어를 결합하여 20가지 이상의 유용한 지표를 하나로 결합합니다. 이 인디케이터는 스마트 머니 컨셉트에 중점을 두어 대형 기관의 거래 방식을 제공하고 이동을 예측하는 데 도움을 줍니다.  특히 유동성 분석에 뛰어나 기관이 어떻게 거래하는지 이해하는 데 도움을 줍니다. 시장 트렌드를 예측하고 가격 변동을 신중하게 분석하는 데 탁월합니다. 귀하의 거래를 기관 전략에 맞추어 시장의 동향에 대해 더 정확한 예측을 할 수 있습니다. 이 인디케이터는 시장 구조를 분석하고 중요한 주문 블록을 식별하고 다양한 패턴을 인식하는 데 뛰어납니다. 
현재 20% 할인 ! 초보자 또는 전문가 트레이더를 위한 최고의 솔루션! 이 대시보드 소프트웨어는 28개의 통화 쌍에서 작동합니다. 2가지 주요 지표(Advanced Currency Strength 28 및 Advanced Currency Impulse)를 기반으로 합니다. 전체 Forex 시장에 대한 훌륭한 개요를 제공합니다. 고급 통화 강도 값, 통화 이동 속도 및 모든(9) 시간대의 28 Forex 쌍에 대한 신호를 보여줍니다. 추세 및/또는 스캘핑 기회를 정확히 파악하기 위해 차트의 단일 지표를 사용하여 전체 시장을 볼 수 있을 때 거래가 어떻게 개선될지 상상해 보십시오! 잠재적인 거래를 식별하고 확인하면서 강력한 통화와 약한 통화를 더욱 쉽게 식별할 수 있도록 이 지표에 기능을 내장했습니다. 이 표시기는 통화의 강세 또는 약세가 증가 또는 감소하는지 여부와 모든 시간대에서 수행되는 방식을 그래픽으로 보여줍니다. 추가된 새로운 기능은 현재 시장 조건 변화에 적
Advanced Supply Demand
Bernhard Schweigert
4.92 (310)
현재 33% 할인! 초보자나 전문 트레이더를 위한 최고의 솔루션! 이 보조지표는 우리가 다수의 독창적 기능과 새로운 공식을 통합한 독특하고 고품질이며 저렴한 거래 도구입니다. 이 업데이트를 통해 이중 시간대를 표시할 수 있습니다. 더 높은 TF를 표시할 수 있을 뿐만 아니라 차트 TF와 더 높은 TF 모두를 표시할 수 있습니다: 중첩 영역 표시. 모든 Supply Demand 트레이더들이 좋아할 것입니다. :) 중요한 정보 공개 Advanced Supply Demand의 잠재력을 극대화하려면 다음을 방문하십시오. https://www.mql5.com/ko/blogs/post/720245   진입 또는 목표의 명확한 트리거 포인트를 정확히 찾아냄으로 해서 거래가 어떻게 개선될지 상상해 보십시오. 새로운 알고리즘을 기반으로 매수자와 매도자 간의 잠재적인 불균형을 훨씬 더 쉽게 분간할 수 있습니다. 왜냐하면 가장 강한 공급영역과 가장 강한 수요 영역과 과거에 어떻게 진행 되었는지를(이
TrendMaestro
Stefano Frisetti
5 (2)
note: this indicator is for METATRADER4, if you want the version for METATRADER5 this is the link: TRENDMAESTRO recognizes a new TREND in the bud, he never makes mistakes. The certainty of identifying a new TREND is priceless. DESCRIPTION TRENDMAESTRO identifies a new TREND in the bud, this indicator examines the volatility, volumes and momentum to identify the moment in which there is an explosion of one or more of these data and therefore the moment in which prices have strong probability of f
기적적인 외환 지표 소개: 정확한 트레이딩의 힘을 발휘하세요 모든 시간대에서 뛰어난 결과를 제공하는 최고의 외환 지표를 찾는데 지친 적이 있나요? 더 이상 찾을 필요가 없습니다! 기적적인 외환 지표가 도래하여 귀하의 트레이딩 경험을 혁신하고 수익을 새로운 고도로 끌어올립니다. 최첨단 기술과 수년간의 정성스런 개발을 토대로 기적적인 외환 지표는 외환 시장에서의 힘과 정확성의 정점으로 떠오릅니다. 이 탁월한 도구는 모든 수준의 트레이더의 요구를 충족시키고 지속적인 수익을 추구하는 데에서 비길 데 없는 우위를 제공하기 위해 설계되었습니다. 기적적인 외환 지표의 가장 큰 장점은 그 뛰어난 적응성에 있습니다. 당신이 데이 트레이더, 스윙 트레이더이든 장기 포지션을 선호하든, 이 지표는 모든 시간대에서 뛰어난 결과를 제공하기 위해 최적화되었습니다. 그러나 그 정확성과 시장의 복잡한 움직임을 포착하는 능력이 참으로 빛을 발하는 것은 1시간 기간대에서 사용할 때입니다. 기적적인 외환 지표의 정확성
Market Reversal Alerts
LEE SAMSON
4.21 (121)
가격이 역전되고 후퇴함에 따라 시장 구조가 변경됩니다. 시장 구조 반전 경고 표시기는 추세 또는 가격 움직임이 고갈에 가까워지고 반전할 준비가 되었음을 식별합니다. 일반적으로 반전이나 큰 하락이 일어나려고 할 때 발생하는 시장 구조의 변화를 알려줍니다. 지표는 가능한 고갈 지점 근처에서 새로운 고점 또는 저점이 형성될 때마다 초기에 돌파와 가격 모멘텀을 식별합니다. 표시기는 반대쪽에 있는 마지막 촛불에 직사각형을 그립니다. 그런 다음 현재의 단기 추세에서 계속 움직이기 때문에 가격과 함께 직사각형을 따라갈 것입니다. 가격이 사각형 위나 아래로 다시 닫힐 정도로 약해지면 시장 구조에 잠재적인 변화가 일어나고 있음을 나타냅니다. 그런 다음 표시기는 방향의 잠재적인 이동과 추세 또는 주요 하락의 가능한 반전 시작에 대해 경고합니다. 작동 방식을 보려면 아래의 작동 표시기를 참조하십시오! 여기에서 모든 쌍 및 기간을 모니터링하기 위한 선택적 대시보드 추가 기능: https://
FX Power MT4 NG
Daniel Stein
5 (8)
모닝 브리핑 여기 mql5 와 텔레그램에서 FX Power MT4 NG 는 오랫동안 인기 있는 통화 강도 측정기인 FX Power의 차세대 버전입니다. 이 차세대 강도 측정기는 무엇을 제공합니까? 기존 FX Power에서 좋아했던 모든 것 PLUS GOLD/XAU 강도 분석 더욱 정밀한 계산 결과 개별 구성 가능한 분석 기간 더 나은 성능을 위한 사용자 정의 가능한 계산 한도 특별 멀티더 많은 것을보고 싶은 사람들을위한 특별한 다중 인스턴스 설정 모든 차트에서 좋아하는 색상을위한 끝없는 그래픽 설정 수많은 알림 옵션, 중요한 것을 다시는 놓치지 않도록 Windows 11 및 macOS 스타일의 둥근 모서리가 있는 새로운 디자인 마법처럼 움직이는 인디케이터 패널 FX 파워 키 특징 모든 주요 통화의 완전한 강세 이력 모든 시간대에 걸친 통화 강세 이력 모든 브로커 및 차트에서 고유 계산 결과 100% 신뢰할 수있는 실시간100 % 신뢰할 수있는 실시간 계산-> 다시 칠하지 않음
맞춤형 MT4 지표로 성공적인 외환 거래에 대한 비밀을 발견하십시오! 외환 시장에서 성공을 달성하고 위험을 최소화하면서 일관되게 이익을 얻는 방법을 궁금해 한 적이 있습니까? 여기에 당신이 찾고 있던 답이 있습니다! 거래에 대한 귀하의 접근 방식을 혁신 할 독점적 MT4 지표를 소개 할 수 있습니다. 독특한 다양성 우리의 지표는 Renko 및 Rangebar Candle Formations를 선호하는 사용자를 위해 특별히 설계되었습니다. 우리는 이러한 차트 유형이 많은 숙련 된 거래자들이 선호한다는 것을 이해하기 때문에 우리의 지표가 그들과 완벽하게 통합되어 비교할 수없는 시장 분석을 제공합니다. 명확한 추세 신호 복잡한 분석을 잊어 버리십시오! 우리의 지표는 생생한 색상과 명확한 점 구조를 사용하여 시장 동향을 명확하게 나타냅니다. 빨간색과 파란색 점은 가격 이동 방향에 대해 의심의 여지가 없어 거래에서 빠른 의사 결정을 할 수 있습니다. HH/HL HL/LL
Entry Points Pro
Yury Orlov
4.7 (224)
다시 색을 칠하지 않고 거래에 진입할 수 있는 정확한 신호를 제공하는 MT4용 지표입니다. 외환, 암호화폐, 금속, 주식, 지수 등 모든 금융 자산에 적용할 수 있습니다. 매우 정확한 추정값을 제공하고 매수와 매도의 가장 좋은 시점을 알려줍니다. 하나의 시그널로 수익을 내는 지표의 예와 함께 비디오 (6:22)시청하십시오! 대부분의 거래자는 Entry Points Pro 지표의 도움으로 첫 거래 주 동안 트레이딩 결과를 개선합니다. 저희의   Telegram Group 을 구독하세요! Entry Points Pro 지표의 좋은점. 재도색이 없는 진입 신호 신호가 나타나고 확인되면(시그널 캔들이 완성된 경우) 신호는 더 이상 사라지지 않습니다. 여타 보조지표의 경우 신호를 표시한 다음 제거되기 때문에 큰 재정적 손실로 이어집니다. 오류 없는 거래 게시 알고리즘을 통해 트레이드(진입 또는 청산)를 할 이상적인 순간을 찾을 수 있으며, 이를 통해 이를 사용하는 모든 거래자의
Quantum Breakout Indicator PRO
Bogdan Ion Puscasu
4.96 (26)
소개       Quantum Breakout PRO   , 브레이크아웃 존 거래 방식을 변화시키는 획기적인 MQL5 지표! 13년 이상의 거래 경험을 가진 숙련된 트레이더 팀이 개발한   Quantum Breakout PRO는   혁신적이고 역동적인 브레이크아웃 영역 전략으로 거래 여정을 새로운 차원으로 끌어올리도록 설계되었습니다. Quantum Breakout Indicator는 5개의 이익 목표 영역이 있는 브레이크아웃 영역의 신호 화살표와 브레이크아웃 상자를 기반으로 한 손절 제안을 제공합니다. 초보자 거래자와 전문 거래자 모두에게 적합합니다. Quantum EA 채널:       여기를 클릭하세요 MT5 버전 :   여기를 클릭하세요 중요한! 구매 후 설치 매뉴얼을 받으려면 개인 메시지를 보내주십시오. 추천: 기간: M15 통화쌍: GBPJPY, EURJPY, USDJPY,NZDUSD, XAUUSD 계정 유형: 스프레드가 매우 낮은 ECN, Ra
Currency Strength Wizard
Oleg Rodin
4.91 (44)
통화 강도 마법사는 성공적인 거래를 위한 올인원 솔루션을 제공하는 매우 강력한 지표입니다. 표시기는 여러 시간 프레임의 모든 통화 데이터를 사용하여 이 또는 해당 외환 쌍의 힘을 계산합니다. 이 데이터는 특정 통화의 힘을 확인하는 데 사용할 수 있는 사용하기 쉬운 통화 지수 및 통화 전력선의 형태로 표시됩니다. 필요한 것은 거래하려는 차트에 표시기를 부착하는 것뿐입니다. 표시기는 거래하는 통화의 실제 강세를 보여줍니다. 지표는 또한 추세와 거래할 때 유리하게 사용할 수 있는 구매 및 판매 거래량 압력의 극한값을 보여줍니다. 지표는 또한 피보나치에 기반한 가능한 대상을 보여줍니다. 표시기는 PUSH 알림을 포함한 모든 유형의 알림을 제공합니다. 구매 후 연락주세요. 나는 당신과 거래 팁을 공유하고 당신에게 무료로 훌륭한 보너스 지표를 줄 것입니다! 나는 당신에게 행복하고 유익한 거래를 기원합니다!
Trend Forecasting
Mohamed Hassan
5 (15)
This indicator is unstoppable when combined with our other indicator called Katana. After purchase, send us a message and you could get Katana for FREE as a BONUS After purchase, send us a private message for your instructions.  MT5 version: click here There are limited copies available at $45. Next price is $99. Don't miss this great deal!  The Trend Forecasting indicator is a very unique & easy tool that is able to make prediction about future price movement based on the signals
EasyTrade Indicator
Gabor Bocsak
5 (5)
다중 통화 및 다중 시간대 매수 및 매도 알림. 자동 추적 중지 및 위험 보상 이익 실현! 지표는 시장을 스캔하고 분석하므로 귀하가 할 일이 없습니다! 하나의 차트에서 모든 통화를 거래하세요!   구매 후 댓글 남겨주시면 연락드리겠습니다. 무역도우미 EA를 보내드리겠습니다. 표시기는 여러 오실레이터와 부착된 필터를 사용하여 최상의 확인 진입점을 찾으므로 걱정할 필요가 없습니다! 이는 귀하에게 경고하고 귀하가 시청하기로 선택한 모든 기간과 통화에 대한 버튼을 그립니다. 버튼을 누르면 차트로 이동하여 거래를 시작할 수 있습니다! 이 표시기는 또한 모든 기본 및 시장 감시 통화에 대한 강도 패널을 그립니다(설정에서 조정 가능). 그러면 모든 통화 쌍과 선택한 더 높은 기간의 통화가 표시됩니다. 표시기 창에는 추세 필터가 포함된 특수 MACD 히스토그램과 차트 통화에 대한 다중 기간 추세 패널이 있습니다! 모든 통화와 시간대에 대한 거래 알림을 제공하며 버튼을 누르면
Scalper Inside PRO
Alexey Minkov
4.75 (55)
SALE NOW! Limited Time Offer! An exclusive indicator that utilizes an innovative algorithm to swiftly and accurately determine the market trend. The indicator automatically calculates opening, closing, and profit levels, providing detailed trading statistics. With these features, you can choose the most appropriate trading instrument for the current market conditions. Additionally, you can easily integrate your own arrow indicators into Scalper Inside Pro to quickly evaluate their statistics and
FX Volume
Daniel Stein
4.6 (35)
모닝 브리핑을 통해 세부 정보와 스크린샷으로 매일 시장 업데이트를 받으세요 여기 mql5 및 텔레그램에서 FX 거래량은 브로커의 관점에서 시장 심리에 대한 실제 통찰력을 제공하는 최초이자 유일한 거래량 지표입니다. 브로커와 같은 기관 시장 참여자가 외환 시장에서 어떤 포지션을 취하고 있는지에 대한 훌륭한 통찰력을 COT 보고서보다 훨씬 빠르게 제공합니다. 차트에서 이 정보를 직접 확인하는 것은 트레이딩의 진정한 판도를 바꾸고 획기적인 솔루션입니다. 다음과 같은 고유한 시장 데이터 인사이트의 이점 비율 는 통화의 매수/매도 포지션 비율을 백분율로 표시 비율 변화 는 선택한 기간 내 매수 비율과 비율 변화를 표시 총 거래량 는 해당 통화의 총 거래량(롱 및 숏)을 로트 단위로 보여줍니다 Volumes Long 는 해당 통화의 모든 롱 포지션의 거래량을 보여줍니다 Volumes Short 는 해당 통화의 모든 숏 포지션의 거래량을 보여줍니다 Net Long 는 순 롱 포지션의 거래량
TrendDecoder Premium
Christophe, Pa Trouillas
5 (3)
범위 및 다음 가능한 움직임 식별   |  추세의 초기 신호와 강도를 확인하세요   |  반전 전 명확한 출구 확보   |  가격이 테스트 할 피보 레벨 파악 비추적, 비지연 지표 - 수동 및 자동 거래에 이상적 - 모든 자산 및 모든 시간 단위에 적합 기간 한정 혜택 >>   50% 할인 구매 후 이 채널로 문의 하여 권장 설정을 확인하세요. MT5   버전:   여기를 클릭하세요 BladeSCALPER   및   PowerZONES   로 전체 방법을 확인하세요. 어떤 서비스인가요? 트렌드디코더는 추세 모니터링을 간단하고 쉽게 하기 위한 여러 혁신 기술의 집약체입니다. 투영 추세선(투영 추세선) - 다가오는 추세의 속도 기준 실시간 추세선과 투영 추세선 비교 - 시장이 이전과 같은 방향으로 움직이고 있는지, 아니면 둔화되고 있는지? 실시간 추세선 교차 - 추세가 궤도를 이탈하고 있습니다. 그레이박스 - 시장이 더 이상 추세가 아니며 새로운 전환기에 들어섰습
Cycle Sniper
Elmira Memish
4.41 (34)
NEW YEAR SALE PRICE FOR LIMITED TIME!!! Please contact us after your purchase and we will send you the complimentary indicators to complete the system Cycle Sniper is not a holy grail but when you use it in a system which is explained in the videos, you will feel the difference. If you are not willing to focus on the charts designed with Cycle Sniper and other free tools we provide, we recommend not buying this indicator. We recommend watching the videos about the indiactor and system before pu
Shepherd Harmonic Pattern
Abdullah Alrai
4.68 (59)
이 지표는 수동 및 자동 방법으로 차트에 그려진 고조파 패턴을 감지합니다. 사용자 매뉴얼은 다음 링크에서 확인할 수 있습니다. 리뷰를 작성하고 문의하면 무료 버전으로 MT4에서 제품을 시도할 수 있습니다. Gartley 및 Nenstar 패턴을 감지하는 데 사용할 수 있습니다. https://www.mql5.com/en/market/product/30181 전체 MT4 버전을 구입하려면 다음에서 구입할 수 있습니다. https://www.mql5.com/en/market/product/15212 참고 사항 지표에는 제어 패널이 있으며 모든 (차트 및 시간대) 설정을 저장합니다. 차트에서 더 많은 공간을 확보하려면 최소화할 수 있으며, 다른 분석 도구로 작업하는 것이 선호되는 경우 모든 지표 데이터를 숨기려면 닫기 버튼을 누를 수 있습니다. 이 지표를 사용하고 설정을 변경하면 이동 평균 또는 볼린저 밴드와 같은 지표를 추가하면 자동으로 템플릿을 저장하고 필요할 때 언제든지 로드할 수
PRO Renko System
Oleg Rodin
5 (24)
PRO Renko System 은 RENKO 차트 거래를 위해 특별히 고안된 매우 정확한 거래 시스템입니다. 이것은 다양한 거래 상품에 적용될 수있는 보편적 인 시스템입니다. 체계는 효과적으로 당신에게 정확한 반전 신호에 접근을 주는 소위 시장 소음을 중화합니다. 이 표시기는 사용하기가 매우 쉽고 신호 생성을 담당하는 매개 변수가 하나만 있습니다. 당신은 쉽게 당신의 선택의 어떤 무역 계기에 공구를 적응시킬 수 있고 renko 막대기의 크기. 나는 항상 당신이 내 소프트웨어로 수익성있게 거래 할 수 있도록 추가 지원을 제공 할 준비가되어 있습니다! 나는 당신에게 행복하고 수익성있는 거래를 기원합니다! 구매 후 저에게 연락하십시오! 내 렌코 차트 생성기를 보내드립니다. 또한 내 개인 권장 사항 및 시스템의 다른 모듈을 무료로 공유 할 것입니다!
TakePropips Donchian Trend Pro
Eric John Pajarillaga Aldana
4.82 (17)
TakePropips Donchian Trend Pro   (MT4)는 Donchian 채널을 사용하여 추세의 방향을 자동으로 감지하고 진입 및 퇴장 거래 신호를 제공하는 강력하고 효과적인 도구입니다! 이 다기능 지표에는 추세 스캐너, 거래 신호, 통계 패널, 스크리너, 거래 세션 및 경고 내역 대시보드가 포함됩니다. 거래 신호를 제공하고 차트 분석 시간을 절약하도록 설계되었습니다! 다음 블로그 게시물에서 사용자 설명서 및 설치 가이드를 다운로드할 수 있습니다.   https://www.mql5.com/en/blogs/post/751368 오늘 50% 할인을 받으세요! 가격이 $98에서 $49로 인하되었습니다! 전략 테스터에서 이 지표를 테스트할 수 있습니다(비주얼 모드 활성화). 실시간 차트에서 테스트하고 싶다면 저에게 메시지를 보내 7일 평가판을 받을 수도 있습니다. 자세한 내용은 설명 아래에 비디오 자습서도 제공됩니다. 질문이 있거나 도움이 필요하면 저에게 연락하십시오.
UPD1 Volume BOX
Vitaliy Kuznetsov
5 (14)
표시기는 지정된 영역(BOX)의 수평 볼륨 프로파일과 최대 볼륨(POC)을 표시합니다. 제품 특징. 1. 틱 또는 가격만 사용할 수 있습니다. 2. 적응 그리드 간격(M1-MN). 3. 상자 크기에 따른 적응형 대용량(중앙값) 검색 단계. 4. 상자 라인과 버튼의 자동 카멜레온 색상. 5. 생성 및 삭제가 용이한 다중 상자. 6. 70% 볼륨 영역(설정에서 활성화됨). 7. 최대 수평 볼륨 라인(POC) 터치에 대한 경고가 있습니다. 8. VWAP. 9. 제어 패널. 볼륨 프로필 표시기로 시장을 탐색하십시오. 나는 그것을 위해 그것을 했지만 이제 당신도 사용할 수 있습니다. 주요 설정. Calc Histo Mode – 히스토그램 계산 방법 (Market Profile – 가격으로 계산, Tick Volume Profile – 틱으로 계산). Mode Step In Pips – 핍으로 중앙선 계산. Vertical Step – 히스토그램의 수직 단계(줄 사이의 거리(핍)).
The 1 2 3 Pattern Scanner
Reza Aghajanpour
4.78 (54)
** All Symbols x All Timeframes scan just by pressing scanner button ** After 15 years of experience in the markets and 3 years of programming, Winner indicator is ready. I would like to share with you! *** Contact me after purchase to send you instructions and add you in "123 scanner group" for sharing or seeing experiences with other users. Introduction The 123 Pattern Scanner indicator with a special enhanced algorithm is a very repetitive common pattern finder with a high success rate . Inte
제작자의 제품 더 보기
Daily Range
Dmitriy Falkov
The indicator highlights the affected period taking the highest and the lowest prices into account. It is possible to choose any time period from 1 hour to 24 hours. It also optionally shows the target levels when trading at the breakout of the range in any direction. The target level value is given in percentages of the width of the previous range. The indicator is the improvement and extension of the free version . It works on timeframes from M1 to H1. It warns at the higher timeframes. Sett
Night Range
Dmitriy Falkov
4 (3)
This is a simple indicator that draws a night range. The start and the end of a working day are specified in hours, color rectangles are adjusted as well. It helps to view the history in search for regularities , excluding unpredictable night time. It can be used to search for a breakthrough of the night range. It is drawn as a background , and does not cover a chart and other indicators .
FREE
Fibonacci Pivots
Dmitriy Falkov
The indicator presents reversal points by Fibo levels based on the previous day prices. The points are used as strong support/resistance levels in intraday trading, as well as target take profit levels. The applied levels are 100%, 61.8%, 50%, 38.2%, 23.6%. The settings allow you to specify the amount of past days for display, as well as line colors and types. Good luck!
The histogram of the difference between upper and lower levels of the Bollinger Bands. Growth of the histogram means the expansion of the range on a trend interval, reduction means the narrowing of the range during corrections. The histogram is colored: the bullish trend areas, the bearish trend areas and corrections areas are displayed with different colors. Like other trend indicators it gives clear signals, but with delay. There is additional information about the color changes (change or end
This is an irreplaceable assistant for manual trading providing maximum automation of daily routine calculations, convenient system of opening and maintaining trades and also their closure on reaching a specified adjustable level. The untility provides maximally clear and complete information on the current situation of each instrument separately and features the convenient trading panel as well as many additional functions in one program. The product works correctly with all instruments (Forex,
Fractal Overcome
Dmitriy Falkov
Indicator Description The indicator shows the breakout of the last fractal in real time. It considers the buy fractals above the balance line and sell fractals below the balance line (according to the Bill Williams' strategy), and also the fractals that are independent of the balance line. The direction and the distance of the fractal level breakout are displayed in real time. When a candle closes outside the suitable fractal, the levels of the specified offset, the distance to the candle closur
AO Patterns
Dmitriy Falkov
The indicator displays a formed pattern of the AO (Awesome Oscillator) indicator at the signal bar according to the "Profitunity" strategy by Bill Williams. The patterns differ in colors, location and number. The indicator can notify the user about the appearance of a new pattern. It is important to remember that you must not use the signals of the "АО" indicator until the appearance of the first buy/sell fractal outside the alligator mouth. Types and designation of the patterns Buy 1 - "Sauce
필터:
Natasha Diedericks
5715
Natasha Diedericks 2020.07.09 00:03 
 

사용자가 평가에 대한 코멘트를 남기지 않았습니다

Nesho Marinov
1351
Nesho Marinov 2015.12.01 12:31 
 

사용자가 평가에 대한 코멘트를 남기지 않았습니다

리뷰 답변
버전 2.1 2021.11.17
Compilator upgrade
버전 2.0 2016.05.23
Added ability to select the timeframe. Now it is possible to attach multiple indicators from different timeframes simultaneously.
It is possible to select the "current" period, it will be switched together with the chart period.
The period is displayed in the title in a convenient way.
버전 1.1 2016.05.13
Changed the name in the indicator window. Now the text is more compact.