VR Ticks MT5
- 지표
- Vladimir Pastushak
- 버전: 24.31
- 업데이트됨: 1 3월 2024
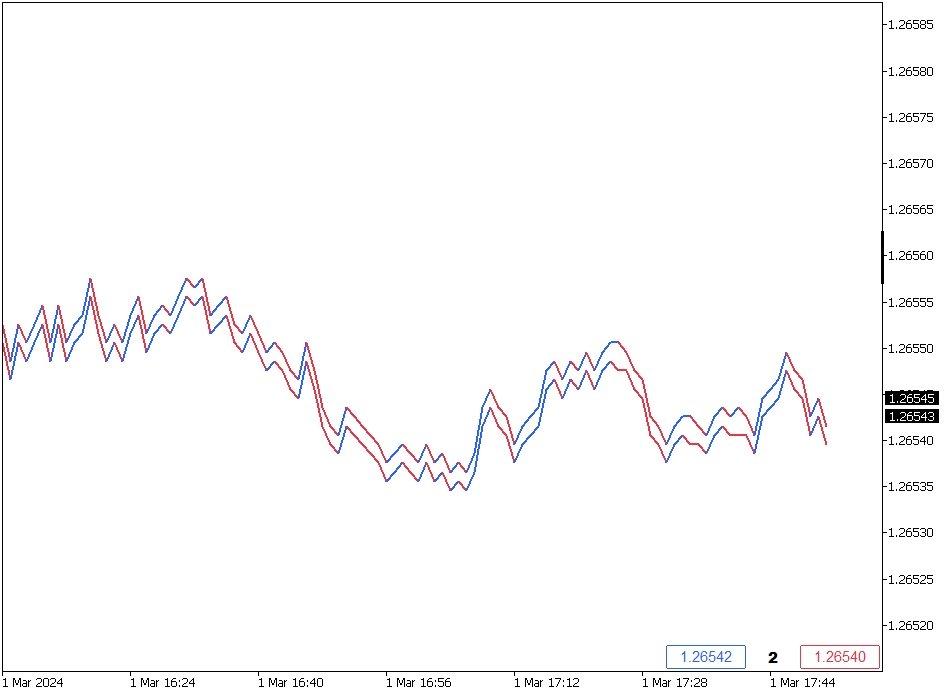
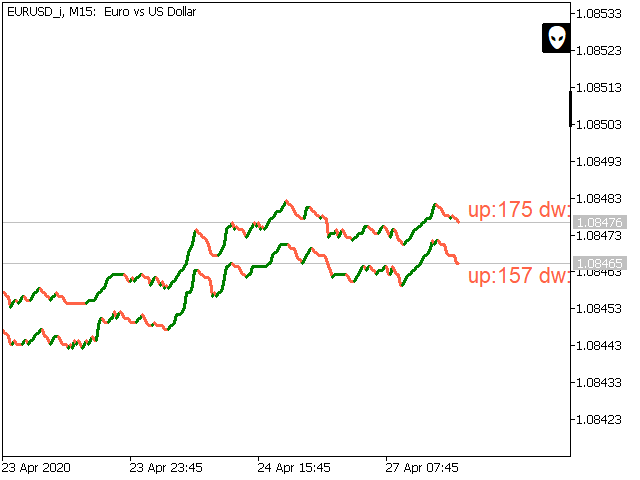
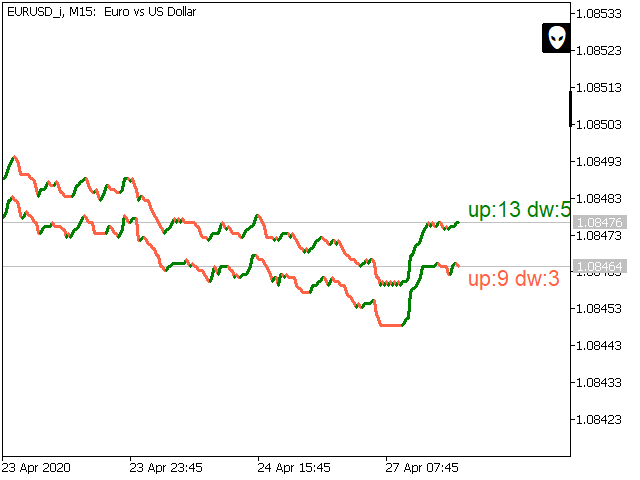
VR Ticks는 스캘핑 기반 전략에 대한 특별한 지표입니다. 이 지표 덕분에 거래자는 금융상품의 메인 차트에서 직접 틱 차트를 볼 수 있습니다. 틱 차트를 사용하면 가능한 한 정확하게 시장에 포지션을 입력하거나 시장에서 포지션을 청산할 수 있습니다. VR Ticks는 방향에 따라 색상이 변하는 선 형태로 진드기 데이터를 표시합니다. 이를 통해 진드기의 상황을 시각적으로 이해하고 평가할 수 있습니다. 틱 차트의 장점은 기간을 고려하지 않고 가격 변동을 기반으로 작성된다는 것입니다. VR Ticks는 가능한 가장 최소한의 차트를 구축합니다.
설정, 세트 파일, 데모 버전, 지침, 문제 해결 등은 [블로그] 에서 확인할 수 있습니다.
[링크] 에서 리뷰를 읽거나 작성할 수 있습니다.
[MetaTrader 4] 용 버전
틱은 하나의 가격 변동입니다. 한 번의 가격 변동에 대해 가격은 하나 또는 여러 포인트만큼 변경될 수 있습니다. 진드기가 움직임이라는 것을 이해하는 것이 중요합니다.
표시기는 오른쪽 하단에 매도 및 매수 가격과 현재 스프레드 값을 표시합니다. 틱별 표시기 틱의 프로그램 코드는 MetaTrader 창에 차트를 작성합니다. 지표 설정에 따라 차트의 성장 순간을 한 가지 색상으로 칠할 수 있고 가격 하락 순간을 다른 색상으로 칠할 수 있습니다. 이 접근 방식은 거래자가 현재 추세의 변화를 명확하게 볼 수 있도록 도와줍니다. 이 지표는 모든 가격 변동을 모니터링하고 차트에 모든 가격 변동을 표시합니다. 매도 가격이나 매수 가격에 변화가 없으면 표시기는 수평 차트를 만듭니다.
장점
- 스캘퍼 전략을 사용하여 거래할 때 효율성이 높아집니다.
- 안정적이고 최적화된 표시 코드는 컴퓨터 리소스를 많이 소모하지 않습니다.
- 틱 차트는 메인 차트와 함께 창에 표시될 수 있습니다.
- 틱 차트만 모니터링하도록 차트 창을 구성할 수 있습니다.
- 표시기는 MetaTrader 4와 MetaTrader 5에 맞게 설계되었으며 동일합니다.
- 초보자와 숙련된 트레이더의 거래에 적합합니다.
- 모든 금융 상품(Forex, Metalls, CFD, Futures, Crypto)에 대한 데이터를 표시할 수 있습니다.
VR Ticks settings
Indicator settings
- Count periods
- Delta Ask - Bid
Ask line settings
- Show Ask tick
- Color Ask tick Up
- Color Ask tick Down
- Width Ask tick
- Style Ask tick
Bid line settings
- Show Bid tick
- Color Bid tick Up
- Color Bid tick Down
- Width Bid tick
- Style Bid tick
Last line settings
- Show Last tick
- Color Last tick Up
- Color Last tick Down
- Width Last tick
- Style Last tick
Other Settings
- Shift indicator bar
- Shift indicator price
- Text Size


Супер !