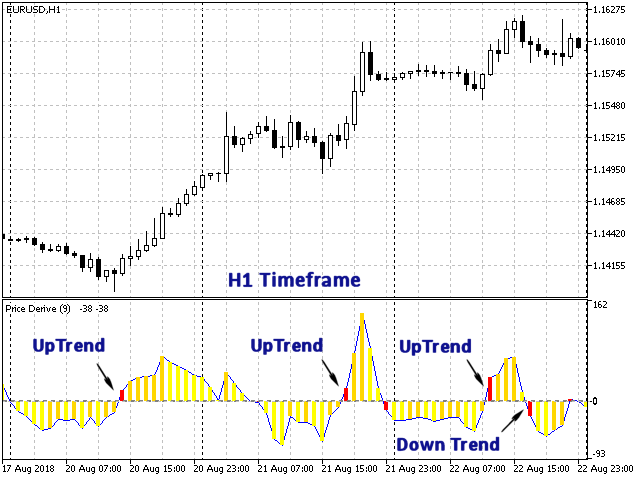
Most of indicators have lag and response by delay. They are usually showing trend change late. Price Derivative indicator is a powerful and sensitive tool to find each trend direction change and its power. It derives price values based on DEMA and fast Smoothed MA curve. Each time the direction of trend changes, indicator crosses the horizontal axis and a red bar appears. Red bar is a trigger and confirms beginning of new trend. Positive values indicate uptrend and negative values indicate downtrend. Scalping with Price Derivative indicator is very simple and accurate.
In version 2.0, Price Derivative sends you an email and plays Alert sound each time a trend reversal happens.
Awesome Oscillator D The Awesome Oscillator D is a modified version of Awesome Oscillator . Awesome Oscillator or AO is one of Bill Williams indicators and is a momentum measurement tool ussing two Simple Moving Averages of 34 and 5 periods. AO is a powerful indicator to reveal trend changes or to predict trend reversals. Awesome Oscillator D or AOD calculates AO by DEMA instead of SMA and has better sensitivity and accuracy. AOD has the same input parameter as AO, the applied price. Input
Price Derivative Most of indicators have lag and response by delay. They are usually showing trend change late. Price Derivative indicator is a powerful and sensitive tool to find each trend direction change and its power. It derives price values based on DEMA and fast Smoothed MA curve. Each time the direction of trend changes, indicator crosses the horizontal axis and a red bar appears. Red bar is a trigger and confirms beginning of new trend. Positive values indicate uptrend and negative
Price Velocity indicator Price like a physical point moves up and down on vertical axe. Speed of these changes can be used to show trends direction and direction change. Velocity is derivative of price movement, so zero value of price velocity means extremum of price changes. After maximum point of price curve, it tends to decrease and increases after minimum. In Price Velocity indicator, crossing the zero line shows trend direction change. Crossing zero line from negative value to positive
PIPs Deviation indicator measures the absolute variability or dispersion range of fast SMA with respect to current value in pip unit. Deviation is the difference between the actual and the average value. Standard Deviation calculates statistical Dev value, but PIPs Deviation reveals actual values of price dispersal and not just a statistics parameter. It determines price movements in a specific period and can be used to risk management. Colored bars help to see the movement direction better
Price changes and trend lines show us that there isn't any permanent pattern for a day or any periods of time. But chart of High and Low differences has a daily oscillation. I drew chart of High minus Low for different currency pairs...
It seems High and Low are as independent as Open and Close of price candles. However, the graph of [ High minus Low ] shows a sinusoid pattern with constant period of 24 hours. The above picture shows EURCAD price chart and HIGH-LOW chart below it. As we can see, a main sine wave exists...