Candlestick Pattern Detector
- インディケータ
- Adhemar Braganca Correa Travassos
- バージョン: 1.1
- アップデート済み: 31 1月 2023
- アクティベーション: 5
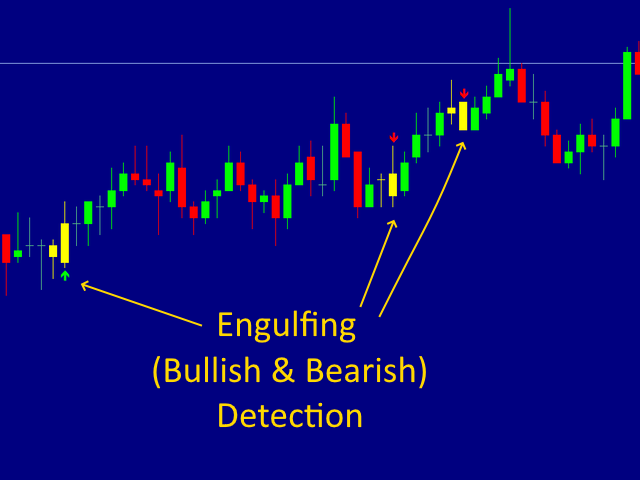
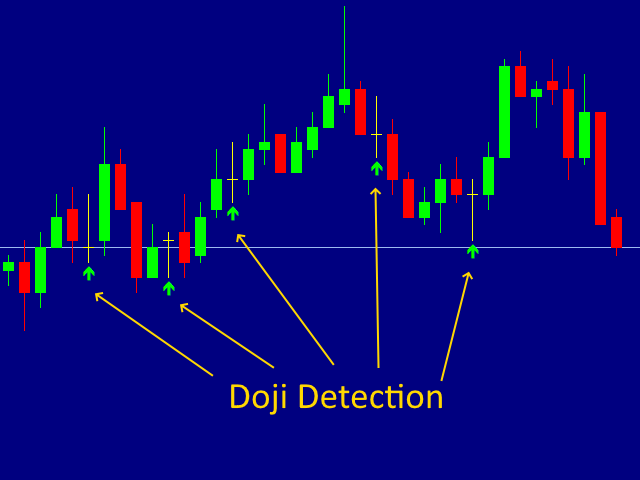
This indicator can identify more than 60 candlestick patterns on the chart, including their bullish and bearish variants. Just choose the pattern you want in the settings.
Available Patterns
| 2 Crows | Gravestone Doji | On Neck |
| 3 Black Crows | Hammer | Piercing |
| 3 Inside | Hanging Man | Rick Shawman |
| 3 Line Strike | Harami | Rising and Falling Three Method |
| 3 Outside | Harami Cross | Separating Lines |
| 3 Stars in South | High Wave | Shooting Star |
| 3 White Soldiers | Hikkake | Short Line |
| Abandoned Baby | Hikkake Modified | Spinning Top |
| Advance Block | Homing Pigeon | Stalled Pattern |
| Belt Hold | Identical 3 Crows | Stick Sandwich |
| Breakaway | In Neck | Takuri |
| Closzing Marubozu | Inverted Hammer | Tasuki Gap |
| Concealing Baby Swallow | Kicking | Thrusting |
| Counter Attack | Kicking by Length | Tri Star |
| Dark Cloud Cover | Ladder Bottom | Unique 3 River |
| Doji | Long Legged Doji | Upside Gap 2 Crows |
| Doji Star | Long Line | Upside/Downside Gap Three Methods |
| Dragonfly Doji | Marubozu | |
| Engulfing | Matching Low | |
| Evening Doji Star | Mat Hold | |
| Evining Star | Morning Doji Star | |
| Gap Side by Side White Lines | Morning Star |
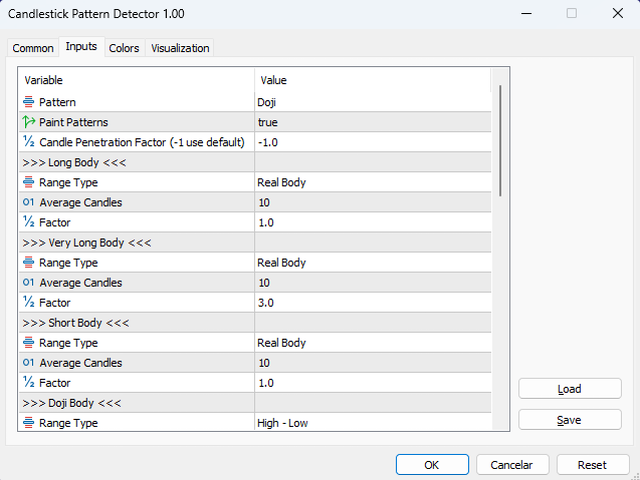
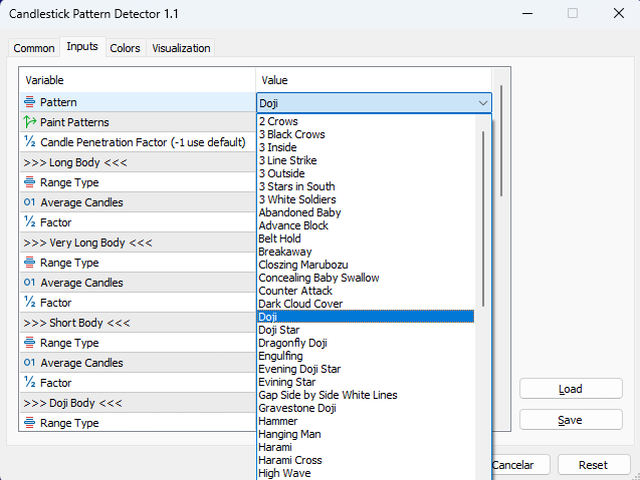
Settings
Pattern
Selected the candlestick pattern that will be detected.
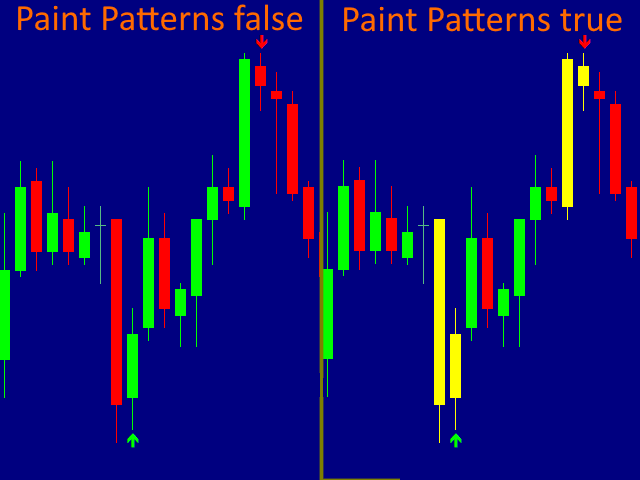
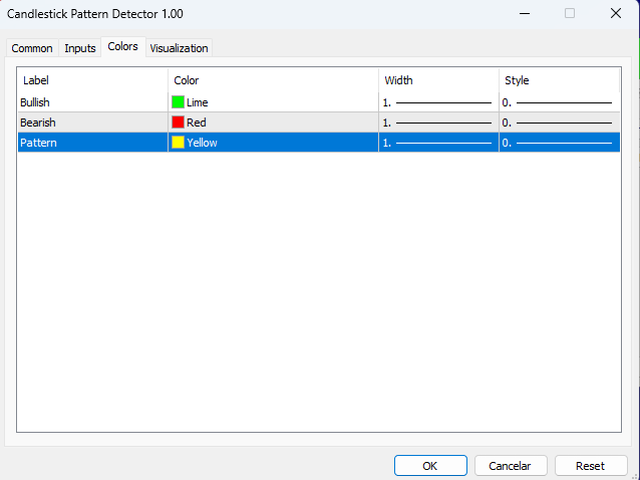
Paint Patterns
When the value is true, all candlesticks that make up the detected pattern will be painted in a different color.
Candle Penetration Factor
Penetration factor of one candle over another. Some standards, such as Dark Cloud Cover, use this parameter for more accurate detection. Use -1 for the system to adopt the default values.
Settings for Long Body, Very Long Body, Short Body, Doji Body, Long Shadow, Very Long Shadow, Short Shadow, Very Short Shadow, Near Distances of Candles Parts, Far Distances of Candles Parts e Equal Distances of Candles Parts
Used to determine the size patterns of the parts that make up a candle during the detection process.
Range Type defines part of the candle will be used for the calculator (eg Real Body).
Average Candles define how many candles before the current one will be used to determine the average value of the setup.
Factor sets the average value multiplier factor to determine the default detection value.
Long Body - Range Type: Real Body, Average Candles: 10 and Factor: 1.0
Real body is long when it's longer than the average of the 10 previous candles' real body.
Very Long Body - Range Type: Real Body, Average Candles: 10 and Factor: 3.0
Short Body - Range Type: Real Body, Average Candles: 10 and Factor: 1.0Real body is very long when it's longer than 3 times the average of the 10 previous candles' real body.
Real body is short when it's shorter than the average of the 10 previous candles' real bodies.Doji Body - Range Type: High - Low, Average Candles: 10 and Factor: 0.1
Real body is like doji's body when it's shorter than 10% the average of the 10 previous candles' high-low range.Long Shadow - Range Type: Real Body, Average Candles: 0 and Factor: 1.0
Shadow is long when it's longer than the real body.
Very Long Shadow - Range Type: Real Body, Average Candles: 0 and Factor: 2.0
Short Shadow - Range Type: Shadows, Average Candles: 10 and Factor: 1.0Shadow is very long when it's longer than 2 times the real body.
Shadow is short when it's shorter than half the average of the 10 previous candles' sum of shadows.
Very Short Shadow - Range Type: High - Low, Average Candles: 10 and Factor: 0.1
Shadow is very short when it's shorter than 10% the average of the 10 previous candles' high-low range.Near - Range Type: High - Low, Average Candles: 5 and Factor: 0.1
When measuring distance between parts of candles or width of gaps "near" means "<= 20% of the average of the 5 previous candles' high-low range".Far - Range Type: High - Low, Average Candles: 5 and Factor: 0.6
When measuring distance between parts of candles or width of gaps "far" means ">= 60% of the average of the 5 previous candles' high-low range".Equal - Range Type: High - Low, Average Candles: 5 and Factor: 0.05
When measuring distance between parts of candles or width of gaps "equal" means "<= 5% of the average of the 5 previous candles' high-low range".