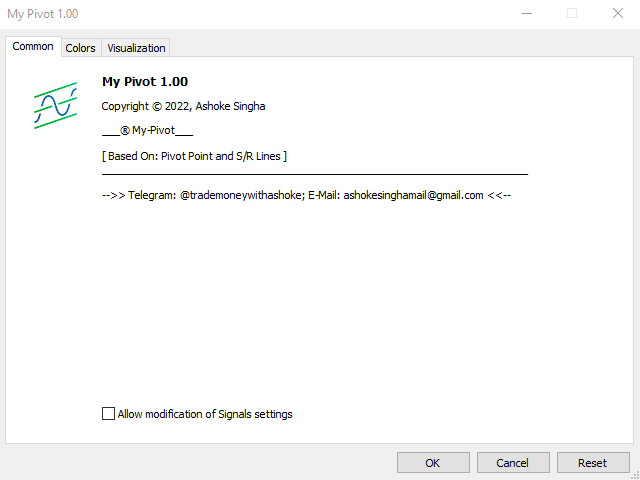
My Pivot
- インディケータ
- Ashok Kumar Singha
- バージョン: 1.0
- アクティベーション: 5
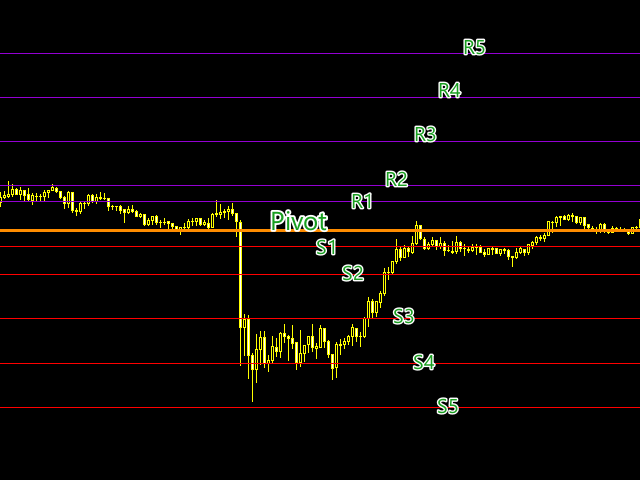
My Pivot
is an Indicator based on Pivot Lines and Support-Resistance zones.
This Indicator will Plot 11 SR zones including Pivot Line which will definitely help you to understand the exact SR zones of the Market.
Steps to Setup the Indicator:
✪ Install the Custom Indicator;
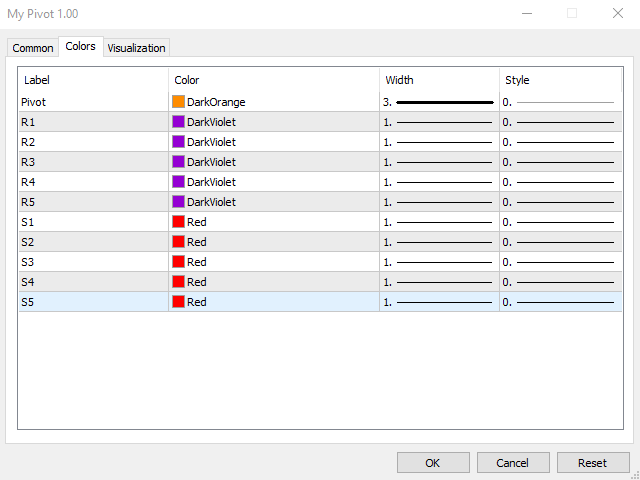
✪ Set all the Lines Color, Width and Styles;
✪ Set visualization to All Timeframe; and
DONE👍
It can be used for:
- All Pairs: Forex, Cryptocurrencies, Metals, Stocks, Indices.
- All Timeframe
- All Brokers
- All type of Trading Style like Scalping, Swing, Intraday, Short-Term, Long-Term etc.
- Multiple Chart
--->>!! MT4 version will Launch very shortly !!<<---
-->> For any Type of Support, Guidance, Setup Issue, EA Optimization, Input Setup etc. etc. can Contact me..
Support Group--->> https://www.mql5.com/en/messages/030709F84DE2D801