• 概要
  • レビュー
  • コメント
  • 最新情報

Telegram helper for indicator

A problem when indicator call webrequest is "The WebRequest() function is synchronous, which means its breaks the program execution and waits for the response from the requested server. Since the delays in receiving a response can be large, the function is not available for calls from indicators, because indicators run in a common thread shared by all indicators and charts on one symbol. Indicator performance delay on one of the charts of a symbol may stop updating of all charts of the same symbol.". Other way is use wininet.dll but this is not secure (and cannot publish on mql market also :D).

This service help coder add "Send message to Telegram" to indicator.

Free for user who puscharse my product.

Usage:

After downloading the tool, you follow these steps:

1.      Copy tool to “service” folder cof MT5, as you copy indicator to “indicators” folder

2.      Configure the indicator following steps:

In Notification configure group

Telegram channel id: input your channel id number

Telegram bot token: input your telegram bot_token

File .txt write msg: input any filename and ends with the extension  .txt. If you use other our indicator, please enter this file name differently for each indicator. Configure the service as following steps:

In Input “files (with .txt ext) separate by | character”: enter the filename [file_name].txt.  If you use other our indicator, please enter [file_name].txt seperated by characters | . For example:  trendline.txt|swingzz.txt means you are using my 2 indicators are: trendline with break và swingzz and you configure both those indicators  notification through telegram.

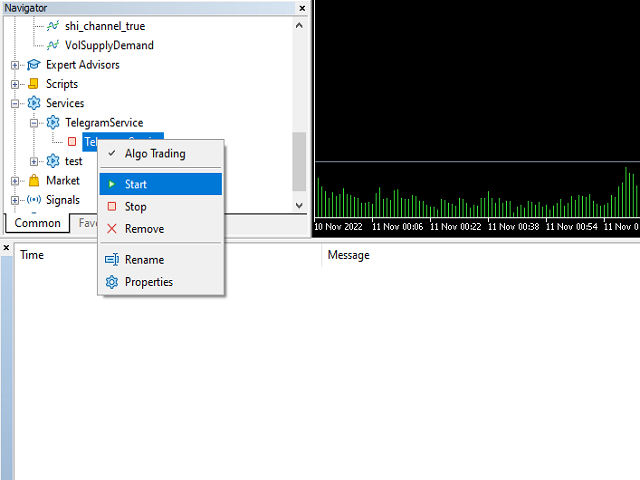
3.      Finally, please remember that service only runs when you turn it on. Then there will be a blue icon.


おすすめのプロダクト
Please backtest with the exact balance of your live account before applying to real money. ==> If account balance is too low it may not trade at all! For MT4 version please contact via private message. martingale version is available here . Strategy description - Detect trend based on EMA18-EMA50-SMA200 alignment in three time frames: M15, H1, H4 - Trade in trend direction and exit when above alignment is broken. - The bot is tuned to trade XAUUSD(Gold). - The bot output is break even in rangi
FREE
SUPERTREND; It is a trend following indicator based on the SuperTrend ATR created by Olivier Seban. It can be used to detect changes in trend direction and locate stops. When the price falls below the indicator curve, it turns red and indicates a downtrend. Conversely, when the price moves above the curve, the indicator turns green, indicating an uptrend. Like other indicators, it works well on SuperTrend when used in conjunction with other indicators such as MACD, parabolik SAR, Bollinger Band
FREE
Supports And Resistances Lines
Francisco Gomes Da Silva
4.77 (39)
サポートゾーンとレジスタンスゾーンのインジケーターMT5 このインジケーターは、トップとボトムを自動的に識別する方法を知っています。 このサポートとレジスタンスインジケーターは、トップとボトムに基づいてサポートラインとレジスタンスラインを作成します。 サポートラインとレジスタンスラインの作り方。 これは、自動サポートラインとレジスタンスラインを作成するためのインジケーターです。 インジケーターを使用してサポートレベルを見つける方法。 このインジケーターはトップとボトムを自動的に検出します。 インジケーターは、「ZigZag」が自動的に底を作成するか、新しい底を前の底より低くするたびにサポートラインを自動的に作成するため、インジケーターは画面に自動サポートラインを自動的に描画します。 レジスタンスラインの作成方法。 インジケーターは、「ZigZag」が新しいトップまたは前のトップよりも高いトップを作成するたびに、サポートレベルを作成するのと同じ方法で抵抗線を自動的に作成します。したがって、インジケーターは新しい抵抗を自動的に作成します。トップレベルとボトムレベルがどこにあるかを心配する必
FREE
This indicator is especially for the binary trading. Time frame is 1 minutes and exp time 5 or 3 minutes only. You must be use martingale 3 step. So you must put lots size is 10 % at most. You should use Mt2 trading platform to connect with my indicator to get more signal without human working. This indicator wining rate is over 80% but you may get 100% of profit by using martingale 3 step. You should use MT2 Trading Platform to connect meta trader platform and binary platform . You can get mt2
FREE
Value Chart Candlesticks
Flavio Javier Jarabeck
4.75 (8)
The idea of a Value Chart indicator was presented in the very good book I read back in 2020 , " Dynamic Trading Indicators: Winning with Value Charts and Price Action Profile ", from the authors Mark Helweg and David Stendahl. The idea is simple and the result is pure genius: Present candlestick Price analysis in a detrended way! HOW TO READ THIS INDICATOR Look for Overbought and Oversold levels. Of course, you will need to test the settings a lot to find the "correct" one for your approach.
FREE
It is just an alternative fibo lines. mt4 have is a very strange drawing of fibo lines, this utilites was written for mt4, but for mt5 it may not be particularly useful. A simple Box (Rectangle) graphic element with adjustable levels binding: it is possible to specify up to 17 custom levels, all rectangles on the chart with the given prefix in their name are processed. Levels are specified in % of the height of the rectangle. A convenient graphical element for analyzing charts by growth-correct
FREE
Trade Assistant Panel: Your Optimal Trading Ally "The Trade Assistant Panel" is a graphical tool for traders aiming to simplify and enhance their trading experience. It streamlines order execution and management, allowing you to focus on market analysis and decision-making. With just a few clicks, you can initiate various order types, ensuring that you always have full control over your trading strategy: Buy Orders Sell Orders Buy Stop Orders Buy Limit Orders Sell Stop Orders Sell Limit Orders Y
FREE
Donchian Channel is an indicator created by Richard Donchian. It is formed by taking the highest high and the lowest low of the last specified period in candles. The area between high and low is the channel for the chosen period. Its configuration is simple. It is possible to have the average between the upper and lower lines, plus you have alerts when price hits one side. If you have any questions or find any bugs, please contact me. Enjoy!
FREE
Best SAR MT5
Ashkan Hazegh Nikrou
5 (1)
説明 :  外国為替市場(PSAR)で専門的で人気のあるインジケーターの1つに基づいた新しい無料インジケーターをご紹介します。このインジケーターは元のパラボリックSARインジケーターの新しい変更です。プロSARインジケーターでは、ドットと価格チャートのクロスオーバーを見ることができます。クロスオーバーはシグナルではありませんが、動きの終わりの可能性について話します。新しい青いドットで購入を開始し、最初の青いドットの1 atr前にストップロスを配置し、最後にドットが価格チャートを横切るとすぐに終了できます。 売買シグナルを開く方法は? 最初の青い点によるオープンバイトレードと最初の赤いドットによるオープンセルトレード 正しいストップロスはどこにありますか? 安全なストップロスは最初のドットにある可能性があります(最初の青いドットの買いの場合と最初の赤い点の売りの場合) 正しいテイクプロフィットはどこにありますか? テイクプロフィットはストップロス距離とRRに基づいて調整できるので、私の提案は2 RRで、ストップロスの2倍です。 利益を上げているのにtpを達成でき
FREE
MT5用NAS100 Auto SL and TP Makerをご紹介します: MetaTrader5でナスダック100市場をナビゲートするトレーダーにとって不可欠なアシスタントであるNAS100オートSLおよびTPメーカーで、ストップロスおよびテイクプロフィットの設定をもう見逃すことはありません。このツールは、ストップロスとテイクプロフィットのレベル管理を自動化するシームレスなソリューションを求める方々のために設計されています。 主な特徴 簡単な自動化: ストップロスやテイクプロフィットのないナスダック100取引を自動的に監視します。 ユーザーが構成した設定に基づいてレベルを動的に調整します。 注文タイプの多様性: Nasdaq100の成行注文と未決済注文の両方に対応。 MetaTrader 5で利用可能なさまざまな注文タイプをサポートします。 カスタマイズされた設定: ユーザーフレンドリーなパラメータ設定により、トラッキング設定とストップロス/テイクプロフィットレベルのカスタマイズが可能です。 柔軟な範囲: 実行する特定のNAS100商品または取引されるす
FREE
This information indicator will be useful for those who always want to be aware of the current situation on the account. - More useful indicators The indicator displays data such as profit in points, percentage and currency, as well as the spread for the current pair and the time until the bar closes on the current timeframe. There are several options for placing the information line on the chart: - To the right of the price (runs behind the price); - As a comment (in the upper left corner
FREE
Follow The Line MT5
Oliver Gideon Amofa Appiah
4.4 (30)
This indicator obeys the popular maxim that: "THE TREND IS YOUR FRIEND" It paints a GREEN line for BUY and also paints a RED line for SELL. (you can change the colors). It gives alarms and alerts of all kinds. IT DOES NOT REPAINT and can be used for all currency pairs and timeframes. Yes, as easy and simple as that. Even a newbie can use it to make great and reliable trades. NB: For best results, get my other premium indicators for more powerful and reliable signals. Get them here: https://www.m
FREE
Ultimate Retest
Nguyen Thanh Cong
3.5 (4)
Introduction The "Ultimate Retest" Indicator stands as the pinnacle of technical analysis made specially for support/resistance or supply/demand traders. By utilizing advanced mathematical computations, this indicator can swiftly and accurately identify the most powerful support and resistance levels where the big players are putting their huge orders and give traders a chance to enter the on the level retest with impeccable timing, thereby enhancing their decision-making and trading outcomes.
FREE
CandleBot
Mithlesh Kumar Mandal
キャンドルボットのご紹介 - ローソク足パターンを認識しトレードするための究極の無料ツール!キャンドルボットを使用して、簡単に高値と低値の両方に認識できる牛さんと熊さんのエングルフィング、モーニングスター、イブニングスター、そしてハンマーシグナルを活かし、市場で優位性を得ましょう。特定の期間にわたる始値、高値、安値、終値から導き出されたローソク足パターンは、価格動向の視覚的な表現となり、トレーダーが市場センチメントを分析し、潜在的な逆転や継続を予測するのに役立ちます。 ローソク足パターンの理解: エングルフィングパターン: 二つのローソク足から成り立ち、二つ目のローソクが完全に最初のものを覆います。ベアッシュエングルフィングは下降トレンドの終わりにおいて上昇トレンドの反転の可能性を示し、ブルッシュエングルフィングは上昇トレンドの終わりにおいて下降トレンドの反転の可能性を示唆します。エングルフィングキャンドルの本体が大きいほど、そのシグナルは強力です。 ハンマーパターン: 一本のローソク足で、本体が上部近くに小さく、下部に長い尾を持つハンマーのような形です。ブルッシュハンマーは下降トレン
FREE
Keyboard Trader は、 MetaTrader 5 (MT5) で キーボードショートカット を使用して超高速で取引するためのツールです。以下にその特徴の簡潔な説明を示します: 迅速な実行 : Keyboard Traderを使用すると、クリックせずに注文を迅速に実行できます。キーボードショートカットを使用して効率的にポジションを開いたり閉じたりできます。 ニューストレードに最適 : ニュースイベント時に迅速に対応する必要があるため、高いボラティリティの瞬間に取引する際に特に役立ちます。 カスタマイズ可能なホットキー : 最高の部分は、キーボードショートカットを 自分の好みにカスタマイズできる ことです。自分の取引スタイルに合ったアクションを実行するために独自のキーコンビネーションを割り当てることができます。 要するに、Keyboard TraderはMT5で迅速で正確な実行を求めるトレーダーにとって優れたツールです。トレード体験を向上させるためにその潜在能力を活用してください!
Free automatic Fibonacci is an indicator that automatically plots a Fibonacci retracement based on the number of bars you select on the BarsToScan setting in the indicator. The Fibonacci is automatically updated in real time as new highest and lowest values appears amongst the selected bars. You can select which level values to be displayed in the indicator settings. You can also select the color of the levels thus enabling the trader to be able to attach the indicator several times with differe
FREE
The indicator analyzes the volume scale and splits it into two components - seller volumes and buyer volumes, and also calculates the delta and cumulative delta. The indicator does not flicker or redraw, its calculation and plotting are performed fairly quickly, while using the data from the smaller (relative to the current) periods. The indicator operation modes can be switched using the Mode input variable: Buy - display only the buyer volumes. Sell - display only the seller volumes. BuySell -
FREE
Weis Waves
Flavio Javier Jarabeck
3.15 (26)
The original author is David Weis, an expert in the Wyckoff Method. The Weis Wave is a modern adaptation of the 1930's Wyckoff Method, another expert in Tape Reading techniques and Chart Analysis. Weis Waves takes market volume and stacks it into waves according to price conditions giving the trader valuable insights about the market conditions. If you want to learn more about this subject you can find tons of videos in YouTube. Just look for "The Wickoff Method", "Weis Wave" and "Volume Spread
FREE
TDO is a free utility for optimizing the Trading Direction indicator. In addition to signals for trading, the indicator also has an information vector that fully provides all the statistical information on the operation of the indicator; this effect can be used to ensure that the indicator is automatically optimized. You just need to select the instrument and timeframe and specify the hourly interval in the utility settings and drop it on the chart chart. That's all, now we are waiting for the
FREE
This Utility Bot is for New Traders, that struggle to spot the Trend direction. It also make you conscious about different Timeframes Bar Status.  Utility have 3 Moving Averages totally configurable by input parameters. 3MA Based Trend is shown for the current Timeframe selected on the chart. (Line 1) 3MA Based Trend for Daily Timeframe. (Line 2nd) Also provide quick information about the currently Hourly Daily and Weekly Candle Status.  Utility work on 1 Min Bar control, so comment section info
FREE
Have you missed any tools or shortcuts in Meta Trader? Simple things that would make your daily trading much easier ? We have the solution for you: our Trade Panel! This is an EA tool (Expert Advisor) that, if configured to controll all symbols, needs to be loaded only once. This is the Lite version (free) of our tool. Professional version:   https://www.mql5.com/en/market/product/42658 Obs. Trade Panel has the power  to unpin from Me ta  T rader  to con trol all  the symbols wi thou t
FREE
Cybertrade Keltner Channels - MT5 Created by Chester Keltner, this is a volatility indicator used by technical analysis. It is possible to follow the trend of financial asset prices and generate support and resistance patterns. In addition, envelopes are a way of tracking volatility in order to identify opportunities to buy and sell these assets. It works on periods longer than the period visible on the chart. All values ​​are available in the form of buffers to simplify possible automations.
FREE
Introduction Reversal Candles is a cutting-edge non-repainting   forex indicator designed to predict price reversals with remarkable accuracy through a sophisticated combination of signals. Signal Buy when the last closed candle has a darker color (customizable) and an up arrow is painted below it Sell when the last closed candle has a darker color (customizable) and a down arrow is painted above it
FREE
Awesome Oscillator by Bill Williams with the ability to fine-tune and replace the averaging algorithms of the indicator, which significantly expands the possibilities of using this oscillator in algorithmic trading and brings it closer in its properties to such an indicator as the MACD. To reduce price noise, the final indicator is processed with an additional Smooth averaging. The indicator has the ability to give alerts, send mail messages and push signals when the direction of movement of th
True Day
Aurthur Musendame
5 (1)
True Days is a tool designed specifically for the trader who wants to catch intraday volatility in price charts.  True day makes it easier for the trader to avoid trading in the dead zone - a period in time where markets are considered dead or non volatile. The trader can concentrate on finding opportunities only during periods of profound market movements. By default the indicator gives you a true day starting at 02:00 to 19:00 hours GMT+2. You can adjust according to your Time Zone. By deafult
FREE
Important Lines
Terence Gronowski
4.88 (26)
This indicator displays Pivot-Lines, preday high and low, preday close and the minimum and maximum of the previous hour. You just have to put this single indicator to the chart to have all these important lines, no need to setup many single indicators. Why certain lines are important Preday high and low : These are watched by traders who trade in a daily chart. Very often, if price climbs over or falls under a preday low/high there is an acceleration in buying/selling. It is a breakout out of
FREE
A heatmap is a graphical representation of data in two dimensions, using colors to display different factors. Heatmaps are a helpful visual aid for viewers, enabling the quick dissemination of statistical or data-driven information. The MP Heatmap indicator provides a graphical representation of the relative strengths of major currencies compared to others, organizing data from pairs into color-coded results and producing a clear overview of the entire Forex market. The MP Heatmap indicator dis
FREE
Donchian Pro
Paulo Henrique Faquineli Garcia
5 (2)
The Donchian Channel Channels are among the most popular tools of technical analysis, as they visually convey to the analyst the limits within which most price movement tends to occur. Channel users know that valuable information can be obtained at any time, whether prices are in the central region of a band or close to one of the border lines. One of the best known techniques to explore these concepts is Bollinger Bands. However, John Bollinger was not the only one to research the applicatio
FREE
BoletaMiniPanel
PATRICK ANTONIO MORELO A.
5 (5)
Simple panel with  Stop loss (Loss), Stop gain (Gain) , Trailing stop (TS) and Breakeven (BE-P). Lot is the number of contracts to be traded. Gain is the number, in points, that the stop gain will be positioned. If you don't want to put stop gain, just put 0 (zero) in place and when you open the order it won't have this stop. Loss is the number, in points, that the stop loss will be placed. If you don't want to put stop loss, just put 0 (zero) in place and when you open the order it won't
FREE
Long Waiting
Aleksandr Davydov
5 (1)
Expert description Algorithm optimized for Nasdaq trading The Expert Advisor is based on the constant maintenance of long positions with daily profit taking, if there is any, and temporary interruption of work during the implementation of prolonged corrections The Expert Advisor's trading principle is based on the historical volatility of the traded asset. The values of the Correction Size (InpMaxMinusForMarginCallShort) and Maximum Fall (InpMaxMinusForMarginCallLong) are set manually. Reco
FREE
このプロダクトを購入した人は以下も購入しています
Trade Assistant MT5
Evgeniy Kravchenko
4.4 (171)
取引 ごとのリスクの 計算、新規注文 の 簡単 な 設置、部分的 な 決済機能 を 持 つ 注文管理、 7 種類 のトレーリングストップなど 、便利 な 機能 を 備 えています 。 注意、アプリケーションはストラテジーテスターでは機能しません。 説明ページからデモ版をダウンロードできます  Manual, Description, Download demo ライン機能 チャート上にオープニングライン、ストップロス、テイクプロフィットを表示します。この機能により、新規注文を簡単に設定することができ、注文を出す前にその特徴を確認することができます。   リスク計算 リスク計算機能は、設定されたリスクとストップロス注文のサイズを考慮して、新規注文のボリュームを計算します。ストップロスの大きさを自由に設定できると同時に、設定したリスクを守ることができます。 Lot calc ボタン - リスク 計算 を 有効 / 無効 にします 。 Risk フィールドでは 、必要 なリスクの 値 を 0 から 100 までのパーセンテージまたは 預金通貨 で 設定 します 。 設定」 タブで 、
価格が一瞬で変わる可能性のある市場では、注文はできるだけ簡単にすべきだと思いますか? Metatraderでは、注文を開くたびに、開始価格を入力し、損失を止めて利益を得るウィンドウと、取引サイズを開く必要があります。金融市場の取引では、初期預金を維持し、それを増やすために資本管理が不可欠です。それで、あなたが注文をしたいとき、あなたはおそらくあなたがどれくらいの大きさの取引を開くべきか疑問に思いますか?この単一の取引であなたの預金の何パーセントを危険にさらすべきですか?この取引からどれだけの利益を得ることができますか?また、リスクに対する利益の比率はどのくらいですか?トレードサイズを設定する前に、トレードサイズがどうあるべきかという質問に対する答えを得るために必要な計算を行います。 これらすべてを自動的に行うツールがあると想像してみてください。チャートを開き、市場分析を行い、エントリーポイント、ディフェンスポイント(ストップロス)、ターゲット(テイクプロフィット)を水平線でマークし、最後にリスクのレベルを定義します。利用可能な資本の%として、このトランザクションで負担することができ、こ
TradePanel MT5
Alfiya Fazylova
4.89 (112)
Trade Panel は、多機能の取引アシスタントです。 このアプリケーションには手動取引用に設計された 50 以上の機能が含まれており、ほとんどの取引アクションを自動化できます。 注意! アプリケーションはストラテジー テスターでは動作しません。 デモ アカウントでユーティリティをテストするには、 デモ バージョン  をダウンロードします。 アプリケーションの主な機能: 任意のシンボル(外国為替、CFD、先物など)で機能します。 無制限の文字数での同時作業。 取引ごとのリスクの自動計算とストップロスとテイクプロフィットの比率の設定。 OCO注文を行うことができます(一方が他方をキャンセルします-1つの注文を実行すると別の注文がキャンセルされます)。 タスクを含む行を設定できます(ポジションを開く、保留中の注文を開く、またはグループごとに注文を閉じる)。 仮想テイクプロフィットとストップロスを設定できます。 成行注文を反転またはロックできます。 6種類のトレーリングストップ。 ストップロスを損益分岐点に設定する機能があります。 ポジションを部分的にクローズする機能があります(利益また
Local Trade Copier EA MT5
Juvenille Emperor Limited
5 (63)
Local Trade Copier EA MT5 による、驚くほど高速な取引コピーを体験してください。1分で簡単にセットアップできるこの取引コピー機は、同じWindowsコンピュータまたはWindows VPS上の複数のMetaTrader端末間で取引をコピーすることができ、0.5秒未満の高速コピースピードを実現します。 初心者であろうとプロのトレーダーであろうと、 Local Trade Copier EA MT5 には、あなたの特定のニーズに合わせてカスタマイズするための幅広いオプションが用意されています。これは、利益の可能性を高めたい人にとって究極のソリューションです。 今すぐ試してみて、これが市場で最も速くて簡単なトレードコピー機である理由を理解してください。 ヒント: デモアカウントで Local Trade Copier EA MT5 デモバージョンをダウンロードして試すことができます: ここ ダウンロードした無料のデモ ファイルを MT5 >> ファイル >> データ フォルダを開く >> MQL5 >> Experts フォルダに貼り付けて、ターミナルを再起動し
Adam FTMO MT5
Vyacheslav Izvarin
5 (1)
ADAM EA Special Version for FTMO Please use ShowInfo= false for backtesting ! Our 1st EA created using ChatGPT technology Trade only GOOD and checked PROP FIRMS  Default parameters for Challenge $100,000 Tested on EURUSD and GBPUSD only  Use 15MIN Time Frame Close all deals and Auto-trading  before Weekend at 12:00 GMT+3  Friday For Prop Firms MUST use special Protector  https://www.mql5.com/en/market/product/94362 Signal using ADAM  https://www.mql5.com/en/signals/2190554 --------------------
Trade Manager は、リスクを自動的に計算しながら、取引を迅速に開始および終了するのに役立ちます。 過剰取引、復讐取引、感情的な取引を防止する機能が含まれています。 取引は自動的に管理され、アカウントのパフォーマンス指標はグラフで視覚化できます。 これらの機能により、このパネルはすべてのマニュアル トレーダーにとって理想的なものとなり、MetaTrader 5 プラットフォームの強化に役立ちます。多言語サポート。 MT4バージョン  |  ユーザーガイド + デモ Trade Manager はストラテジー テスターでは機能しません。 デモについてはユーザーガイドをご覧ください。 危機管理 % または $ に基づくリスクの自動調整 固定ロットサイズを使用するか、ボリュームとピップに基づいた自動ロットサイズ計算を使用するオプション RR、Pips、または価格を使用した損益分岐点ストップロス設定トレーリングストップロス設定 目標に達したときにすべての取引を自動的に終了するための 1 日あたりの最大損失 (%)。 過度のドローダウンからアカウントを保護し、オーバートレードを防ぎます
The product will copy all telegram signal to MT5 ( which you are member) , also it can work as remote copier.  Easy to set up, copy order instant, can work with almost signal formats, image signal,  s upport to translate other language to English Work with all type of channel or group, even channel have "Restrict Saving Content", work with  multi channel, multi MT5 Work as remote copier: with signal have ticket number, it will copy exactly via ticket number. Support to backtest signal. How to s
Mentfx Mmanage mt5
Anton Jere Calmes
4.43 (7)
The added video will showcase all functionality, effectiveness, and uses of the trade manager. Drag and Drop Trade Manager. Draw your entry and have the tool calculate the rest. Advanced targeting and close portions of a trade directly available in tool (manage trades while you sleep). Market order or limit order on either side with factored spread. Just draw the entry, the tool does the rest. Hotkey setup to make it simple. Draw where you want to enter, and the stop loss, the tool calculates al
Trade copier MT5
Alfiya Fazylova
4.35 (26)
Trade Copierは、取引口座間の取引をコピーして同期するように設計された専門的なユーティリティです。 コピーは、同じコンピューターまたはvps にインストールされている、サプライヤーのアカウント/端末から受信者のアカウント/端末に行われます。 購入する前に、デモ アカウントでデモ バージョンをテストできます。 デモ版 こちら 。 詳細な説明は こちら 。 主な機能と利点: MT5ネッティングアカウントを含む、MT5> MT5、MT4> MT5、MT5> MT4のコピーをサポートします。 高いコピー速度(0.5秒未満)。 ベンダーモードと受信者モードは同じ製品内に実装されています。 チャートから直接リアルタイムでコピーを制御できる、簡単で直感的なインターフェイス。 接続が切断されたり、端末が再起動されたりしても、設定と位置が失われることはありません。 コピーするシンボルを選択できます。また、受信者のシンボルを置き換えることもできます(例:EURUSD> USDJPY)。 バックコピーをサポートします。 特定の注文のみのコピーを有効にする機能。 取引開始価格の最大差と最大遅延時間を
-25% discount ($199 -> $149) Advanced trading tool: One click smart orders that execute under your conditions Developed by trader for trading community:  position size calculator (lot size), open position after price action, strategy builder, set and forget trading, mobile notifications... Risk Management -  Risk percentage position size calculator, gain percentage, target risk reward ratio, spread and commissions are included in calculations 7 Advanced order types  - Set and forget trading w
OrderManager をご紹介:MT5用の革新的なユーティリティ 新しく設計されたOrder Managerユーティリティを使用して、MetaTrader 5での取引をプロフェッショナルなものにしましょう。シンプルさと使いやすさに焦点を当てたこのユーティリティは、各取引に関連するリスクを簡単に定義し、視覚化できます。これにより、情報に基づいた意思決定が可能になり、取引戦略を最適化できます。OrderManagerに関する詳細は、マニュアルをご参照ください。 [ マニュアル ] [ MT4 バージョン ] [ Telegram チャンネル ] 主な特長: リスク管理:取引のリスクを素早く簡単に定義し、より良い意思決定を行い、取引パフォーマンスを向上させます。 視覚表現:オープンなポジションとそれに関連するリスクをグラフィカルに表示し、明瞭かつ簡潔な理解が可能です。 注文変更:数回のクリックで注文を簡単に変更またはクローズし、取引プロセスを効率化し、貴重な時間を節約します。 手のひらの上の最新ニュース:ボタン一つで最新の市場ニュースに常にアクセスできます。 MT5トレーダーにと
MT5 to Telegram Signal Provider は、Telegramのチャット、チャンネル、またはグループに 指定された シグナルを送信することができる、完全にカスタマイズ可能な簡単なユーティリティです。これにより、あなたのアカウントは シグナルプロバイダー になります。 競合する製品とは異なり、DLLのインポートは使用していません。 [ デモ ] [ マニュアル ] [ MT4版 ] [ Discord版 ] [ Telegramチャンネル ] セットアップ ステップバイステップの ユーザーガイド が利用可能です。 Telegram APIの知識は必要ありません。必要な全ては開発者から提供されます。 主な特長 購読者に送信する注文の詳細をカスタマイズする機能 例えば、Bronze、Silver、Goldといった階層型のサブスクリプションモデルを作成できます。Goldサブスクリプションでは、すべてのシグナルが提供されます。 id、シンボル、またはコメントによって注文をフィルターできます 注文が実行されたチャートのスクリーンショットが含まれます 追加の
UTM Manager は、迅速かつ効率的な取引執行を提供する直感的で使いやすいツールです。際立った機能の 1 つは、「スプレッドを無視」モードです。これにより、スプレッドを完全に無視して、ローソク足の価格で取引できるようになります (たとえば、LTF でより高いスプレッドのペアを取引でき、スプレッドによって取引から除外されるのを回避できます)。 UTM Manager のもう 1 つの重要な側面は、独自のローカル取引コピー機であり、各ブローカーで異なる取引戦略と設定 (たとえば、さまざまな TP、BE、およびリスク ルール) を柔軟に実行できます。 取引執行: 迅速かつ効率的な取引執行: チャート上のエントリー価格とストップロス価格をクリックして簡単に取引を入力するか、ワンクリックの固定ストップロスサイズ機能を使用します。 自動ロットサイズ計算: ロットは事前定義されたリスク設定に基づいて計算され、ドラッグによってポジションが変更されると再計算されます。 1 つまたは複数のポジションを同時に処理できる能力。 利益確定と損益分岐点: 柔軟なテイクプロフィット設定: 特定のリスク対報
-25% discount ($149 -> $111) Everything for chart Technical Analysis indicator mt5 in one tool Draw your supply demand zone with rectangle and support resistance with trendline and get alerts to mobile phone or email alert -  Risk reward indicator mt5 Video tutorials, manuals, DEMO download   here .   Find contacts on my   profile . 1.   Extended rectangles and trendlines Object will be extended to the right edge of the chart when price will draw new candles on chart. This is rectangle extend
The top-selling EAs on the market cost a lot and one day they are suddenly gone. This is because one strategy will not work in the forex market all the time. Our product is unique from all others in the MQL Marketplace because our EA comes with 34+ built-in indicators that allow develop strategies every time.  You build your strategy and keep updating it. If one strategy does not work, simply build another all using only one EA. This is All-In-One EA   in this market place. You can use as trade
ワンクリックで取引できるトレーディングパネル。ポジションと注文の操作!チャートまたはキーボードから取引。 当社の取引パネルを使用すると、チャートから直接シングルクリックで取引を実行でき、標準の MetaTrader コントロールよりも 30 倍高速に取引操作を実行できます。 パラメータと関数の自動計算により、トレーダーにとって取引がより速く、より便利になります。 グラフィックのヒント、情報ラベル、取引取引に関する完全な情報はチャート MetaTrader にあります。 MT4のバージョン 完全な説明   +DEMO +PDF 購入する方法 インストールする方法     ログファイルの取得方法     テストと最適化の方法     Expforex のすべての製品 手動取引用の取引パネル。チャート(チャートウィンドウ)またはキーボードから取引できます。  開閉、リバース、ロックポジションと注文を処理する МetaТrader5 のメインオーダーのトレーディングコントロールパネル:売買、売却、売却、売却、売却、閉じる、削除、修正、トレーリングストップ、ストップロス、takep
Tired of complex order placement and manual calculations? Trade Dashboard is your solution. With its user-friendly interface, placing orders becomes effortless, by a single click, you can open trades, set stop loss and take profit levels, manage trade lot size, and calculate risk to reward ratios, allowing you to only focus on your strategy. Say goodbye to manual calculations and streamline your trading experience with Trade Dashboard. Download   demo version   right now. You can find   deta
This EA Utility allows you to manage (with advanced filtering) unlimited open orders (manual or EA) with 16 trailing stop methods: fixed, percent, ATR Exit, Chandelier Exit, Moving Average, Candle High Low Exit, Bollinger Bands, Parabolic, Envelope, Fractal, Ichimoku Kijun-Sen, Alligator, Exit After X Minutes or Bars, RSI and Stochastic. The trailing stop can be either real or virtual, and you can exit fully or with a partial close percent on touch or bar close.  Moreover, you can add (overri
Botトークンや管理者権限の必要なしに、メンバーであるすべてのチャンネルからシグナルをコピーして、MT5に直接送信します。 多くの機能を提供しながら、ユーザーを考慮して設計されています この製品は、使いやすい視覚的に魅力的なグラフィカルインターフェースで提供されています。設定をカスタマイズして、数分で製品を使用開始できます! ユーザーガイド + デモ  | MT4バージョン | Telegramバージョン デモを試してみたい場合は、ユーザーガイドを参照してください。 DiscordからMT5への変換は、ストラテジーテスターで動作しません。 DiscordからMT5への変換の特長 メンバーである任意のチャンネルからコピーします。BotトークンやチャットIDは不要です リスク%または固定ロットを使用して取引 特定のシンボルを除外 すべてのシグナルをコピーするか、コピーするシグナルをカスタマイズします すべてのシグナルを認識するための単語やフレーズを設定します(デフォルトは99%のシグナルプロバイダーに適用されます) コピーするタイミングと日時の設定をカスタマイズします 一度に
Grid Manual MT5
Alfiya Fazylova
4.83 (12)
「Grid Manual」は、注文のグリッドを操作するための取引パネルです。 ユーティリティはユニバーサルで、柔軟な設定と直感的なインターフェイスを備えています。 それは、損失を平均化する方向だけでなく、利益を増やす方向でも注文のグリッドで機能します。 トレーダーは注文のグリッドを作成して維持する必要はありません。 すべてが「Grid Manual」によって行われます。 注文を開くだけで十分であり、「Grid Manual」は注文のグリッドを自動的に作成し、非常に閉じるまでそれに付随します。 ユーティリティの主な機能と機能 ユーティリティは、モバイル端末から開かれた注文を含め、あらゆる方法で開かれた注文を処理します。 「制限」と「停止」の2種類のグリッドで機能します。 グリッド間隔の計算には、固定と動的(ATRインジケーターに基づく)の2つの方法で機能します。 オープンオーダーグリッドの設定を変更できます。 チャート上の各注文グリッドの損益分岐点を表示します。 各注文グリッドの利益率を表示します。 ワンクリックでグリッドから収益性の高い注文を閉じることができます。 ワンクリックで各注文
DrawDown Limiter
Haidar, Lionel Haj Ali
5 (17)
Drawdown Limiter EA You are in the right place if you were searching for Drawdown control, Drawdown limiter, Balance protection, Equity Protection or Daily Drawdown Limit related to Prop Firm, FTMO, or Funded account trading, or if you want to protect your trading account. Have you suffered from controlling your drawdown when trading funded accounts? This EA is meant for you. Prop firms usually set a rule called “Trader Daily Drawdown”, and if it is not respected, you are disqualified.  I am an
The most advanced news filter and drawdown limiter on MQL market NEW: Take a Break can be backtested against your account history! Check the " What's new " tab for details. Take a Break has evolved from a once simple news filter to a full-fledged account protection tool. It pauses any other EA during potentially unfavorable market conditions and will continue trading when the noise is over. Typical use cases: Stop trading during news/high volatility (+ close my trades before). Stop trading when
Trade Assistant 38 in 1
Makarii Gubaydullin
4.87 (15)
多機能ツール 搭載機能: ロット計算機、プライスアクション、リスク/リワードレシオ、トレードマネージャー、需要供給ゾーンなどをはじめ65以上の機能。 バージョ:デモ版   |   ユーザーマニュアル   |    MT5版 このユーティリティはストラテジー テスターでは機能しません。 ここからデモ   バージョンをダウンロードして製品をテストできます。 ご不明な点や改善提案、バグの発見などございましたら、 連絡してください 。 取引プロセスを簡素化、高速化、自動化します。このダッシュボードで標準端末機能を拡張します 1. 新しい取引を開始します : ロット / リスク / RR の計算 1. Lot計算機(リスクサイズに基づく取引量計算 2. リスク計算機(ロットサイズに基づくリスク量) 3. リスク/リワードレシオ (R/R) 4. 注文のアクティベーション トリガー + Buy StopLimit / Sell StopLimit 5. 仮想 SL / TP レベル (隠しSL、TP: ブローカーには見えない) 6.  Smart SL / エントリー レベル: バ
This is exactly what the name says. Visual strategy builder . One of a kind. Turn your trading strategies and ideas into Expert Advisors without writing single line of code. Generate mql source code files with a few clicks and get your fully functional Expert Advisors, which are ready for live execution, strategy tester and cloud optimization. There are very few options for those who have no programming skills and can not create their trading solutions in the MQL language. Now, with Bots Build
This service is designed to stream online cryptocurrency quotes   from the Binance exchange to your MetaTrader 5 terminal. You will find it perfectly suitable if you want to see the quotes of cryptocurrencies in real time — in the Market watch window and on the MetaTrader 5 charts. After running the service, you will have fully featured and automatically updated  cryptocurrency charts in your MetaTrader 5. You can apply templates, color schemes, technical indicators and any non-trading tools to
Auto Trade Copier is designed to copy trades between multiple MT4/MT5 accounts/terminals with 100% accuracy. The provider and receiver accounts must be on the same PC/VPS. With this tool, you can copy trades to receiver accounts on the same PC/VPS. All trading actions will be copied from the provider to the receiver with no delay. This version can be used on MT5 accounts only. For MT4 accounts, you must use Auto Trade Copier (for MT4). Reference: For MT5 receiver, please download "Trade Receiver
MT5 to Discord Signal Provider は、Discord へ直接トレーディングシグナルを送信するために設計された、使いやすく完全にカスタマイズ可能なユーティリティです。このツールは、あなたのトレーディングアカウントを効率的なシグナルプロバイダーに変えます。 スタイルに合わせてメッセージフォーマットをカスタマイズ!利便性を考え、事前にデザインされたテンプレートから選択し、メッセージのどの要素を含めるか除外するかを選択できます。 [ デモ ] [ マニュアル ] [ MT4 バージョン ] [ Telegram バージョン ] セットアップ 簡単なセットアップのために、私たちの詳細な ユーザーガイド に従ってください。 Discord API の事前知識は必要ありません。必要なツールはすべて提供されます。 主な特徴 購読者の更新のための注文詳細をカスタマイズ。 ブロンズ、シルバー、ゴールドなど、各レベルで異なるシグナルアクセスを提供する階層的サブスクリプションモデルを実装。 注文が実行されたチャートのスクリーンショットを添付。 これらのスクリーンショットに表
Trade Copier Agent は、複数の MetaTrader(4/5) アカウント/端末間で取引をコピーするように設計されています。 このツールを使用すると、プロバイダー (ソース) または受信者 (宛先) として機能できます。すべての取引アクションは、遅延なくプロバイダーからレシーバーにコピーされます。 このツールを使用すると、0.5 秒未満の超高速のコピー速度で、同じコンピューター上の複数の MetaTrader ターミナル間で取引をコピーできます。 Trade Copier Agent インストール & 入力ガイド コピーを開始する前、または注文がないうちに、プロバイダー アカウントで設定を適用してください。 注文中の変更は、受取人のアカウントに影響します。 例: プロバイダー アカウントが買い注文を適用し、その後、受信者アカウントのすべての買い注文を無効にすると、決済されます。 EA追加URL(   http://autofxhub.com   )MT4端末(スクリーンショット参照) に関する通知を受け取りたい場合 。 MT5 バージョン https://w
取引パネルは注文の管理に限定されています - ボタンを使用して開かれたものと、ユーザーによって開かれたものの両方です。 シンプルで便利なコレクション。 バイヤーを補完します。 Gold Stuff インジケーターと併用することをお勧めします。 単一注文として取引を設定し、距離のあるグリッドを構築します。 標準グリッドを作成するには、10000 などの大きな距離を設定するだけです。 リアルタイム結果はこちらからご覧いただけます。 設定と個人的なボーナスを得るために、購入後すぐに私に連絡してください!   設定 新しいシリーズを開く - 注文の新しいシリーズのオン/オフの開始。 Lot miltiplier - 次の注文のロット乗数。 TP - ピップで利益を得る。 SL - 最初の注文からのピップ単位のストップロス。 トレイル スタート - トレーリング ストップの有効化。 トレイル ステップ - トレーリング ストップを有効にしたときの価格からの距離。 DD 削減アルゴリズム - 利益のある最後の注文が損失のある最初の注文シリーズでクローズされる場合のドローダウン削減
Basket EA MT5
Juvenille Emperor Limited
5 (6)
バスケットEAMT5 は、最高の利益ハーベスターであり、究極のアカウントプロテクターであり、すべてが1つの非常に使いやすいソリューションです。   バスケットEAΜΤ5 の背後にある考え方は、すべてのオープンポジションを合わせて、バスケットレベルでトレーディングアカウント全体の利益および/または損失を制御できるようにすることです。 これは、すべての管理されたポジションについて、口座残高のパーセンテージまたは口座通貨(金銭)で、バスケットテイクプロフィット、ストップロス、損益分岐点、およびトレーリングストップロス設定を提供します。 マジックナンバーやシンボルに応じて、特定の取引の管理または管理からの除外を可能にします。 また、アカウント保護設定を備えており、アカウントが利益を得るかストップロスのエクイティに達したときに、すべてのオープントレードを閉じ、すべての保留中の注文を削除し、すべてのチャートを閉じ、それらに添付されている他のEAを削除します。 ヒント:Basket EA MT5 デモバージョンをダウンロードして、デモアカウントで試すことができます: こちら ダウンロードした無
作者のその他のプロダクト
This all-in-one indicator displays real-time market structure (internal & swing BOS / CHoCH), order blocks, premium & discount zones, equal highs & lows, and much more...allowing traders to automatically mark up their charts with widely used price action methodologies. Following the release of our Fair Value Gap script, we received numerous requests from our community to release more features in the same category. "Smart Money Concepts" (SMC) is a fairly new yet widely used term amongst price a
Consolidation is when price is moving inside a clear trading range. When prices are consolidated it shows the market maker placing orders on both sides of the market. This is mainly due to manipulate the un informed money. This indicator automatically identifies consolidation zones and plots them on the chart. The method of determining consolidation zones is based on pivot points and ATR, ensuring precise identification. The indicator also sends alert notifications to users when a new consolida
This indicator provides the ability to recognize the SMC pattern, essentially a condensed version of the Wyckoff model. Once the pattern is confirmed by RTO, it represents a significant investment opportunity.    There are numerous indicators related to SMC beyond the market, but this is the first indicator to leverage patterns to identify specific actions of BigBoy to  navigate the market. Upgrade 2024-03-08: Add TP by RR feature. The SMC (Smart Money Concept)   pattern   is a market analysis m
OVERVIEW A Lorentzian Distance Classifier (LDC) is a Machine Learning classification algorithm capable of categorizing historical data from a multi-dimensional feature space. This indicator demonstrates how Lorentzian Classification can also be used to predict the direction of future price movements when used as the distance metric for a novel implementation of an Approximate Nearest Neighbors (ANN) algorithm. This indicator provide signal as buffer, so very easy for create EA from this in
The ICT Silver Bullet indicator is inspired from the lectures of "The Inner Circle Trader" (ICT) and highlights the Silver Bullet (SB) window which is a specific 1-hour interval where a Fair Value Gap (FVG) pattern can be formed. A detail document about ICT Silver Bullet here . There are 3 different Silver Bullet windows (New York local time): The London Open Silver Bullet (3 AM — 4 AM ~ 03:00 — 04:00) The AM Session Silver Bullet (10 AM — 11 AM ~ 10:00 — 11:00) The PM Session Silver Bullet
Overview The   Volume SuperTrend AI   is an advanced technical indicator used to predict trends in price movements by utilizing a combination of traditional SuperTrend calculation and AI techniques, particularly the k-nearest neighbors (KNN) algorithm. The Volume SuperTrend AI is designed to provide traders with insights into potential market trends, using both volume-weighted moving averages (VWMA) and the k-nearest neighbors (KNN) algorithm. By combining these approaches, the indicat
This indicator builds upon the previously posted Nadaraya-Watson Estimator. Here we have created an envelope indicator based on kernel smoothing with integrated alerts from crosses between the price and envelope extremities. Unlike the Nadaraya-Watson Estimator, this indicator follows a contrarian methodology. Please note that the indicator is subject to repainting. The triangle labels are designed so that the indicator remains useful in real-time applications. Settings Window Size: Dete
The Inversion Fair Value Gaps (IFVG) indicator is based on the inversion FVG concept by ICT and provides support and resistance zones based on mitigated Fair Value Gaps (FVGs). Image 1   USAGE Once mitigation of an FVG occurs, we detect the zone as an "Inverted FVG". This would now be looked upon for potential support or resistance. Mitigation occurs when the price closes above or below the FVG area in the opposite direction of its bias. (Image 2) Inverted Bullish FVGs Turn into P
This indicator presents an alternative approach to identify Market Structure. The logic used is derived from learning material created by   DaveTeaches (on X) When quantifying Market Structure, it is common to use fractal highs and lows to identify "significant" swing pivots. When price closes through these pivots, we may identify a Market Structure Shift (MSS) for reversals or a Break of Structure (BOS) for continuations. The main difference with this "protected" logic is in how we determine
The Breaker Blocks with Signals indicator aims to highlight a complete methodology based on breaker blocks. Breakout signals between the price and breaker blocks are highlighted and premium/discount swing levels are included to provide potential take profit/stop loss levels. This script also includes alerts for each signal highlighted.   SETTINGS   Breaker Blocks Length: Sensitivity of the detected swings used to construct breaker blocks. Higher values will return longer te
The Buyside & Sellside Liquidity indicator aims to detect & highlight the first and arguably most important concept within the ICT trading methodology,   Liquidity   levels. SETTINGS Liquidity Levels Detection Length: Lookback period Margin: Sets margin/sensitivity for a liquidity level detection Liquidity Zones Buyside Liquidity Zones: Enables display of the buyside liquidity zones. Margin: Sets margin/sensitivity for the liquidity zone boundaries. Color: Color option
This all-in-one indicator displays real-time market structure (internal & swing BOS / CHoCH), order blocks, premium & discount zones, equal highs & lows, and much more...allowing traders to automatically mark up their charts with widely used price action methodologies. Following the release of our Fair Value Gap script, we received numerous requests from our community to release more features in the same category. //------------------------------------// Version 1.x has missing functions + PDAr
The Breaker Blocks with Signals indicator aims to highlight a complete methodology based on breaker blocks. Breakout signals between the price and breaker blocks are highlighted and premium/discount swing levels are included to provide potential take profit/stop loss levels. This script also includes alerts for each signal highlighted.   SETTINGS   Breaker Blocks Length: Sensitivity of the detected swings used to construct breaker blocks. Higher values will return longer te
OVERVIEW K-means is a clustering algorithm commonly used in machine learning to group data points into distinct clusters based on their similarities. While K-means is not typically used directly for identifying support and resistance levels in financial markets, it can serve as a tool in a broader analysis approach. Support and resistance levels are price levels in financial markets where the price tends to react or reverse. Support is a level where the price tends to stop falling
The   ICT Unicorn Model   indicator highlights the presence of "unicorn" patterns on the user's chart which is derived from the lectures of   "The Inner Circle Trader" (ICT) . Detected patterns are followed by targets with a distance controlled by the user.   USAGE (image 2) At its core, the ICT Unicorn Model relies on two popular concepts, Fair Value Gaps and Breaker Blocks. This combination highlights a future area of support/resistance. A   Bullish Unicorn Pattern   consists ou
This is a Forex Scalping Trading Sytem based on the Bollinger Bands.  Pairs:Major Time frame: 1M or higher. Spread max:0,0001.  Indicators (just suggestion) Bollinger bands (20, 2); ADX (14 period); RSI   (7 period ). Y ou should only trade this system between 2am to 5am EST, 8am to 12am EST and 7.30pm to 10pm EST. Do not scalp 30 minutes before a orange or red news  report and not for a hour afterwards.   Setup: is for price to move above the lower or lower Bollinger Bands, RSI raise above the
FREE
The ICT Concepts indicator regroups core concepts highlighted by trader and educator "The Inner Circle Trader" (ICT) into an all-in-one toolkit. Features include Market Structure (MSS & BOS), Order Blocks, Imbalances, Buyside/Sellside Liquidity, Displacements, ICT Killzones, and New Week/Day Opening Gaps. It’s one kind of Smart money concepts.   USAGE:   Please read this   document  !      DETAILS Market Structure Market structure labels are constructed from price breaking a prior extreme
This indicator shows when user set sessions are active and returns various tools + metrics using the closing price within active sessions as an input. Users have the option to change up to 4 session times. The indicator will increasingly lack accuracy when the chart timeframe is higher than 1 hour. Settings Sessions Enable Session: Allows to enable or disable all associated elements with a specific user set session. Session Time: Opening and closing times of the user set session
This is addition of  Effective SV squeeze momentum  that add bolliger band and Keltner channel to chart window.  Squeeze momentum introduced by “John Carter”, the squeeze indicator for MT5 represents a volatility-based tool. Regardless, we can also consider the squeeze indicator as a momentum indicator, as many traders use it to identify the direction and strength of price moves. In fact, the Tradingview  squeeze indicator shows when a financial instrument is willing to change from a trending ma
FREE
All about Smart Money Concepts Strategy: Market struture: internal or swing BOS, CHoCH; Orderblock; Liquity equal; Fair Value Gap with Consequent encroachment, Balanced price range; Level with Previous month, week, day level or in day level (PMH, PWH, PDH, HOD); BuySell Stops Liquidity (BSL, SSL); Liquidity Void Long Wicks; Premium and Discount; Candle pattern ... "Smart Money Concepts" ( SMC ) is a fairly new yet widely used term amongst price action traders looking to more accurately navigate
The indicator returning pivot point based trendlines with highlighted breakouts . Trendline caculated by pivot point and other clue are ATR, Stdev. The indicator also includes integrated alerts for  trendlines  breakouts and foward message to Telegram channel or group if you want. Settings ·          Lookback bar: Default 200 is number of bar caculate when init indicator. ·          Length:  Pivot points  period ·          Slope Calculation Method: Determines how this lope is calculated. We supp
The indicator   returning pivot point based trendlines with highlighted breakouts . Trendline caculated by pivot point and other clue are ATR, Stdev.   The indicator also includes integrated alerts for  trendlines  breakouts   and foward message to Telegram channel or group if you want. Settings ·            Lookback bar: Default 200 is number of bar caculate when init indicator. ·            Length:  Pivot points  period ·            Slope Calculation Method: Determines how this lope is calcula
All about Smart Money Concepts Strategy: Market struture: internal or swing BOS, CHoCH; Orderblock; Liquity equal; Fair Value Gap with Consequent encroachment, Balanced price range; Level with Previous month, week, day level or in day level (PMH, PWH, PDH, HOD); BuySell Stops Liquidity (BSL, SSL); Liquidity Void Long Wicks; Premium and Discount; Candle pattern ... "Smart Money Concepts" ( SMC ) is a fairly new yet widely used term amongst price action traders looking to more accurately navigate
ICT Concepts
Minh Truong Pham
5 (2)
The ICT Concepts indicator regroups core concepts highlighted by trader and educator "The Inner Circle Trader" (ICT) into an all-in-one toolkit. Features include Market Structure (MSS & BOS), Order Blocks, Imbalances, Buyside/Sellside Liquidity, Displacements, ICT Killzones, and New Week/Day Opening Gaps. It’s one kind of Smart money concepts. USAGE: Please read this document  !    DETAILS Market Structure Market structure labels are constructed from price breaking a prior extreme point. T
The Bheurekso Pattern Indicator for MT5 helps traders automatically identify candlestick pattern that formed on the chart base on some japanese candle pattern and other indicator to improve accurate. This indicator scans all candles, recognizes and then displays any candle patterns formed on the chart. The candle displayed can be Bullish or Bearish Engulfing, Bullish or Bearish Harami, and so on. There are some free version now but almost that is repaint and lack off alert function. With this ve
The FollowLine indicator is a trend following indicator. The blue/red lines are activated when the price closes above the upper Bollinger band or below the lower one. Once the trigger of the trend direction is made, the FollowLine will be placed at High or Low (depending of the trend). An ATR filter can be selected to place the line at a more distance level than the normal mode settled at candles Highs/Lows. Some features: + Trend detech + Reversal signal + Alert teminar / mobile app
There are many linear regression indicators out there, most of them draw lines or channels, but this one actually draws a chart. The beauty of the indicator like Heiken Ashi is it removes a lot of market noise. 4 (OHLC) arrays are filled with Linear Regression(LR) values of each price for the LR period (default=14). The period of the Linear Regression is adjustable dependant on the market conditions. The SMA (default=14) also has period adjustment. Candles are generated with Green for 'Up' cand
The ICT Silver Bullet indicator is inspired from the lectures of "The Inner Circle Trader" (ICT) and highlights the Silver Bullet (SB) window which is a specific 1-hour interval where a Fair Value Gap (FVG) pattern can be formed. A detail document about ICT Silver Bullet   here . There are 3 different Silver Bullet windows (New York local time): The London Open Silver Bullet (3 AM — 4 AM ~ 03:00 — 04:00) The AM Session Silver Bullet (10 AM — 11 AM ~ 10:00 — 11:00) The PM Session Silver Bulle
The liquidity swings indicator highlights swing areas with existent trading activity. The number of times price revisited a swing area is highlighted by a zone delimiting the swing areas. Additionally, the accumulated volume within swing areas is highlighted by labels on the chart. An option to filter out swing areas with volume/counts not reaching a user-set threshold is also included. This indicator by its very nature is not real-time and is meant for descriptive analysis alongside other c
An Implied Fair Value Gap (IFVG) is a three candles imbalance formation conceptualized by ICT that is based on detecting a larger candle body & then measuring the average between the two adjacent candle shadows. This indicator automatically detects this imbalance formation on your charts and can be extended by a user set number of bars. The IFVG average can also be extended until a new respective IFVG is detected, serving as a support/resistance line. Alerts for the detection of bull
フィルタ:
レビューなし
レビューに返信
バージョン 1.1 2022.11.11
remove print("send telegram result")