MACD Divergence Pro
- インディケータ
- Andrey Dik
- バージョン: 1.10
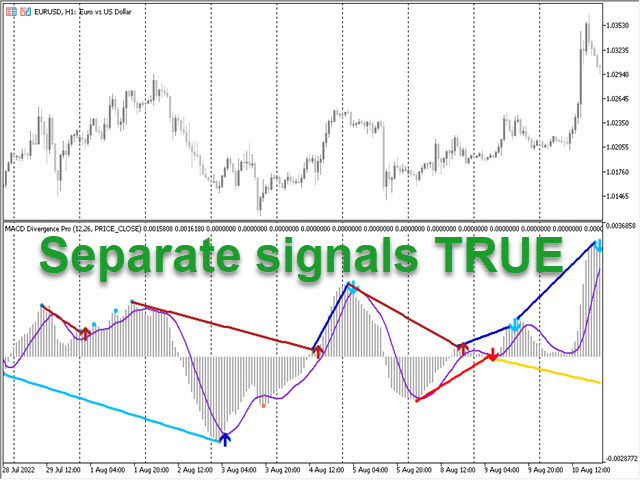
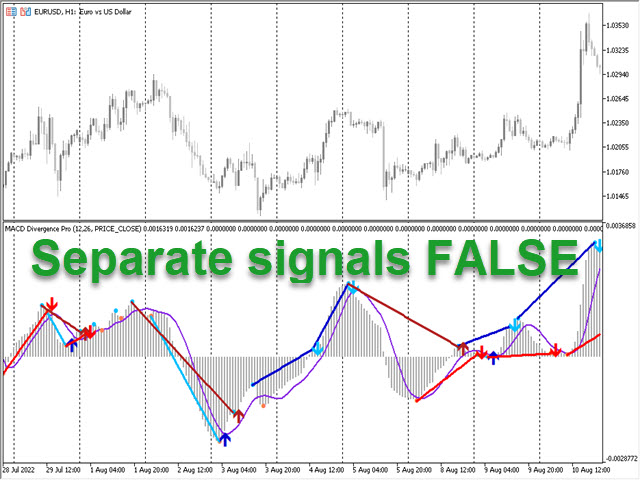
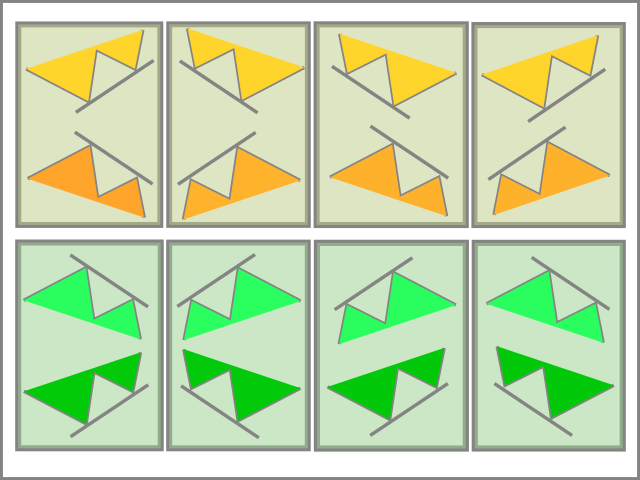
A unique professional tool is a divergence/convergence indicator between MACD and price, which allows you to receive a signal about a trend reversal in a timely manner or catch price pullback movements (depending on the settings). It is indispensable for those who trade divergences manually or with an Expert Advisor. The indicator settings allow you to adjust the strength of the divergence/convergence due to the angle of the MACD peaks and the percentage change in price, which makes it possible to fine-tune the signal strength. The indicator code is optimized and is tested very quickly as part of the Expert Advisor, does not use graphical objects. The indicator finds all 8 types of signals (see the schematic drawing). Each of the signals can be adjusted in the direction or disabled.
The indicator does not redraw, the arrows for the direction of transactions are located exactly where the signal appears - at the opening of the bar.
MACDsettings       = "=============="; //---------MACD settings---------
FastEMA            = 12;          //Fast period
SlowEMA            = 26;          //Slow period
SignalSMA          = 9;           //Signal SMA period
Price_P            = PRICE_CLOSE; //Price type

DivConSettings     = "=============="; //---Divergence/Convergence----
FractalLeftBars_P  = 1;           //Fractal left bars
FractalRightBars_P = 1;           //Fractal right bars
IndDivForce_P      = 1.0;         //Diver/Conver force of indicator
PriceDivForce_P    = 0.01;        //Diver/Conver force of price

SignalDirections   = "=============="; //---Signal Directions----
Diver_Conver_Dir   = forward;     //Diver/Conver signal direction
Conver_Diver_Dir   = forward;     //Conver/Diver signal direction
Parallel_Out_Dir   = forward;     //Parallel out signal direction
Parallel_In_Dir    = forward;     //Parallel in signal direction
OnlySeparately     = true;        //Separate signals only