Harmonic Pattern MAFA
- インディケータ
- Jhon Michael Antony Florez Roa
- バージョン: 1.0
- アクティベーション: 5
Functioning
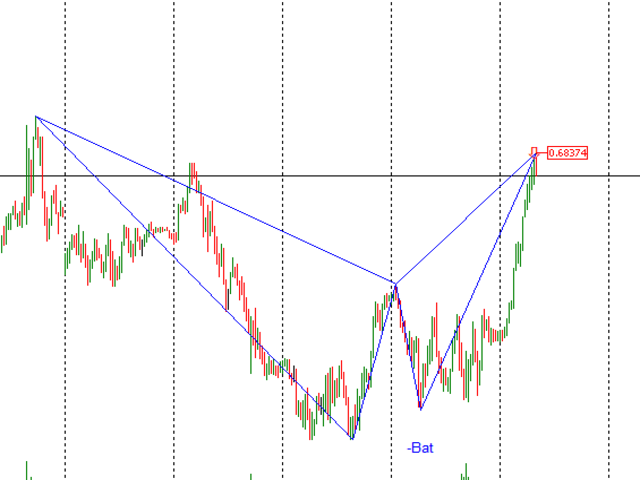
This Indicator, unlike the vast majority in the market, does not work with Zig-Zag, for this purpose a search algorithm (Heuristic Combinatorial Optimization Algorithm) of extreme points was designed that allows you to locate the points X, A B C and predict the D for the harmonic patterns and X, A, B and C for the golden pattern.
Being a heuristic search algorithm, it makes endpoints more efficient and realistic. Point X, for example, must be an extreme point in 40 candles around it, a difficult situation to achieve with Zig-Zag.
It is also important to clarify that the Golden Pattern is found, which adds value.
Patterns
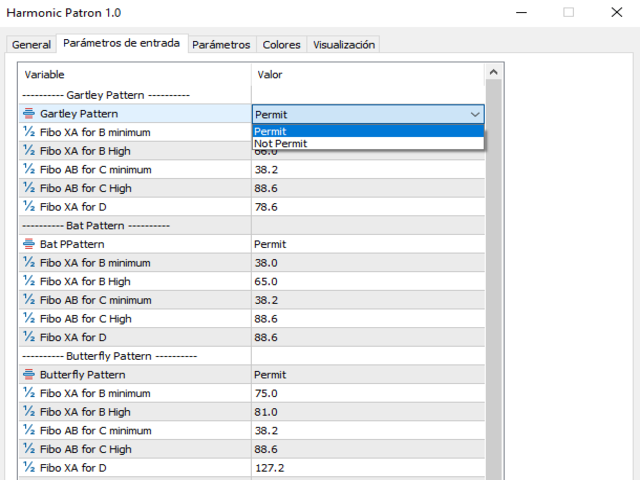
•Gartley
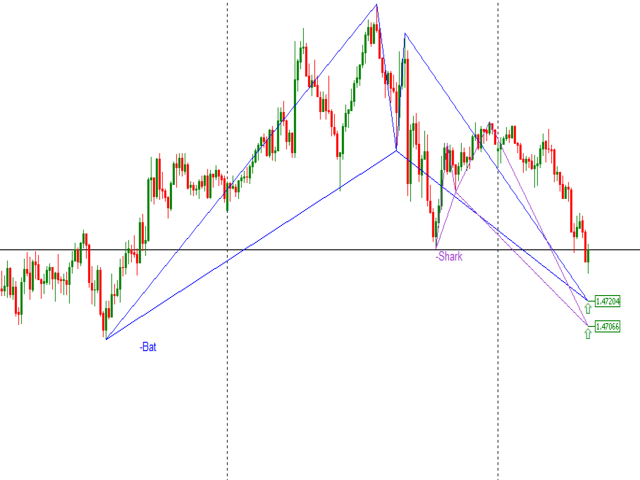
•Bat
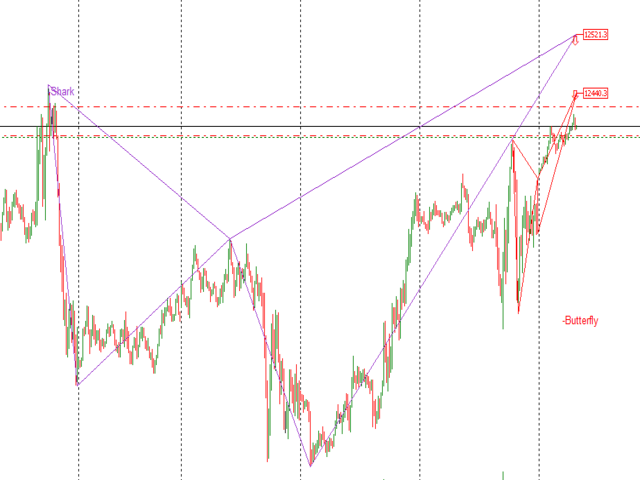
•Butterfly
•Crab
•Cypher
•Shark
•Aureo
Recommendations for use
It is recommended that the Metatrader Background Screen be Withe, to facilitate the identification of harmonic patterns, as well as the value of point D.


ユーザーは評価に対して何もコメントを残しませんでした