• 概要
  • レビュー
  • コメント

AIS Forest Fire Trend MT5

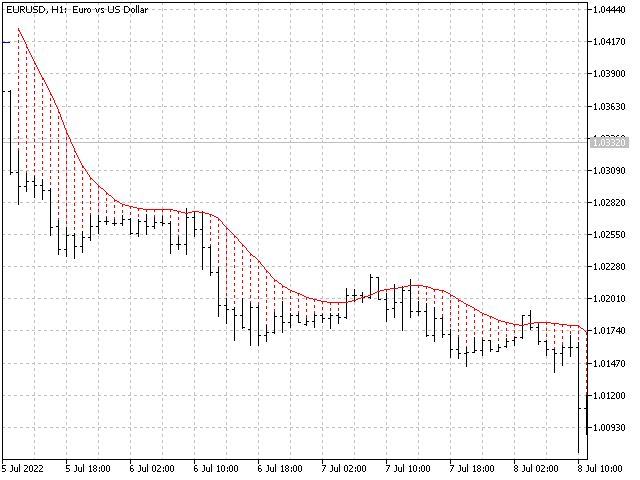
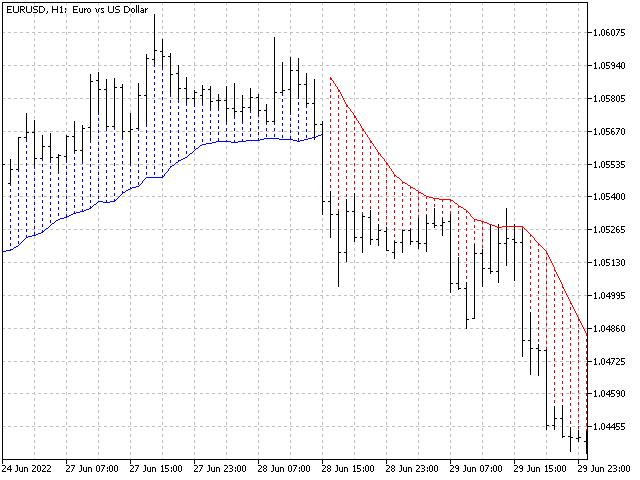
数列の一つに「森林火災数列」があります。これは、最も美しい新しいシーケンスの 1 つとして認識されています。その主な特徴は、このシーケンスが線形トレンドを回避することです。最短のものであってもです。この指標の基礎を形成したのはこのプロパティです。
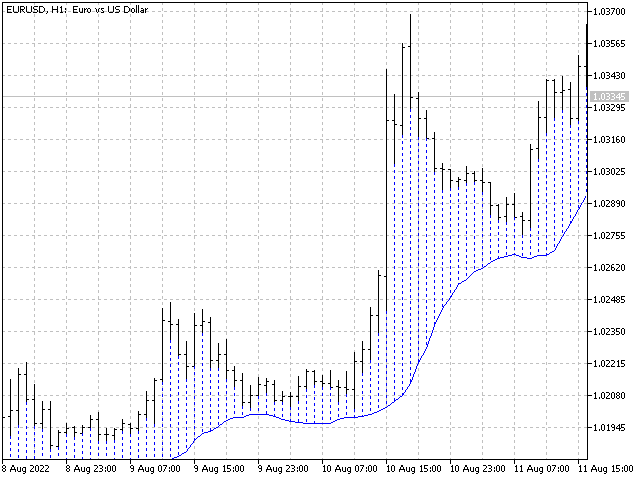
財務時系列を分析する場合、この指標は可能なすべての傾向オプションを拒否しようとします。そして失敗した場合にのみ、トレンドの存在を認識し、適切なシグナルを発します。このアプローチにより、新しいトレンドの始まりの瞬間を正しく判断できます。ただし、偽陽性の可能性もあります。それらの数を減らすために、このインジケーターに追加のフィルターが追加されました。新しいバーが開くとシグナルが生成されます。いずれの場合も再描画は発生しません。
指標パラメータ:
  • Applied Price - 適用価格定数;
  • Period Main - インディケータのメイン期間、その有効な値は 5 ~ 60 です。
  • Period Additional - 追加の期間。このパラメーターの有効な値は 5 ~ 40 です。
  • Signal Filter - 追加の信号フィルター、有効値 0 ~ 99;
  • Alerts - 有効にすると、新しいシグナルが表示されたときにインジケーターがアラートを出します。
  • Send Mail - インジケーターがメッセージを電子メールに送信できるようにします。
  • Push - プッシュ メッセージを送信できます。


おすすめのプロダクト
Noize Absorption Index - is the manual trading system that measures the difference of pressure between bears forces and bulls forces. Green line - is a noize free index that showing curent situation. Zero value of index shows totally choppy/flat market.Values above zero level shows how powerfull bullish wave is and values below zero measures bearish forces.Up arrow appears on bearish market when it's ready to reverse, dn arrow appears on weak bullish market, as a result of reverse expectation.
199 USD
Trend Fibonacci is a unique indicator that combines a power of Fibonacci sequences and ranges. How to read: - There are three zones --> red, gold and green - Red candlestick = downtrend - Green candlestick = uptrend   - Gold candlestick = no established trend Inputs: Per = number of bars used for calculations FirstRatio = first Fibonacci ratio (Or use any ratio you want) SecondRatio = second Fibonacci ratio (Or use any ratio you want) !! IF YOU PURCHASE THE INDICATOR, CONTACT ME FOR
47 USD
The trend is your friend! Look at the color of the indicator and trade on that direction. It does not  repaint. After each candle is closed, that's the color of the trend. You can focus on shorter faster trends or major trends, just test what's most suitable for the symbol and timeframe you trade. Simply change the "Length" parameter and the indicator will automatically adapt. You can also change the color, thickness and style of the lines. Download and give it a try! There are big movements
99 USD
Modified Rainbow
Rafael Alejandro Rey Alves
Modified Rainbow   The Modified Rainbow indicator is intended to work in different scenarios. The indicator uses a combination of technical indicators to detect buy or sell opportunities (different Moving Averages and other technical indicators). The indicator works with any currency pair, stocks, cryptocurrencies and synthetic indices. The indicator can be used for both traditional trading and binary options. The indicator works with any time frame, from M1 to MN. When the blue arrow
30 USD
プレミアムレベルは、正しい予測の精度が80%を超える独自の指標です。 この指標は、最高のトレーディングスペシャリストによって2か月以上テストされています。 あなたが他のどこにも見つけられない作者の指標! スクリーンショットから、このツールの正確さを自分で確認できます。 1は、1キャンドルの有効期限を持つバイナリーオプションの取引に最適です。 2はすべての通貨ペア、株式、商品、暗号通貨で機能します 手順: 赤い矢印が表示されたらすぐにダウントレードを開き、青い矢印が表示されたら閉じます。青い矢印の後に開くこともできます。 試してテストしてください!推奨設定はデフォルトです! 日足チャートで最高の精度を示します! インディケータは、2600 Pipsの収益性に対して、約10Pipsという非常に小さなマージンを使用します。
1 100 USD
Description : Rainbow EA MT5 is a simple Expert advisor based on   Rainbow MT5 indicator witch is based on Moving average with period 34. The indicator is incorporated in the EA, therefore, it is not required for the EA to operate, but if you wish, you can download it from   my product page . The Expert Advisor settings are as follows : Suitable for Timeframes up to H1 The parameters below can be set according to your trading rules. StopLoss ( Stop Loss in pips) TakeProfit ( Take Profit in pi
59 USD
ROMAN5 Time Breakout Indicator automatically draws the boxes for daily support and resistance breakouts. It helps the user identifying whether to buy or sell. It comes with an alert that will sound whenever a new signal appears. It also features an email facility. Your email address and SMTP Server settings should be specified in the settings window of the "Mailbox" tab in your MetaTrader 5. Blue arrow up = Buy. Red arrow down = Sell. You can use one of my Trailing Stop products that automatical
FREE
Do you, like me, like to trade with the trend? Then this indicator will help you! Rainbow Trend is a trend indicator, which uses several Moving Averages on the chart. It measures different trend strenght zones for different periods: very long term, long term, mid term, short term and very short term. Each zone has its color, and it is possible to have sound alert when the prices leaves a zone and enters another. Its configuration is very simple. If you find any bug or have any suggestions, co
30 USD
Be notified of every color change of Heiken Ashi (HA) candles. The indicator will trigger past and new signals every time that HA candles change their colors. ( Note : this tool is based on the code of Heiken Ashi indicator developed by MetaQuotes Software Corp.) Features The signals are triggered at closing of last bar/opening of a new bar; Any kind of alerts can be enabled: Dialog Box, Email message, SMS notifications for smartphones and tablets, and Sound alerts; By default, up arrows are p
35 USD
An indicator of pattern #31 ("Long Island") from Encyclopedia of Chart Patterns by Thomas N. Bulkowski. The second gap is in the opposite direction. Parameters: Alerts - show alert when an arrow appears   Push - send a push notification when an arrow appears (requires configuration in the terminal) GapSize - minimum gap size in points ArrowType - a symbol from 1 to 17 ArrowVShift - vertical shift of arrows in points   ShowLevels - show levels ColUp - color of an upward line ColDn - color of a
30 USD
US30NinjaMT5
Satyaseelan Shankarananda Moodley
US30 Ninja is a 5 minute scalping indicator that will let know you when there is a trade set up (buy or sell). Once the indicator gives the trade direction, you can open a trade and use a 30 pip stop loss and a 30 pip to 50 pip take profit. Please trade at own own risk. This indicator has been created solely for the US30 market and may not yield positive results on any other pair. 
30 USD
Laguerre SuperTrend Clouds   adds an Adaptive Laguerre averaging algorithm and alerts to the widely popular SuperTrend indicator. As the name suggests,   Laguerre SuperTrend Clouds (LSC)   is a trending indicator which works best in trendy (not choppy) markets. The SuperTrend is an extremely popular indicator for intraday and daily trading, and can be used on any timeframe. Incorporating Laguerre's equation to this can facilitate more robust trend detection and smoother filters. The LSC uses the
30 USD
The indicator generates early signals basing on ADX reading data combined with elements of price patterns. Works on all symbols and timeframes. The indicator does not redraw its signals. You see the same things on history and in real time. For better visual perception signals are displayed as arrows (in order not to overload the chart). Features The best results are obtained when the indicator works on two timeframes. For example: M30 – the indicator shows the main trend; M5 – the indicator ge
30 USD
Tunafish EA
Ismaele Daniele Lodetti
Tunafish EA is the most efficient EA on my profile. I spent a lot of time and effort to make this software sophisticated with possibilities of high potential returns while keeping the drawdown below 25%. The algorithms of the robot provide investors of any level of training with an investment opportunity that is both safe and aggressive. Tunafish EA imitating the work of the brain, capable of learning and adapting to changing conditions and predicting situations. When applied to trading in fina
69 USD
インディケータは、フィボナッチのサポートとレジスタンスのレベルを自動的に計算してプロットします。これは、市場分析に最も効果的なツールの1つです。 計算では、選択した期間と時間枠の平均価格データが使用されます。この期間の最小値と最大値は、移動の開始と終了と見なされます。 フィボナッチレベルを使用すると、価格の動きが遅くなったり逆転したりする可能性のある潜在的な参照ポイントを確認できます。つまり、フィボナッチレベルは、さらなる動きを予測したり、ストップ注文や指値注文を行うために使用されます。 パラメーター: PartsShow-現在のバーから表示された履歴レベルの数 CalcPeriod-価格平均期間 SmoothingMethod-価格平均化方法(26オプション) TF-計算に使用される時間枠 LevelColor-レベルラインの色 ZeroLevelColor-ゼロレベルの色 ShowVerticalLine-レベル間の垂直線の表示を有効/無効にします VLineStyle-垂直線のスタイル VLineColor-垂直線の色 ShowInfo-レベルパーセンテージの値に関する情報をラベ
30 USD
Renko Gold
Ignacio Agustin Mene Franco
Renko Gold! clearly indicates the floors and ceilings where it goes from 4 lines, the line below that marks the floor in green confirming with the thinnest line clarifies the purchase entry, the same is for sale, the top line marks the ceiling and the thinnest red line marks the sale, This indicator works for all temporalities! For Forex and Synthetic Indices markets! It also works for crypto markets! Good profit! World Investor.
40 USD
Awesome Oscillator by Bill Williams with the ability to fine-tune and replace the averaging algorithms of the indicator, which significantly expands the possibilities of using this oscillator in algorithmic trading and brings it closer in its properties to such an indicator as the MACD. To reduce price noise, the final indicator is processed with an additional Smooth averaging. The indicator has the ability to give alerts, send mail messages and push signals when the direction of movement of th
40 USD
Improved version of the free HMA Trend indicator (for MetaTrader 4) with statistical analysis. HMA Trend is a trend indicator based on the Hull Moving Average (HMA) with two periods. HMA with a slow period identifies the trend, while HMA with a fast period determines the short-term movements and signals in the trend direction. The main differences from the free version: Ability to predict the probability of a trend reversal using analysis of history data. Plotting statistical charts for analyz
30 USD
Fractal 358 Plus is a predictive indicator that provides the clearest sight of price movements. Identifying graphic patterns such as Caixote (Crate), Pivot and Inside Candle , it shows entries and exits spots, as well as threats to your trades in the markets. It comes ready to use with B3 Mini Index (WIN$ series) and can be adjusted to use with any asset and timeframe. Fractal 358 unravels price movement Based on the Fibonacci sequence, Fractal 358 is a new and different way of reading and un
75 USD
Volality Index scalper indicator  Meant for Volality pairs such as Volality 10, 25, 50, 75 and 100 The indicator works on all timeframes from the 1 minute to the monthly timeframe the indicator is non repaint the indicator has 3 entry settings 1 color change on zero cross 2 color change on slope change 3 color change on signal line cross Orange line is your sell signal Blue line is your buy signal.
35 USD
Follow The Line MT5
Oliver Gideon Amofa Appiah
4.26 (23)
This indicator obeys the popular maxim that: "THE TREND IS YOUR FRIEND" It paints a GREEN line for BUY and also paints a RED line for SELL. (you can change the colors). It gives alarms and alerts of all kinds. IT DOES NOT REPAINT and can be used for all currency pairs and timeframes. Yes, as easy and simple as that. Even a newbie can use it to make great and reliable trades. NB: For best results, get my other premium indicators for more powerful and reliable signals. Get them here: https://www.m
FREE
The Universal Trend indicator was created to detect trends in price movement and allows you to quickly determine not only the direction of the trend, but also understand the levels of interaction between buyers and sellers. The indicator works on all timeframes and currency pairs. The indicator gives fairly accurate signals and it is customary to use it both in trending and flat markets. It is advisable to use the indicator in combination with other tools for more reliable signals and making a
111 USD
ローンチプロモーション: 現在の価格で入手可能な限定数のコピー 最終価格: 990$ NEW: 無料で EA を 1 つゲット!   (2取引口座の場合) DayTrade Pro アルゴリズムへようこそ!   何年にもわたって市場を研究し、さまざまな戦略をプログラミングしてきた結果、優れた取引システムに必要なすべてを備えたアルゴリズムを見つけました。 ブローカーに依存しない スプレッド インディペンデント MT4、MT5、TDS2、および複数のブローカーで、実際の変数スプレッドテストを使用して非常に安定したバックテストを簡単に示します 何百もの異なる設定はすべて、テストで有益な結果をもたらします (もちろん、私は最高のものを選択しました!) 非常に堅牢なシステム -> 設定は交換可能であるため、USDJPY からの設定で EURUSD を実行すると、引き続き利益を得ることができます。   EURUSD;GBPUSD;USDJPY;AUDUSD;XAUUSD;GBPJPY;USDCAD;EURJPY;EURNZD;EURAUD;NZDUSD;AUDJPY;CHFJPY; この
299 USD
The best time to trade Using this Indicator is when the time reach exactly hour,half,45 minutes,15 minutes and sometimes 5 minutes.. This indicators is helpful to those who trade boom and crash indecies.How to read this indicator first you'll see Blue allow and Red allow all these allows used to indicate or to detect the spike which will happen so the allow happens soon before the spike happen.This indicator works properly only in boom and crash trading thing which you have to consider when
30 USD
MT5インジケーター。 3つのレベルのフィボナッチサポートとレジスタンスレベルが自動的に描画されます。 彼らです: 月レベル:ミディアムオーキッド ウィークリーレベル:オレンジレッド デイラインレベル:ターコイズ 色はパラメータで調整できます。 この指標は主に、より良いトレード分析のために将来のサポートとレジスタンスレベルを分析するために使用されます。 サポートレベルが何度も効果的にサポートされている場合、市場は以前の最高点を突破し、効果的なトレンドブレイクアウトは長くなります。 下降後、市場は何度も圧力レベルを超えることはできず、その後下降して以前の低価格を再び突破し、効果的なトレンドはショートポジションを突破します。 市場が過去の高値または安値の領域に達すると、チャートには2レベルのFibonacii線のみが描画され、インジケーターは市場の特定のスペースを待つ必要があるため、通常のレベルのプロンプトは表示されません。描画する前に引き戻すには、インジケーターが自動的に描画します。高価格帯でのフィルター処理された小さな変動は、短期間の有効なサポ
40 USD
Multi-currency and multi-timeframe Heikin Ashi indicator. Shows the current state of the market. On the scanner panel you can see the direction, strength and number of bars of the current trend. The Consolidation/Reversal candles are also shown using color. You can specify any desired currencies and periods in the parameters. Also, the indicator can send notifications when the trend changes or when reversal and consolidation candles (dojis) appear. By clicking on a cell, this symbol and period w
30 USD
A professional tool for trading - the divergence indicator between the  Stochastic and the price, which allows you to receive a signal about a trend reversal in a timely manner or catch price pullback movements (depending on the settings). The indicator settings allow you to adjust the strength of the divergence due to the angle of the  Stochastic peaks and the percentage change in price, which makes it possible to fine-tune the signal strength. The indicator code is optimized and is tested ver
37 USD
Alpha Binary Pro
Rafael Alejandro Rey Alves
1 (1)
The Alpha Binary Pro indicator is intended to work in different scenarios. This indicator uses a combination of technical indicators to detect buy or sell opportunities. The indicator works with any currency pair, stocks, cryptocurrencies and synthetic indices. The indicated can be used for both traditional trading and binary options. The indicator works with any time frame, from M1 to MN. When the blue arrow is pointing upwards this indicates that the signal is to buy. When the red
30 USD
Magic Channel MT5は、MetaTrader5ターミナルのチャネルインジケーターです。この指標により、最も可能性の高いトレンド反転ポイントを見つけることができます。 ほとんどのチャネルインジケータとは異なり、Magic Channelは再描画しません。 アラートシステム(アラート、電子メール、プッシュ通知)は、複数の取引商品を同時に監視するのに役立ちます。 インジケーターをチャートに添付すると、シグナルが発生するとアラートがトリガーされます。 私たちのアラートシステムを使用すると、単一のポジション開始信号を見逃すことはありません! 利点 スキャルピングに最適です。 トレンドの逆転を特定するのに最適です。 初心者や経験豊富なトレーダーに適しています。 すべての時間枠で動作します。 インジケーターは再描画されません。 柔軟なアラートシステム。 チャートのカスタマイズ(線のサイズと色)。 使用上の推奨事項 価格がインジケーターの下線を上向きに横切ったときに購入します(スクリーンショット1を参照、エントリーポイントは丸で囲まれています)。 価格が
35 USD
PipFinite Trend PRO MT5
Karlo Wilson Vendiola
4.86 (657)
Breakthrough Solution For Trend Trading And Filtering With All Important Features Built Inside One Tool! Trend PRO's smart algorithm detects the trend, filters out market noise and gives entry signals with exit levels. The new features with enhanced rules for statistical calculation improved the overall performance of this indicator. Important Information Revealed Maximize the potential of Trend Pro, please visit www.mql5.com/en/blogs/post/713938 The Powerful Expert Advisor Version Automa
98 USD
このプロダクトを購入した人は以下も購入しています
ICT, SMC, SMART MONEY CONCEPTS, SMART MONEY, Smart Money Concept, Support and Resistance, Trend Analysis, Price Action, Market Structure, Order Blocks, BOS/CHoCH,   Breaker Blocks ,  Momentum Shift,   Supply&Demand Zone/Order Blocks , Strong Imbalance,   HH/LL/HL/LH,    Fair Value Gap, FVG,  Premium  &   Discount   Zones, Fibonacci Retracement, OTE, Buy Side Liquidity, Sell Side Liquidity, BSL/SSL Taken, Equal Highs & Lows, MTF Dashboard, Multiple Time Frame, BigBar, HTF OB, HTF Market Structur
65 USD
これはMT5のインジケーターで、再描画なしで取引に参入するための正確なシグナルを提供します。 外国為替、暗号通貨、金属、株式、インデックスなど、あらゆる金融資産に適用できます。かなり正確な見積もりを提供し、取引を開始して終了するのに最適な時期を教えてくれます。1つのシグナルを処理しただけでインジケーターの元が取れた例の 動画 (6:22)をご覧ください。Entry PointsPro インジケーターの助けを借りたほとんどのトレーダーの最初の1週間の結果が改善しています。 Telegramグループ に登録してください。Entry Points Proインジケーターのメリットは次の通りです。 再描画のないエントリーシグナル 再描画されるインジケーターでは一度表示されたシグナルが削除されて大きな金銭的損失につながることがありますが、これと異なり、表示されて確認されたシグナルは消えることがありません。 エラーなしの取引開始 インジケーターアルゴリズムによって取引を開始する(資産を売買する)理想的な瞬間を見つけることができます。それを使用するすべてのトレーダーの成功率が向上します。
125 USD
1 つのシステムでのトレンド レベルとブレイクダウン レベルの組み合わせ。高度なインジケーター アルゴリズムは、市場のノイズをフィルター処理し、トレンド、エントリー ポイント、および可能なエグジット レベルを決定します。インジケーターシグナルは統計モジュールに記録されるため、最適なツールを選択してシグナル履歴の有効性を示すことができます。この指標は、テイクプロフィットとストップロスのマークを計算します。 マニュアルと説明書 ->   ここ / MT4 バージョン ->   ここ インジケーターで取引する方法: Trend Predictor での取引は、たった 3 つの簡単なステップです。 ステップ 1 - ポジションを開く 70% 以上の成功率で買いシグナルが受信されました ステップ 2 - ストップロスの決定 逆信号でトランクを選択 ステップ 3 - テイクプロフィット戦略の定義 戦略 1: TP1 に到達したらポジション全体をクローズする 戦略 2: TP1 に達した時点でポジションの 50% をクローズし、TP2 に達した時点で残りの 50% をクローズします。 戦略 3:
55 USD
トレンドインジケーター、1つのツールに組み込まれたすべての重要なトレンド機能を備えたトレンドトレーディングとフィルタリングのための画期的なユニークなソリューション! これは、すべてのシンボル/商品(外国為替、商品、暗号通貨、インデックス、株式)で使用できる100%再描画されていないマルチタイムフレームおよびマルチ通貨インジケーターです。 トレンドスクリーナーは、チャート内のドットで矢印トレンドシグナルを提供するインジケーターに続く効率的なインジケーターです。 トレンド分析インジケーターで使用できる機能: 1.トレンドスキャナー。 2.最大利益分析を備えたトレンドライン。 3.トレンド通貨強度メーター。 4.アラート付きのトレンド反転ドット。 5.アラート付きの強いトレンドドット。 6.トレンド矢印 毎日の分析例、毎日のシグナルパフォーマンス...など、トレンドスクリーナーインジケーターを使用して、ここで見つけることができます: ここをクリックしてください トレンドスクリーナーMT4バージョンはこちらから入手できます: https://www.mql5.com/en/market/pro
50 USD
ブレーカートレーダーになり、価格が反転すると市場構造からの利益が変化します。 注文ブロックブレーカーインジケーターは、トレンドまたは価格の動きが枯渇に近づいており、逆転の準備ができていることを識別します。通常、反転または大規模なプルバックが発生しようとしているときに発生する市場構造の変化について警告します。 この指標は、ブレイクアウトと価格の勢いを識別する独自の計算を使用します。使い果たされる可能性のあるポイントの近くで新しい高値が形成されるたびに、インディケーターはその高値の作成を担当する最後の注文ブロックを描きます。次に、移動する価格とともに注文ブロックを追跡します。その後、価格が反対方向にシフトし、その注文ブロックを突破すると、新しい市場構造を作成し、トレンドまたは大きな後退の可能性のある反転の開始を警告します。 注文ブロックは、高値/安値が作成される前の最後の反対色のろうそくであり、価格がこれらの重要な領域を下抜けすると、トレンドの短期的ま​​たは長期的な反転の兆候です。 特徴 重要な枯渇点での市場構造の変化を警告します 価格が使い果たされるレベルに近づくと、
49 USD
Matrix Arrow Indicator MT5
Juvenille Emperor Limited
5 (11)
マトリックスアローインジケーターMT5は、すべてのシンボル/商品(外国為替、商品、暗号通貨、インデックス、株式)で使用できる100%再描画されていないマルチタイムフレームインジケーターに続くユニークな10in1トレンドです。マトリックスアローインジケーターMT5は、初期段階で現在のトレンドを判断し、最大10の標準インジケーターから情報とデータを収集します。 平均方向移動指数(ADX) 商品チャネルインデックス(CCI) クラシック平研アシキャンドル 移動平均 移動平均収束発散(MACD) 相対活力指数(RVI) 相対力指数(RSI) 放物線SAR ストキャスティクス ウィリアムズのパーセント範囲 すべてのインジケーターが有効な買いまたは売りシグナルを与えると、対応する矢印がチャートに印刷され、次のろうそく/バーの開始時に強い上昇トレンド/下降トレンドを示します。ユーザーは、使用するインジケーターを選択し、各インジケーターのパラメーターを個別に調整できます。マトリックスアローインジケーターMT5は選択されたインディケーターからのみ情報を収集し、それらのデータのみに基づいてアローを印
75 USD
インジケーターガイド  |  Owl Smart Levels戦略   |   MT4版  |  インストールする方法?   |   FAQ Owl Smart Levels Indicator は、 Bill Williams の高度なフラクタル、市場の正しい波構造を構築する Valable ZigZag、エントリの正確なレベルをマークする Fibonacci レベルなどの一般的な市場分析ツールを含む 1 つのインジケーター内の完全な取引システムです。 利益を得るために市場と場所に。 取引システムの詳細な説明については、 Owl Trend Strategy - Smart Levels の記事を参照してください  力はシンプルさにあります! Owl Smart Levels 取引システムは非常に使いやすいので、専門家にも、市場を勉強し始めて自分で取引戦略を選択し始めたばかりの人にも適しています。 戦略と指標に秘密の数式や計算方法が隠されているわけではなく、すべての戦略指標は公開されています。 Owl Smart Levels を使用すると、取引を開始するためのシグナルをすばやく
97 USD
TPA True Price Action indicator reveals the true price action of the market makers through 100% non-repainting signals strictly at the close of a candle! TPA shows entries and re-entries, every time the bulls are definitely stronger than the bears and vice versa. Not to confuse with red/green candles. The shift of power gets confirmed at the earliest stage and is ONE exit strategy of several. There are available now two free parts of the TPA User Guide for our customers. The first "The Basics"
168 USD
Supply Demand uses previous price action to identify potential imbalances between buyers and sellers. The key is to identify the better odds zones, not just the untouched ones. Blahtech Supply Demand indicator delivers functionality previously unavailable on any trading platform. This 4-in-1 indicator not only highlights the higher probability zones using a multi-criteria strength engine, but also combines it with multi-timeframe trend analysis, previously confirmed swings and engulfing detecto
99 USD
Market Profile defines a number of day types that can help the trader to determine market behaviour. A key feature is the Value Area, representing the range of price action where 70% of trading took place. Understanding the Value Area can give traders valuable insight into market direction and establish the higher odds trade. It is an excellent addition to any system you may be using. Blahtech Limited presents their Market Profile indicator for the MetaTrader community. Inspired by Jim Dalton’s
99 USD
Blahtech VWAP - Volume Weighted Average Price (VWAP) is the ratio of price to total volume. It provides an average price over a specified time interval.  Links [  Install  |  Update  |  Documentation   ] Feature Highlights Configurable VWAP Line Sessions, intervals, anchored or continuous Previous day settlement line Standard Deviation bands Alerts at bar close or real time Automatic Broker or Tick volumes Significantly reduced CPU usage Input Parameters Max Bars   - Restrict the number of
49 USD
XQ Indicator MT5
Marzena Maria Szmit
5 (1)
The signal conditions are a combination of three indicators, and XQ Forex Indicators only display  medium and long-term trends . The indicator's efficacy has been improved with the addition of a filter that blocks out false signals. The XQ Forex Indicator can be used on  FX pairs, CFDs, and Cryptocurrencies . There are two type of signals:  Buy or Sell and Big Long or Big Short It is possible to enable sending emails when a major trend-change signal is detected, as well as to display the alerts
149 USD
現在33%オフ 初心者にもエキスパートトレーダーにも最適なソリューション このインジケーターは独自の機能と新しい公式を多数内蔵しており、ユニークで高品質かつ手頃な取引ツールです。このアップデートでは、2つの時間枠ゾーンを表示できるようになります。より長いTFだけでなく、チャートTFとより長いTF(ネストゾーンを表示)の両方を表示できます。すべてのSupply Demandトレーダーの皆さんのお気に召すはずです。:) 重要情報の公開 Advanced Supply Demandの可能性を最大化するには、 https://www.mql5.com/ja/blogs/post/720245 にアクセスしてください。   エントリーまたはターゲットの正確なトリガーポイントを正確に特定できれば取引がどのように改善されるか想像してみてください。新しい基盤となるアルゴリズムに基づいて構築されているため、買い手と売り手の間の潜在的な不均衡をさらに簡単に特定できます。これは、最も強い需要と供給のゾーンと、過去のパフォーマンス(古いゾーンを表示)がグラフィカルに表現されるためです。これらの機能は、最適
199 USD
MetaBands M5
Vahidreza Heidar Gholami
5 (2)
MetaBandsは、強力でユニークなアルゴリズムを使用してチャンネルを描画し、トレンドを検出して、トレーダーに取引の入出ポイントを提供することができます。チャンネル指標に加えて、強力なトレンド指標でもあります。入力パラメータを使用して新しいチャンネルを作成するために、異なるタイプのチャンネルを統合することができます。MetaBandsは、市場のイベントについてユーザーに通知するために、すべてのタイプのアラートを使用します。 特徴 ほとんどのチャンネルアルゴリズムをサポート 強力なトレンド検出アルゴリズム 異なるタイプのチャンネルを統合する能力 マルチタイムフレームおよびマルチカレンシー(シグナルマトリックス) すべてのタイプのアラート機能(サウンド、画面フラッシャー、プッシュ通知、メール、ポップアップ、矢印) 再描画しない トレンド検出 MetaBandsは、チャネル内を振動する青いラインを使用してトレンドを検出します。ラインがチャネルの上部バンドに達すると、下降トレンドの開始を示し、下部バンドに達すると上昇トレンドの開始を示します。青いラインが中心ラインに近づくと、市場はコンソ
129 USD
トレンドラインマップインジケーターは、トレンドスクリーナーインジケーターのアドオンです。トレンドスクリーナー(トレンドラインシグナル)によって生成されたすべてのシグナルのスキャナーとして機能します。 これは、トレンドスクリーナーインジケーターに基づくトレンドラインスキャナーです。 Trend Screener Pro インジケーターがない場合、Trend Line Map Proは機能しません。 It's a Trend Line Scanner based on Trend Screener Indicator. If you don't have Trend Screener Pro Indicator,     the Trend Line Map Pro will not work . ブログにアクセスすると、トレンドラインマップインジケーターの無料バージョンをダウンロードできます。 Metatrader Testerの制限なしで、購入する前に試してみてください。 :  ここをクリック 1.簡単になる利点 通貨と時間枠に基づいて売買シグナルを表示し
50 USD
Auto Order Block with break of structure Detect Break of Structure , Mark Order Block and draw Entry / Stop and Risk to Reward lines when Order block is touch by price with Alert. Trend is Manually set to filter signals in a direction by a button on the chart. Entry / Stop and Risk to Reward lines can also be switch on / off by button on chart. Futures Auto Mark Break of Structure Auto Mark Order block Auto Mark higher time frame Point Of  Interest ( POI ) Popup Alert when BoS , Order block
55 USD
Introduction to X3 Chart Pattern Scanner X3 Cherart Pattern Scanner is the non-repainting and non-lagging indicator detecting X3 chart patterns including Harmonic pattern, Elliott Wave pattern, X3 patterns, and Japanese Candlestick patterns. Historical patterns match with signal patterns. Hence, you can readily develop the solid trading strategy in your chart. More importantly, this superb pattern scanner can detect the optimal pattern of its kind. In addition, you can switch on and off individu
250 USD
BUY INDICATOR AND GET EA FOR FREE AS A BONUS + SOME OTHER GIFTS! ITALO VOLUME INDICATOR  is the best volume indicator ever created, and why is that? The Indicator works on all time-frames and assets, indicator built after 6 years of experience on forex and many other markets. You know many volume indicators around the internet are not complete, does not help, and it's difficult to trade, but the Italo Volume Indicator is different , the Italo Volume Indicator shows the wave volume, when market
65 USD
**   All Symbols   x   All Timeframes   scan just by pressing scanner button ** *** Contact me immediately after the purchase to send you instructions and add you in "Market Structure group" for sharing or seeing experiences with other users. CURRENT PRICE $39..... Future Price $200 Introduction: Market structure is important for both new and professional traders since it can influence the liquidity and price action of a market. It’s also one of the most commonly used techniques to understand tr
39 USD
Introduction to EFW Analytics EFW Analytics was designed to accomplish the statement "We trade because there are regularities in the financial market". EFW Analytics is a set of tools designed to maximize your trading performance by capturing the repeating fractal geometry, known as the fifth regularity in the financial market. The functionality of EFW Analytics consists of three parts. Firstly, Equilibrium Fractal Wave Index is an exploratory tool to support your trading logic to choose which r
200 USD
支持線と抵抗線、そしてローソク足のギャップをチャート上に自動的に表示するため、価格が次に向かう可能性のある場所や反転する可能性のある場所を確認することができます。 このインジケーターは、私のウェブサイト(The Market Structure Trader)で教えているポジショントレード手法の一部として使用するように設計されており、ターゲットとエントリーの可能性のための重要な情報を表示します。 MT4 Version:  https://www.mql5.com/en/market/product/97246/ このインジケーターには、2つのコア機能と4つの追加機能があります: コア機能1 - 日足、週足、月足のサポートラインとレジスタンスラインの自動表示 このインジケーターは、直近2日間、最大6週間前、数ヶ月前のサポートレベルとレジスタンスレベルを自動的に引き込みます。これらのレベルの見た目は完全にカスタマイズすることができ、いくつ表示されるかを表示することもできます。これらの重要な水準は、しばしば主要な支持線と抵抗線として機能し、価格が転換して引き戻されたり反転したりする場
49 USD
FX Volume MT5
Daniel Stein
4.77 (13)
スマートマネーを追うことがついに可能に FX Volumeは、ブローカーの視点から市場のセンチメントをリアルに洞察する、最初で唯一のボリューム指標です。 ブローカーのような機関投資家がFX市場でどのようなポジションをとっているか、COTレポートよりはるかに速く、素晴らしい洞察を提供します。 この情報をチャート上で直接見ることは、あなたの取引にとって真のゲームチェンジャーであり、画期的な解決策です。 基本チュートリアル → "FX出来高を使った取引方法" をお読みください。 よくある質問、取引のヒント、チュートリアルビデオなど、より多くの情報を私たちの FX Volume情報公開チャンネル SI Connectをインストールして実行 し、弊社データセンターへの常時接続を確立してください。 背景情報 私たちは皆、FXが分散型市場であることを知っています。そのため、私たちは既成概念にとらわれず、ユニークなソリューションを開発し、この貴重な情報を私たちのチャートに取り込むために、これまでで最も複雑なプロジェクトをコード化する必要がありました。2018年10月以来、私たち
33 USD
サポートとレジスタンススクリーナーは、1つのインジケーター内に複数のツールを提供するMetaTraderの1つのレベルインジケーターにあります。 利用可能なツールは次のとおりです。 1.市場構造スクリーナー。 2.強気のプルバックゾーン。 3.弱気プルバックゾーン。 4.デイリーピボットポイント 5.毎週のピボットポイント 6.毎月のピボットポイント 7.ハーモニックパターンとボリュームに基づく強力なサポートとレジスタンス。 8.銀行レベルのゾーン。 期間限定オファー:HVサポートおよびレジスタンスインジケーターは、50ドルと生涯でのみご利用いただけます。 (元の価格125 $) MQL5ブログにアクセスすると、分析例を含むすべてのプレミアム指標を見つけることができます。 ここをクリックしてください。 主な機能 ハーモニックおよびボリュームアルゴリズムに基づく強力なサポートおよびレジスタンスゾーン。 ハーモニックおよびボリュームアルゴリズムに基づく強気および弱気のプルバックゾーン。  市場構造スクリーナー 毎日、毎週、毎月のピボットポイント。 ドキュメント すべてのサ
50 USD
Forex Master Pattern
Alberto Gauer Borrego
4.8 (10)
The Forex Master Pattern  is an alternative form of technical analysis that provides a framework which will help you to find and follow the hidden price pattern that reveals the true intentions of financial markets. This algorithm here does a good job detecting the Phase 1 of the Forex Master Pattern cycle, which is the contraction point (or Value).  On Phase 2 we get higher timeframe activation (also called Expansion), which is where price oscillates above and below the average price defined
49 USD
Buy and sell signals based on Larry Williams's exponential moving average strategies 9.1, 9.2, 9.3 and 9.4 for trend reversals and continuations. To understand the logic and how to trade the signals, please check: Setup 9.1:  https://www.mql5.com/pt/market/product/50986 Setup 9.2:  https://www.mql5.com/pt/market/product/52268 Setup 9.3:  https://www.mql5.com/pt/market/product/52269 Setup 9.4:  https://www.mql5.com/pt/market/product/52273 Notices:  - This indicator displays a lot of signals.
199 USD
Stargogs Spike Catcher V3.11 This Indicator is Developed To milk the BOOM and CRASH indices . Send me Message if you need any help with the indicator.  CHECK OUT THE STARGOGS SPIKE CATCHER EA/ROBOT V3: CLICK HERE ALSO CHECK OUT SECOND TO NONEFX SPIKE CATCHER:   CLICK HERE STARGOGS SPIKE CATCHER V3.11 WHATS NEW! Brand New Strategy. This is the Indicator you need for 2023. The Indicator Gives you an Entry at a time when conditions are met and you should use TP & SL. New Trendline that changes col
100 USD
Introduction to Fractal Pattern Scanner Fractal Indicator refers to the technical indicator that makes use of the fractal geometry found in the financial market. Fractal Pattern Scanner is the advanced Fractal Indicator that brings the latest trading technology after the extensive research and development work in the fractal geometry in the financial market. The most important feature in Fractal Pattern Scanner is the ability to measure the turning point probability as well as the trend probabil
185 USD
トレンド チーフは、市場のノイズを除去し、トレンド、エントリー ポイント、および可能なエグジット レベルを決定する高度なインジケーター アルゴリズムです。 スキャルピングには短い時間枠を使用し、スイング取引には長い時間枠を使用します。 Trend Chief は、通貨、金属、暗号通貨、株式、指数など、すべてのメタトレーダー シンボルに最適です。 * トレンド チーフ インジケーターの使用方法: - 日足チャートとH4チャートを見てメイントレンドを把握 - トレンドが上昇している場合は、m15 のような短い時間枠に移動し、取引を行う前に価格がメインのグリーン ラインを超えるまで待ちます。他のすべてのラインもグリーンである必要があります。 - トレンドが下降している場合は、m15 などの短い時間枠に移動し、価格がメインの赤い線を下回るまで待ってから取引を行います。他のすべての線も赤である必要があります。 - ラインの色が変わったら取引を終了 私の信号と他の製品はここにあります
45 USD
The indicator very accurately determines the levels of the possible end of the trend and profit fixing. The method of determining levels is based on the ideas of W.D.Gann, using an algorithm developed by his follower Kirill Borovsky. Extremely high reliability of reaching levels (according to K. Borovsky  - 80-90%) Indispensable for any trading strategy – every trader needs to determine the exit point from the market! Precisely determines targets on any timeframes and any instruments (forex, met
65 USD
** All Symbols x All Timeframes scan just by pressing scanner button ** *** Contact me after the purchase to send you instructions and add you in "ABCD scanner group" for sharing or seeing experiences with other users. Introduction This indicator scans AB=CD retracement patterns in all charts. The ABCD is the basic foundation for all harmonic patterns and highly repetitive with a high success rate . The ABCD Scanner indicator is a scanner reversal ABCD pattern that helps you identify when the pr
39 USD
作者のその他のプロダクト
AIS Advanced Grade Feasibility インジケーターは、価格が将来到達する可能性のあるレベルを予測するように設計されています。彼の仕事は、最後の 3 つのバーを分析し、それに基づいて予測を作成することです。この指標は、任意の時間枠および任意の通貨ペアで使用できます。設定の助けを借りて、予測の望ましい品質を達成できます。 予測の深さ - 望ましい予測の深さをバーで設定します。このパラメーターは、18 ~ 31 の範囲で選択することをお勧めします。 これらの制限を超えることができます。ただし、この場合、予測レベルの「固着」(18 未満の値の場合)、またはレベルの過度の幅 (31 より大きい値の場合) のいずれかが可能です。 信頼水準 1、信頼水準 2、および信頼水準 3 - 信頼水準を予測します。 1~99の範囲で設定可能。信頼度 1 は信頼度 2 よりも大きく、信頼度 3 は最も小さくする必要があります。 これらの各レベルは、予測の深さパラメーターによって決定されるバーの数について、価格がこの値に到達する確率のパーセンテージを示します。 Color
30 USD
この傾向により、価格の動きを予測し、取引の締結の主な方向を決定することができます。トレンドラインの構築は、トレーダーの取引スタイルに適したさまざまな方法を使用して可能です。 このインジケーターは、フォンミーゼス分布に基づいてトレンドの動きのパラメーターを計算します。この分布を使用すると、傾向方程式の安定した値を取得できます。トレンドの計算に加えて、上下の可能な偏差のレベルも計算されます。 インジケーターは、現在の価格値に従ってその値を更新します。彼の行動はビデオで示されています: インジケーターパラメーター: iPeriod-トレンドとレベルの計算に使用されるバーの数 Shift-行を前方に続けるための小節の数 WidthTrend-トレンドラインの幅 WidthLvl-レベルの線の幅 StyleTrend-トレンドラインスタイル StyleLvl-レベルの線のスタイル ClrTrend-トレンドラインの色 ClrUp-レベルアップの線の色 ClrDown-レベルダウンの線の色
30 USD
このスクリプトは、乱数ジェネレータを使用した貿易取引のシミュレーションに基づいています。これにより、同じ入力パラメータでもまったく異なる結果を得ることができます。スクリプトを実行すると、ダイアログボックスが開き、そこで外部変数に必要な値を設定できます。 ブロックでは、TradingOptionsは取引のシミュレーションに必要な基本パラメータを定義します。 StartBalance   - トレードバランスの初期サイズを設定します。 NumberTrade   - スクリプトの実行時にモデル化される取引トランザクションの数を設定します。多かれ少なかれ有意な結果を得るためには、このパラメータが30より大きいことが必要です。 ProbilityWinning   - 勝ち取引の確率。パーセンテージで示され、1から99までの有効値。 Min.StopLoss   -  StopLossの最小値をポイントで示します。これは、取引操作をモデル化するときに使用されます。 Max.StopLoss   -  StopLossの最大値をポイント単位で設定します。 PositiveWin - この変数は
FREE
このスクリプトは、乱数ジェネレータを使用した貿易取引のシミュレーションに基づいています。これにより、同じ入力パラメータでもまったく異なる結果を得ることができます。スクリプトを実行すると、ダイアログボックスが開き、そこで外部変数に必要な値を設定できます。 ブロックでは、TradingOptionsは取引のシミュレーションに必要な基本パラメータを定義します。 StartBalance   - トレードバランスの初期サイズを設定します。 NumberTrade   - スクリプトの実行時にモデル化される取引トランザクションの数を設定します。多かれ少なかれ有意な結果を得るためには、このパラメータが30より大きいことが必要です。 ProbilityWinning   - 勝ち取引の確率。パーセンテージで示され、1から99までの有効値。 Min.StopLoss   -  StopLossの最小値をポイントで示します。これは、取引操作をモデル化するときに使用されます。 Max.StopLoss   -  StopLossの最大値をポイント単位で設定します。 PositiveWin  - この変数
FREE
ストップロスとテイクプロフィットのレベルを選択すると、トレーディングの全体的なパフォーマンスに非常に強い影響を与える可能性があります。貿易取引の明白なパラメータ - 可能な勝利または予想される損失の大きさ - に加えて、StopLossおよびTakeProfitのレベルもまた、取引の予想期間、および一般的な取引の収益性に影響します。 「 AIS-ODT 」スクリプトを使用して最適なトランザクション期間をすでに決定している場合は、StopLossおよびTakeProfitレベルに関連したパラメーターの決定を始めることができます。 これを行うには、以下の手順に従います。最初に、私達は1つの方向か別の方向のすべての可能な価格偏差を決定し、一定時間内にそれらを達成する確率を計算します。その後、その規模、確率、および利益の期待値を考慮して、StopLossとTakeProfitの最も最適なレベルを計算できます。 これを行うには、目的の通貨ペアと目的の時間枠のチャートでスクリプトを実行します。プロパティウィンドウでILBパラメータを使用して、取引ポジションの希望期間を小節数で設定します。ユーティリ
FREE
このスクリプトは、トレーダーが可能な利益と損失の比率が最適になる貿易取引の平均期間を決定できるように設計されています。 まず、貿易取引の最適期間を決定するための一般的なアプローチを見てみましょう。以下の変数を紹介します。 R   - トランザクションの結果 T   - トランザクションが開かれていた時間 W  - 前のトランザクションの終了と次のトランザクションの開始の間の時間 すべてのトレーダーは、最短時間で最大の利益を得ることを目指しています。この欲求は次の簡単な表現で説明できます。 R/(T+W)→max 。 変数  T  と  W  がトレードの合計期間と行われたトランザクションの数の両方に依存することは明らかです。トランザクションの平均期間を  ATD  、トランザクションの合計数を  N  とします。その場合、トランザクションの平均期間は、合計の平方根に比例して増加するはずです。つまり、 ATD~√N しかし、現存する十分に根拠のある質問があります - 他の取引期間と同等の取引期間はありますか?そして、取引期間はトレーディング業務の結果にどのように影響しますか?提起された質
FREE
This script allows selecting the TakeProfit and StopLoss levels. It analyzes the history data, and then calculates the probability of reaching a given price level. How the script works Suppose you have a trading strategy and you want to select the TakeProfit and StopLoss levels. Run the script and set the parameter: Number of Bars - the average position holding time in bars. Once the script operation is complete, the AIS-PPL.csv file will be created in the Files folder in the terminal data cat
FREE
ストップロスとテイクプロフィットのレベルを選択すると、トレーディングの全体的なパフォーマンスに非常に強い影響を与える可能性があります。貿易取引の明白なパラメータ - 可能な勝利または予想される損失の大きさ - に加えて、StopLossおよびTakeProfitのレベルもまた、取引の予想期間、および一般的な取引の収益性に影響します。 「 AIS-ODT 」スクリプトを使用して最適なトランザクション期間をすでに決定している場合は、StopLossおよびTakeProfitレベルに関連したパラメーターの決定を始めることができます。 これを行うには、以下の手順に従います。最初に、私達は1つの方向か別の方向のすべての可能な価格偏差を決定し、一定時間内にそれらを達成する確率を計算します。その後、その規模、確率、および利益の期待値を考慮して、StopLossとTakeProfitの最も最適なレベルを計算できます。 これを行うには、目的の通貨ペアと目的の時間枠のチャートでスクリプトを実行します。プロパティウィンドウでILBパラメータを使用して、取引ポジションの希望期間を小節数で設定します。ユーティリ
FREE
The script allows selecting the required 'Filter level' value of the AIS-MTF indicator. Run the script on the required chart and selected timeframe. Once its operation is complete, the HPS.csv file will be created in the Files folder. Open the file. You will see three columns. The 'Filter lvl' column represents the value of the 'Filter level' for the AIS-MTF indicator. Am. dev. - degree and direction of the indicator's deviation from the price level (sorted in ascending order). Negative values i
FREE
MinDeposit
Aleksej Poljakov
5 (1)
The script analyzes the history of quotes and gives recommendations on the minimum deposit. The calculations take into account the variability of prices and the standard deviation. Margin requirements for the instrument are also taken into account. The result of the script is the minimum recommended deposit for trading the given currency pair.
FREE
This script allows selecting the TakeProfit and StopLoss levels. It analyzes the history data, and then calculates the probability of reaching a given price level. How the script works Suppose you have a trading strategy and you want to select the TakeProfit and StopLoss levels. Run the script and set the parameter: Number of Bars - the average position holding time in bars. Once the script operation is complete, the AIS-PPL.csv file will be created in the Files folder in the terminal data cat
FREE
このスクリプトは、トレーダーが可能な利益と損失の比率が最適になる貿易取引の平均期間を決定できるように設計されています。 まず、貿易取引の最適期間を決定するための一般的なアプローチを見てみましょう。以下の変数を紹介します。 R   - トランザクションの結果 T   - トランザクションが開かれていた時間 W - 前のトランザクションの終了と次のトランザクションの開始の間の時間 すべてのトレーダーは、最短時間で最大の利益を得ることを目指しています。この欲求は次の簡単な表現で説明できます。 R/(T+W)→max 。 変数 T と W がトレードの合計期間と行われたトランザクションの数の両方に依存することは明らかです。トランザクションの平均期間を ATD 、トランザクションの合計数を N とします。その場合、トランザクションの平均期間は、合計の平方根に比例して増加するはずです。つまり、 ATD~√N しかし、現存する十分に根拠のある質問があります - 他の取引期間と同等の取引期間はありますか?そして、取引期間はトレーディング業務の結果にどのように影響しますか?提起された質問への回答を得るた
FREE
The script allows selecting the required 'Filter level' value of the AIS-MTF MT5 indicator. Run the script on the required chart and selected timeframe. Once its operation is complete, the HPS.csv file will be created in the Files folder. Open the file. You will see three columns. The 'Filter lvl' column represents the value of the 'Filter level' for the AIS-MTF indicator. Am. dev. - degree and direction of the indicator's deviation from the price level (sorted in ascending order). Negative valu
FREE
AIS 正しい平均インジケーターを使用すると、市場でのトレンドの動きの始まりを設定できます。インジケーターのもう 1 つの重要な品質は、トレンドの終わりの明確なシグナルです。指標は再描画または再計算されません。 表示値 h_AE - AE チャネルの上限 l_AE - AE チャンネルの下限 h_EC - 現在のバーの高予測値 l_EC - 現在のバーの低い予測値 インジケーターを操作するときのシグナル 主な信号は、チャネル AE と EC の交差点です。 l_EC ラインが h_AE ラインより上にある場合、上昇トレンドが始まる可能性があります。 h_EC ラインが l_AE ラインを下回った後、下降トレンドの始まりが予想されます。 この場合、h_AE ラインと l_AE ラインの間のチャネル幅に注意する必要があります。両者の差が大きければ大きいほど、トレンドは強くなります。 AEチャンネルによる局所的な高値・安値の達成にも注意が必要です。この時、価格変動のトレンドが最も強くなります。 カスタマイズ可能な指標パラメータ インディケータを設定するに
30 USD
AIS 加重移動平均インジケーターは、加重移動平均を計算し、トレンド市場の動きの始まりを判断できるようにします。 重み係数は、各バーの特定の機能を考慮して計算されます。これにより、ランダムな市場の動きを除外できます。 トレンドの開始を確認する主なシグナルは、インジケーター ラインの方向の変化と、インジケーター ラインを超える価格です。 WH (青い線) は高値の加重平均です。 WL (赤い線) は安値の加重平均です。 WS (緑色の線) は、すべての価格ポイントの加重平均です。 オプション LH - 値を計算するバーの数。 LH をすばやく選択するには、まず、より高い時間枠の倍数である値を確認する必要があります。 たとえば、インジケータは M15 に設定されます。 次に、LHの次の値を確認します M30/M15=2 H1/M15 = 4 H4/M15 = 16 D1/M15 = 96 W1/M15=480 それらの中間の値も興味深い場合があります。
30 USD
AIS Advanced Grade Feasibility インジケーターは、価格が将来到達する可能性のあるレベルを予測するように設計されています。彼の仕事は、最後の 3 つのバーを分析し、それに基づいて予測を作成することです。この指標は、任意の時間枠および任意の通貨ペアで使用できます。設定の助けを借りて、予測の望ましい品質を達成できます。 予測の深さ - 望ましい予測の深さをバーで設定します。このパラメーターは、18 ~ 31 の範囲で選択することをお勧めします。 これらの制限を超えることができます。ただし、この場合、予測レベルの「固着」(18 未満の値の場合)、またはレベルの過度の幅 (31 より大きい値の場合) のいずれかが可能です。 信頼水準 1、信頼水準 2、および信頼水準 3 - 信頼水準を予測します。 1~99の範囲で設定可能。信頼度 1 は信頼度 2 よりも大きく、信頼度 3 は最も小さくする必要があります。 これらの各レベルは、予測の深さパラメーターによって決定されるバーの数について、価格がこの値に到達する確率のパーセンテージを示します。 Color
30 USD
The indicator is designed to measure the price volatility. This allows determining the moments for opening or closing trade positions more accurately. High intensity of the market indicates the instability of its movement, but allows for better results. And, conversely, low intensity of the market indicates the stability of its movement. Parameters Bars to process - the number of bars to measure the price movements. A low value of this parameter allows determining the moments of rapid price mo
30 USD
This indicator uses the Fibonacci p-numbers to smooth a price series. This allows combining the advantages of the simple and exponential moving averages. The smoothing coefficients depend on the level of the p-number, which is set in the indicator parameters. The higher the level, the greater the influence of the simple moving average and the less significant the exponential moving average. Parameters Fibonacci Numbers Order - order of the Fibonacci p-number, specified by trader. Valid values
30 USD
The indicator is based on the analysis of interaction of two filters. The first filter is the popular Moving Average. It helps to identify linear price movements and to smooth minor price fluctuations. The second filter is the Sliding Median. It is a non-linear filter. It allows to filter out noise and single spikes in the price movement. A predictive filter implemented in this indicator is based on the difference between these filters. The indicator is trained during operation and is therefore
30 USD
This indicator studies the price action as a combination of micro-trends. All micro-trends are analyzed and averaged. Price movement is filtered based on this averaging. IP_High and IP_Low (blue and red dashed lines) show the instantaneous price movement. They display the forecast only for the current price values, taking into account only the number of bars defined by the 'Filter level' parameter. SP_High and SP_Low (blue and red solid lines) smooth the price movements with respect to history.
30 USD
このインジケーターは、単純な線形平滑化プロセスを実装します。 指数平滑化の欠点の 1 つは、信号が急速に減衰することです。これにより、価格帯の長期トレンドを完全に追跡することは不可能になります。線形平滑化により、信号のフィルタリングをより正確かつ細かく調整できます。 インジケーターは、パラメーターを選択して構成されます。 LP - このパラメーターを使用すると、平滑化期間を選択できます。値が大きいほど、インジケーターが表示する長期的なトレンドが多くなります。有効な値は 0 ~ 255 です。 SP - このパラメーターはインジケーターの感度に影響します。このパラメータが大きいほど、価格系列の最後の値の影響が大きくなります.このパラメータの値がゼロの場合、インジケータは LP+1 に等しい期間の単純移動平均を表示します。有効な値は 0 ~ 255 です。
30 USD
この指標は、中央値プロパティと移動平均プロパティの組み合わせに基づくシーケンシャルハイブリッドフィルターです。 中央値を使用すると、異常値と価格系列の値のランダムなインパルスを除外できます。同時に、メディアンフィルタは価格変動のトレンドに影響を与えず、それを変更しません。 メディアンフィルタは非線形なので、単純移動平均を使用した平均化を使用してその値を平滑化します。このアプローチにより、トレンドだけでなく、価格変動の周期的な要素もより正確に特定できます。さらに、それは価格の変化に対するインディケータの感度を高め、そしてプライスシリーズとインディケータの読みの間の遅れを減らします。これにより、指標は新しいトレンドの始まりと FL パラメーターを使用して、フィルタ古いトレンドの終わりについてかなり正確に警告することができます。 ーの深さと感度を調整できます。許容値は0から63です。同時に、 2 * FL + 1 バーを使用して指標値を計算します。したがって、FLの値が大きいほど、価格チャートの傾向が強く表示されます。
30 USD
この指標は、2つの修正されたLanczosフィルタの組み合わせです。 最初のフィルターは、価格を推定するのに役立ちます。過去の値に基づいて、彼は現在のバー内で起こりうる価格変動を予測します。つまり、過去の傾向が変わらない場合の価格はどうなるかを示しています。 ウィンドウ内の価格を平滑化および平均化するための2番目のフィルタ。フィルタのレベルによって決まります。ウェイトの選択のおかげで、このフィルタは価格変動の中にある周期成分に最も積極的に反応します。 指標は EF および IF パラメータを使用して調整できます。 EF と IF の値を選択することで、トレンド価格変動の始まりに関するシグナルを得ることができます。 EF   - 指数フィルタのウィンドウサイズ。有効な値は EF = 0 ... 255 です。計算中に処理された小節の数は 2 * EF + 1 です。このパラメータが大きいほど、価格系列の過去の値の影響が強くなります。結果は実線でプロットされています。 IF   - 平均化ウィンドウのサイズを調整します。  IF = 0 ... 255 の値計算されるバーの数は 2 * I
30 USD
外国為替市場における価格変動の性質を見てみましょう。これらの変動が起こる理由に注意を払わないでください。このアプローチにより、価格変動に影響を与える主な要因を特定することができます。 たとえば、EUR-USD通貨ペアのバーの始値とH1タイムフレームを考えてみましょう。これらの価格について、Lameray図(図1)を構築します。 この図では、価格変動は基本的に線形方程式に従って発生することがわかります。この方程式のパラメータを決定するために、最小二乗法を使用できます。この特定の例では、始値を変更するための方程式は次の形式を取りました。 Open [i] = 0.99989 * Open [i + 1] + 0.00013。 この式が価格変動をどの程度適切に表しているかを確認しましょう。これを行うために、線形成分を取り除き、残差を分析します(図2)。 図から明らかになるように、これらの剰余はかなり混沌としており、それらをノイズと見なすと、次の小節の始値を予測するためのかなり簡単なシステムが得られます。
30 USD
この指標はより有益です。彼の研究は、市場における価格の動きが特定の色のノイズとして表現されるという仮定に基づいており、それは価格値の分布のパラメータに依存します。これにより、さまざまな角度から価格変動を分析することができ、価格変動を特定の色のノイズと見なして、市場の現在の状況に関する情報を入手し、価格の動向に関する予測を行うことができます。 インディケータの読みを分析するとき、インディケータラインの位置は考慮に入れられます - それらは現在のバーの始値の上下にそしてそれからどれだけ離れて位置しています。 ホワイトノイズ(White Noise) - このアプローチは、価格(現在と先史時代の両方)が電力で等しいと考えられているという事実によって特徴付けられ、それはそれを単純な移動平均と組み合わせます。ホワイトノイズ信号は、文字を確認している可能性が高く、現在の価格から逸脱するほど、市場のトレンドの動きが強くなります。逆に、ホワイトノイズラインが始値に近い場合、これはトレンドの終わりまたは横方向の価格変動のいずれかの証拠です。 フリッカーノイズ(Flicker Noise)はトレンドの上
30 USD
「 AIS Color Noise Filter 」指標のいくつかの欠点にもかかわらず、それを使用して価格系列と予測価格を平滑化するという考えは非常に魅力的に見えます。 これはいくつかの理由によるものです。 第一に、いくつかのノイズ成分を考慮に入れることは、互いに独立した要因について予測を構築することを可能にし、それは予測の質を改善することができる。 第二に、価格系列の雑音特性は全履歴を通して非常に安定して振舞い、それは安定した結果を得ることを可能にする。 そして最後に、ノイズの変動性により、予測システムが非常に敏感になり、価格の変化に対する反応が非常に速くなることを期待できます。 その結果、すべての単純化にもかかわらず、価格が移動するチャネルを正確に予測できるという指標が得られました。この指標の主な利点は、その高速さと習得の容易さです。主な不利点は、指標が予測に最も重要な要素を選択できないことです。 LH は、予測が行われる履歴データの長さを設定するパラメータです。その許容値は0から255ですが、標識が処理する小節の数はこのパラメーターで指定された数より1単位以上多いです。 
30 USD
非常に頻繁に、金融シリーズの研究でそれらの平滑化を適用します。平滑化を使用すると、高周波成分を除去することができます - それらはランダムな要因によって引き起こされているため、無関係であると考えられています。平滑化には常に、データを平均化する何らかの方法が含まれます。この方法では、時系列のランダムな変化が相互に吸収します。ほとんどの場合、この目的のために、指数平滑法と同様に単純または加重移動平均法が使用されます。 これらの方法にはそれぞれ、長所と短所があります。したがって、単純な移動平均は単純で直感的ですが、その適用には時系列の周期成分と傾向成分の​​相対的な安定性が必要です。さらに、信号遅延は移動平均の特性です。指数平滑法はラグ効果がありません。しかし、ここでも欠陥があります - 指数平滑化は、系列をランダムな異常値と整列させる場合にのみ有効です。 単純平均と指数平均の間の妥当な妥協点は、加重移動平均の使用です。しかしながら、特定の重量値を選ぶという問題がある。これをまとめてみましょう。 それで、最初に私達が平滑化手順から達成したいことを定義します: •まず、価格系列からランダムな
30 USD
長期の非ランダム成分を分離するためには、価格がどれだけ変化したのかだけでなく、これらの変化がどのように発生したのかも知る必要があります。言い換えれば - 私たちは価格レベルの値だけでなく、これらのレベルが互いに置き換わる順序にも興味があります。このアプローチを通して、ある時点での価格変動に影響を与える(または影響を与える可能性がある)長期的で安定した要因を見つけることができます。そしてこれらの要因の知識はあなたが多かれ少なかれ正確な予測をすることを可能にします。 金融系列の分析からどの程度具体的な結果を得たいのかを判断しましょう。 •まず、トレンドが市場に存在する場合は、そのトレンドを強調する必要があります。 •次に、定期的な要素を特定する必要があります。 •第三に、結果は予測に使用するのに十分安定しているべきである。 •そして最後に、私たちの分析方法は現在の市場の状況に適応するはずです。 指定された条件を満たすために、相対的な価格変動の回帰分析を使用し、このモデルに基づいて指標を作ります。この指標のアルゴリズムは履歴データからの学習に基づいており、その作業はトレーダーの完全な管理下
30 USD
強力な分析方法の1つは、Levyプロセスを使用した金融シリーズのモデリングです。これらのプロセスの主な利点は、最も単純なものから最も複雑なものまで、膨大な数の現象をモデル化するために使用できることです。市場におけるフラクタルな価格変動の考えは、レヴィ過程の特別な場合にすぎないと言えば十分でしょう。一方、パラメータを適切に選択すると、どのLevyプロセスも単純な移動平均として表すことができます。図1は、フラグメントを数倍に拡大したLevyプロセスの例を示しています。 価格チャートを滑らかにするためにLevyプロセスを使用する可能性を考えてみましょう。まず、線形プロセスをシミュレートするために使用できるように、Levyプロセスのパラメータを選択する必要があります。それから、異なる符号の係数を含む重みのシステムを得ます。このおかげで、私たちは財務範囲を平準化するだけでなく、そこに存在する反トレンドと定期的な要素を追跡することもできるでしょう。 インジケータの動作は、パラメータ LF を選択することによって設定されます。分析されるストーリーの深さを決定します。このパラメーターの許容値は、0か
30 USD
フィルタ:
レビューなし
レビューに返信