Live Sup Res MT5
- インディケータ
- Claudia Ramona Angerer
- バージョン: 1.0
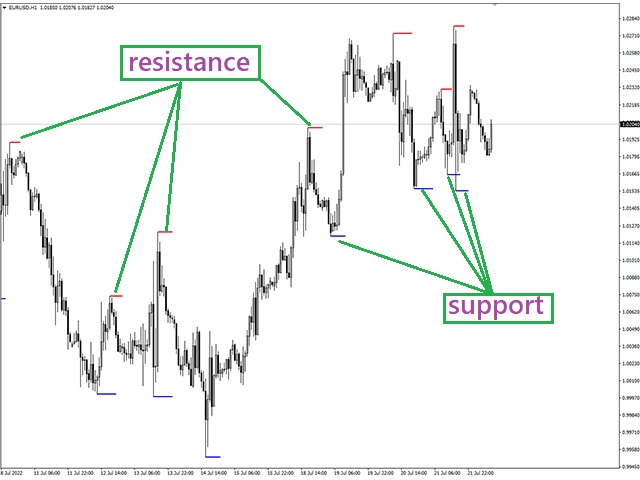
Identification of support and resistance areas
A useful indicator for traders
completely free
Can be used in all symbols
Can be used in all time frames
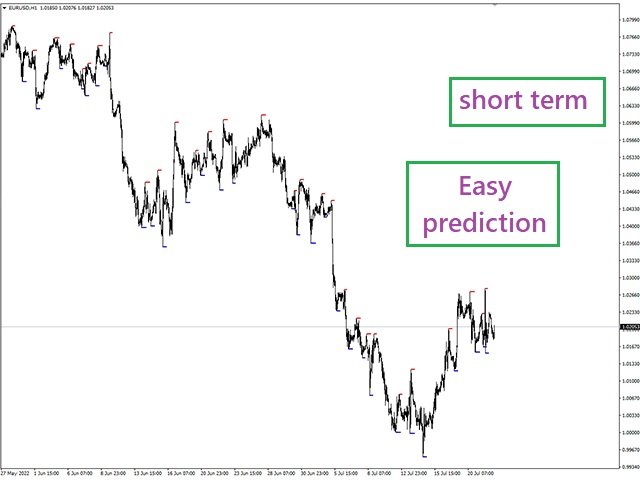
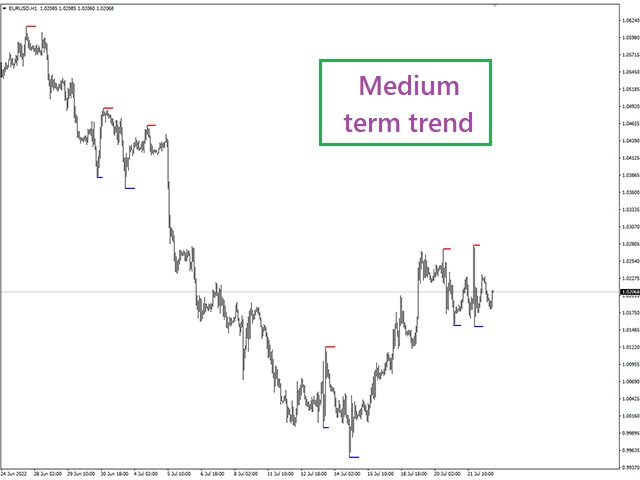
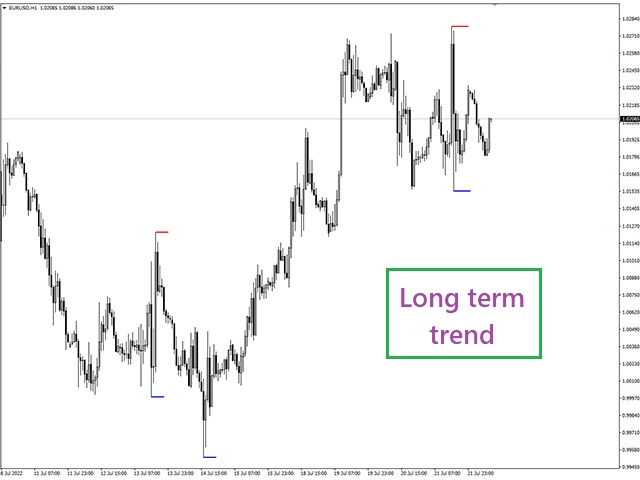
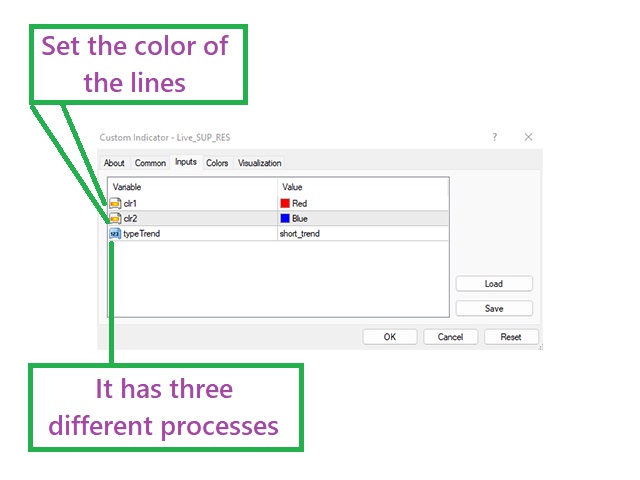
It has three different trends: short term, medium term, long term
Settings:
Clr1,2: You can change the color of the lines
Type Trend: You can determine the trend
Message me for questions, criticism and suggestions
A useful indicator for traders
completely free
Can be used in all symbols
Can be used in all time frames
It has three different trends: short term, medium term, long term
Settings:
Clr1,2: You can change the color of the lines
Type Trend: You can determine the trend
Message me for questions, criticism and suggestions


ok