Mega Indicator MT5
- インディケータ
- Szymon Palczynski
- バージョン: 1.10
- アップデート済み: 22 12月 2021
- アクティベーション: 5
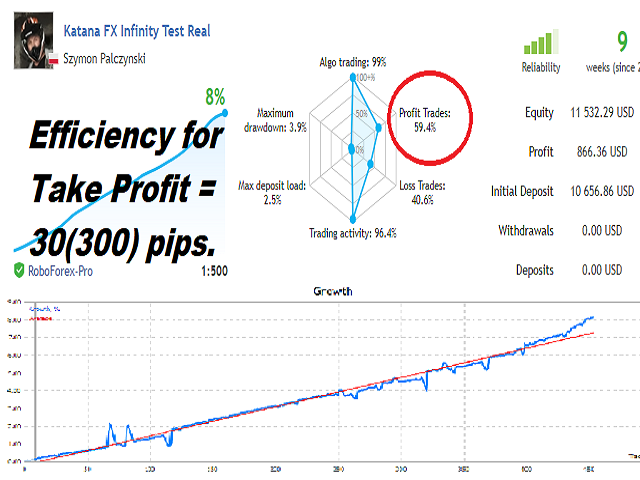
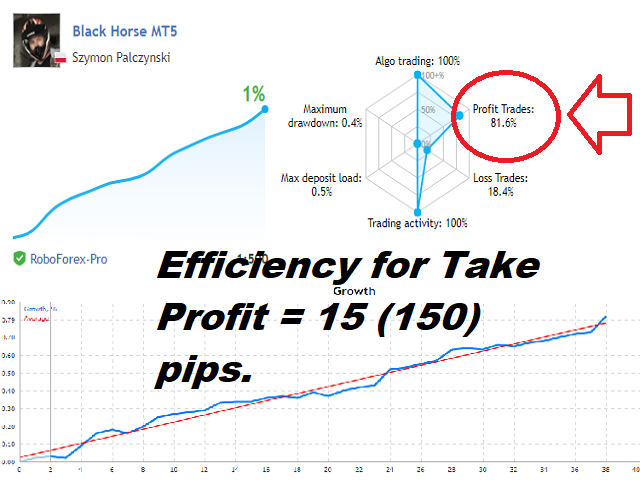
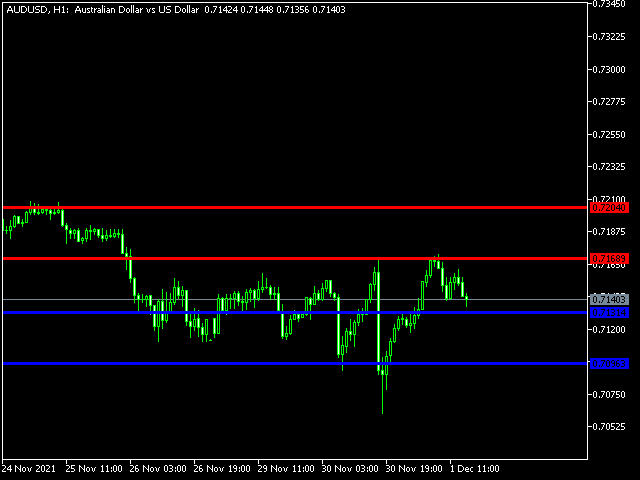
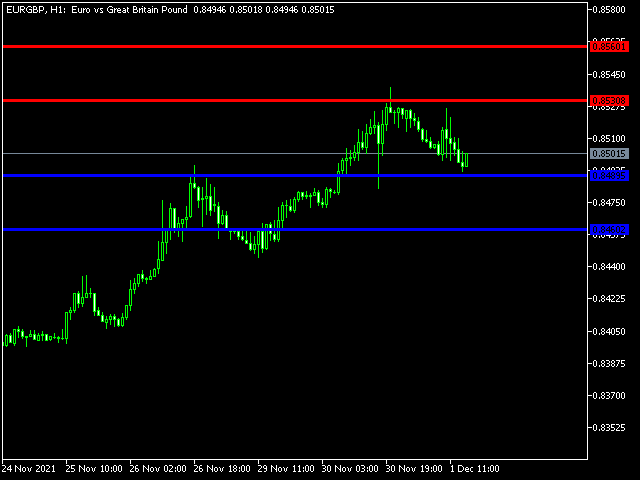
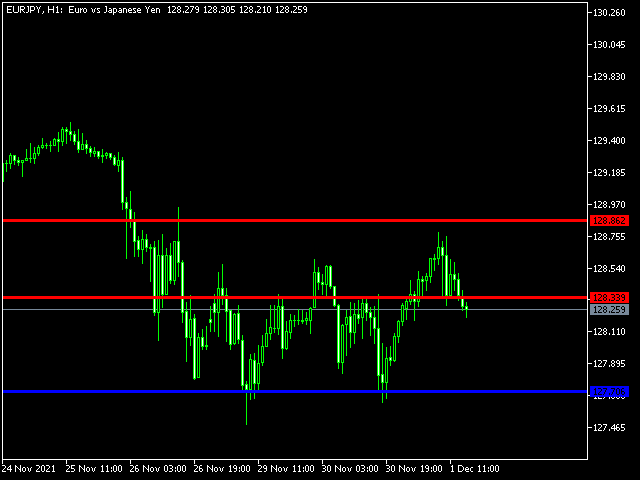
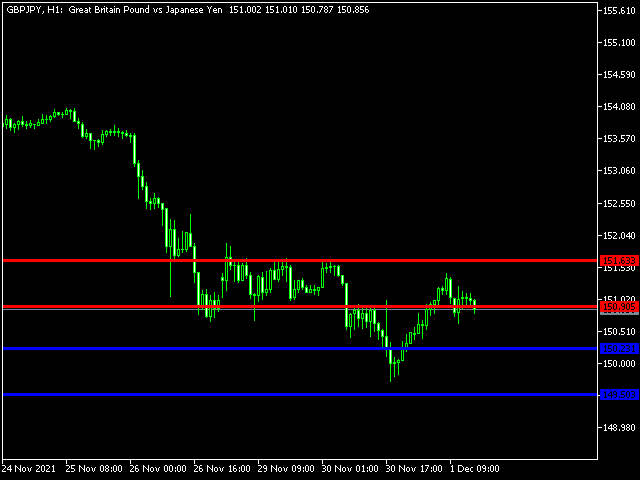
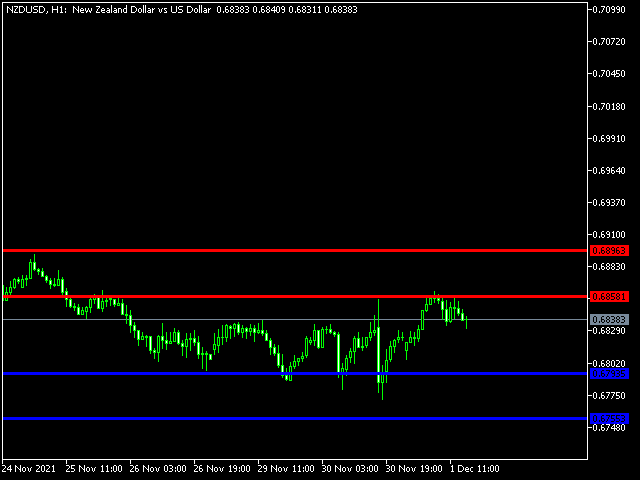
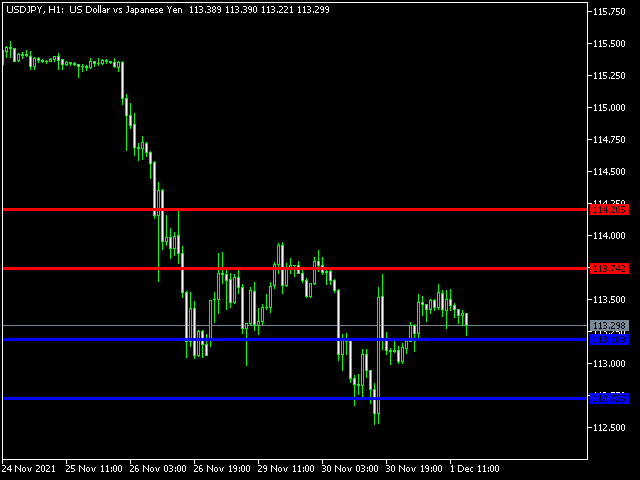
Price reach indicator. It also serves as the perfect term for supports and resistance. I use it in two experts. The basic tool for professional trading. The indicator analyzes the last 500 bar and uses this to determine the levels (but it doesn't predict the future) . Personally, I use it on TF H1.
It is very simple. Four lines on chart and that's all. Only two input parameters.
Thousands of indicators. Why this? Is good ? No! Is very good. Please test the indicator prior to purchasing.