Driver Road Bands
- インディケータ
- Kenan Ozkarakas
- バージョン: 1.0
"Driver Road Bands" indicator that is designed to be used in the 1H, 4H and 1D timeframes in the most ideal way. If we compare timeframes to roads and streets; main streets and highways with high traffic volume are similar to high-time timeframes in technical analysis.
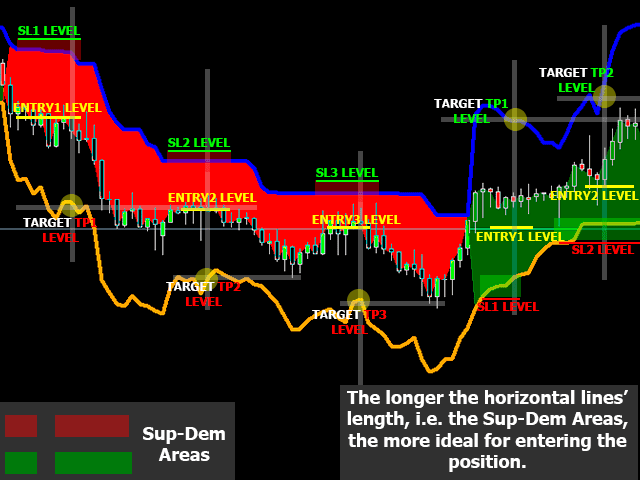
If you can interpret the curvilinear and linear lines drawn by this indicator on the graphic screen with your geometric perspective and develop your own buy and sell strategies; you may have the key to being a successful trader.
NOTE
Use this indicator to identify the main trend based on your trading time style. It would be correct to use at least 1H Timeframe.
You can use this indicator for Forex, Cryptocurrencies and all other instruments.
If you like this indicator, all I am asking is a little Review and comment if possible :)
SETTINGS
Line Color
Line Width
Line Style


Muito bom trabalho, obrigado por compartilhar.