Mean Reversal Bands
- インディケータ
- Leif Christian Ringstad
- バージョン: 1.0
- アクティベーション: 10
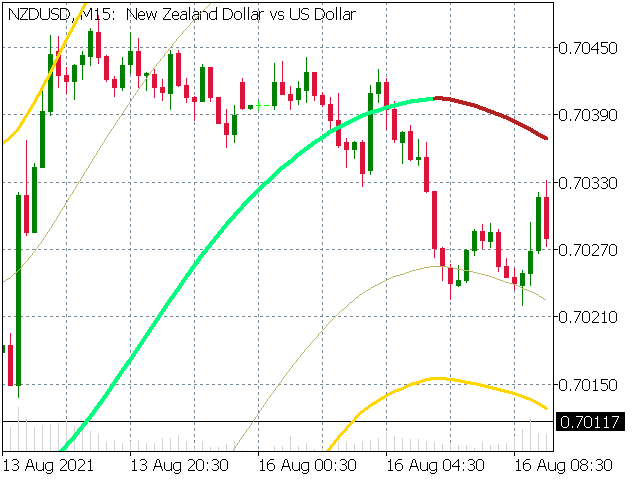
This indicator can be used to get entries when crossing inwards from the outer bands.
The center line can also be used as a baseline/trend direction.
Parameters:
| Parameter | Default value | Options |
|---|---|---|
| Base period | 100 | Any number of bars |
| Applied Price | Close | The price to use for calculation of the channel |
| Multiplier for outer band | 2.5 | The multiplier for calculating the outer bands |
| Multiplier for inner band | 1.5 | The multiplier for calculating the inner bands |
| Period for smoothing the True Average for the Bands | 100 | Any number of bars (Usually same as |
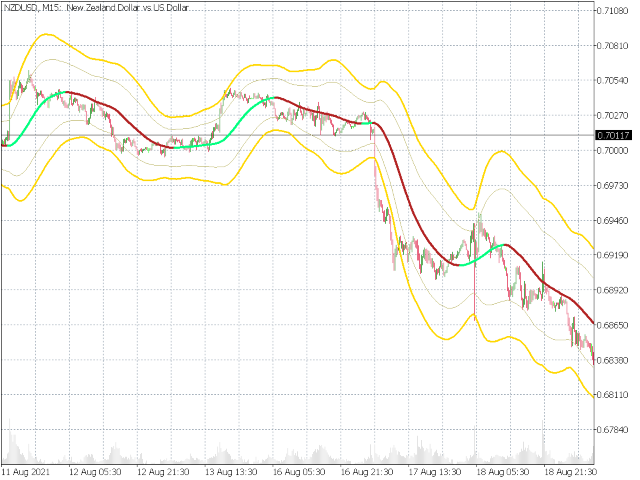
For short entries:
When the high price is above the outer band and closes inside the outer band, you should look for short entries.
For long entries:
When the low price is below the outer band and closes inside the outer band, you should look for long entries.
The outer band is the most conservative option, and it does not give many entries. For more entries, use the inner band, however that might give some false entries.