BWmfi Candle
- インディケータ
- Andrii Diachenko
- バージョン: 1.0
- アクティベーション: 10
The BWmfi Bar indicator is designed to work with the Bill Williams system
The indicator displays MFI signals on the chart, highlighting candles the corresponding MFI signals
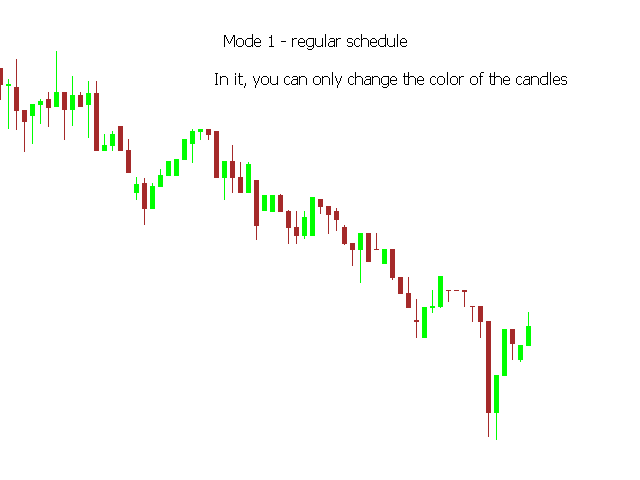
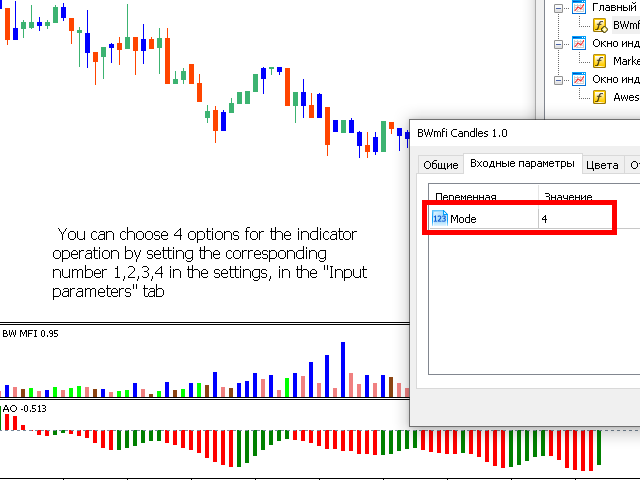
You can choose 4 options for the indicator operation by setting the corresponding number 1,2,3,4 in the settings, in the "Input parameters" tab:
- Normal graph without MFI signals
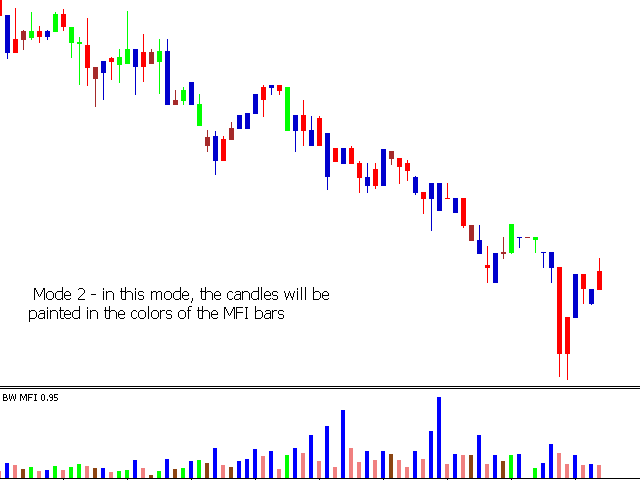
- In this mode, the bars will be painted in the colors of the MFI bars
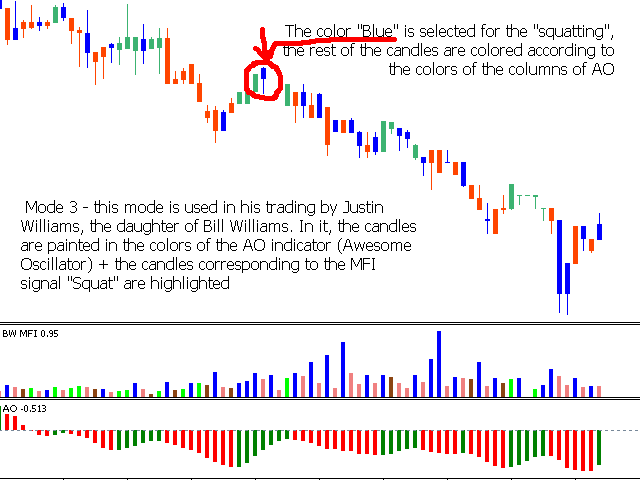
- This regime is used in his trading by Justin Williams, the daughter of Bill Williams. In it, the candles are painted in the colors of the AO indicator (Awesome Oscillator) + the bars corresponding to the "Squat" MFI signal are highlighted
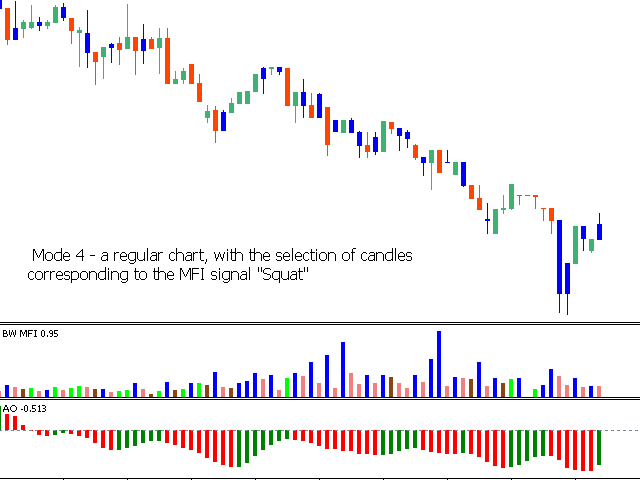
- A regular chart, with the highlighting of the candles corresponding to the MFI signal "Squat"
In the settings, in the "Colors" tab, you can set the color of the candles
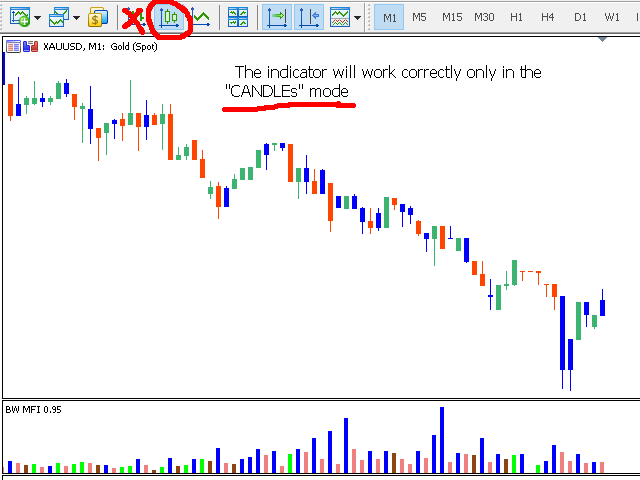
! - The indicator works only in CANDLES mode