SR Supply and Demand Zone
- インディケータ
- B Ravi Shankar
- バージョン: 2.0
- アップデート済み: 22 6月 2021
- アクティベーション: 5
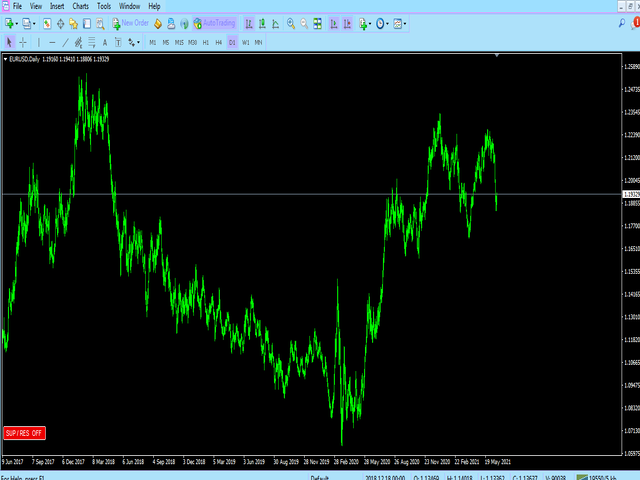
Toggle button to hide and show
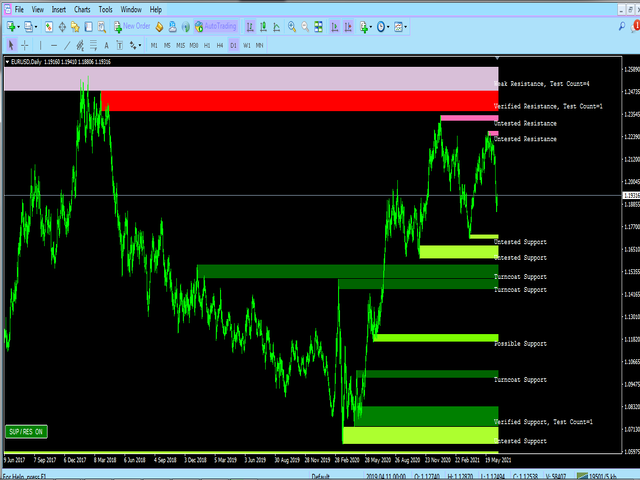
In Price action Trading Support and resistance takes a important Part. But it is always a difficult job for traders to draw the
supply and demand zones on their chart.
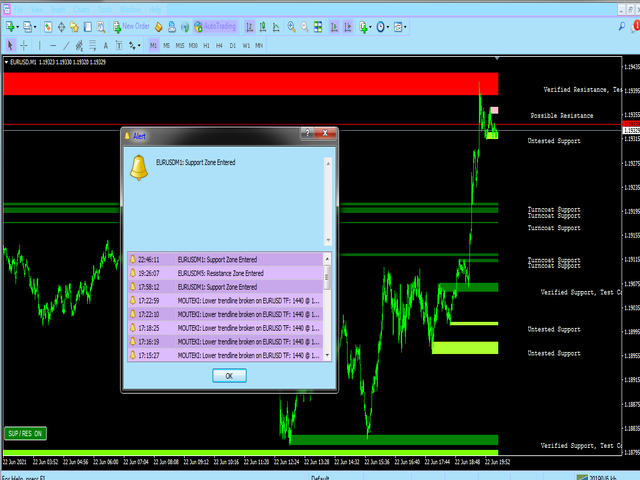
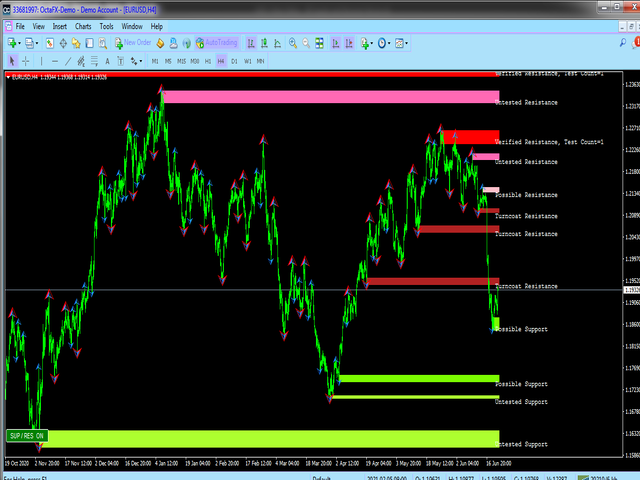
Even if it is drawn the chart looks annoying if other indicator is used in congestion. So This indicator is made to draw support and resistance lines automatically and more importantly have the toggle button to hide and show those lines.
Moreover it can show week zones strong zone and turncoat zones.
Updated Advanced version with lot of controls check in what's new section
You can see the User Manual of this Product in the below link
https://www.mql5.com/en/blogs/post/744486
Thank you


ユーザーは評価に対して何もコメントを残しませんでした