• 概要
  • レビュー
  • コメント

Start Midas Displacement Channel

Midas is the acronym for Market Interpretation / Data Analysis System is a trade approach started in 1995 by technical analyst Paul Levine and later developed by Andrew Coles, PhD and David Hawkins. Learn more in the book MIDAS Technical Analysis: A VWAP Approach to Trading and Investing in Today's Markets, (I saw that it is possible buy via Amazon).

The positive points in relation to the Midas-based indicators are the prediction of movement reversal points, the negative point is the subjectivity in finding the anchoring points.

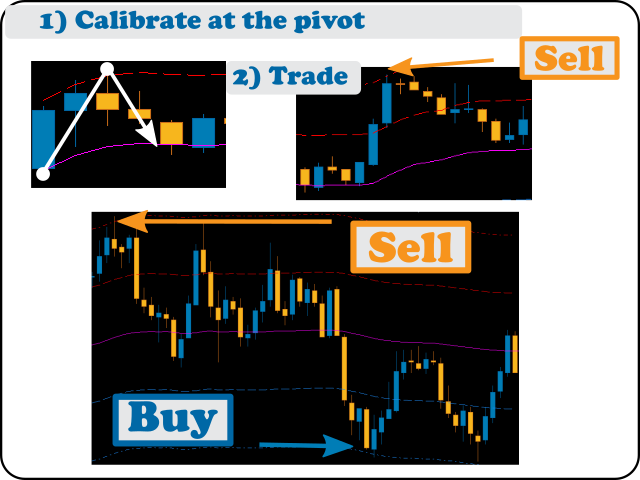
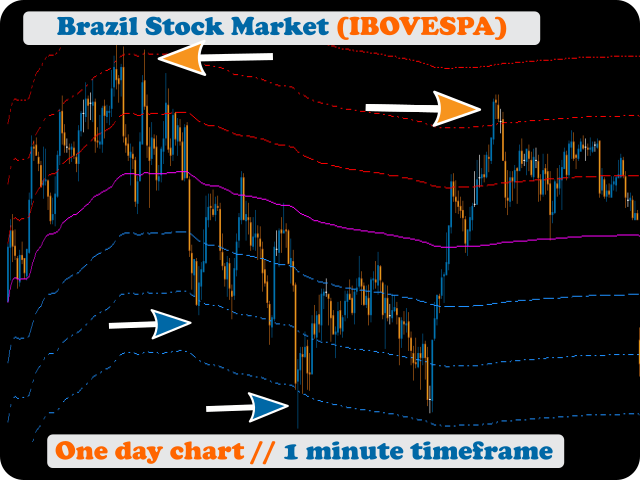
One idea would be (as you can see in the photos) to use the first daily pivot to determine the range of daily movement and thus activate the bands to map support and resistance levels.

A second idea is to "calibrate" the anchor point until you find where it is really being respected. In this regard, the functions present in the indicator greatly facilitate the work of the trader. With the shortcut keys + keyboard and mouse you have a light, practical tool that can be an ally in your operating system.

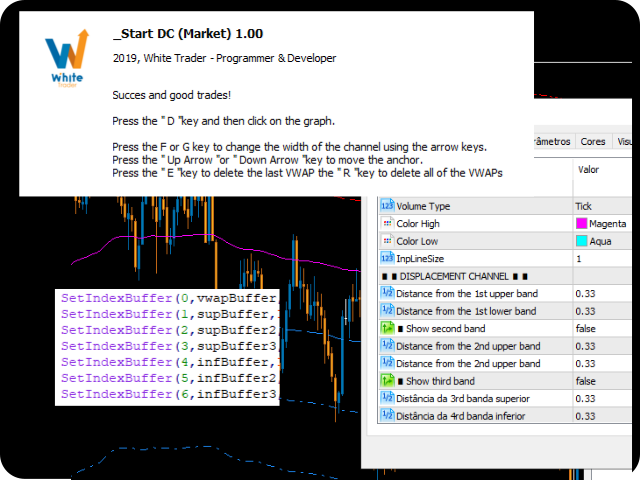
The input parameters are:

Volume type, Color High, Color Low e Line Size.

Although the parameters are digitizable, after having the indicator on the graph you start adjusting / correcting using the keyboard shortcuts which are:

Press the D key and then click on the graph.

Press the F or G key to change the width of the channel using the arrow keys.

Press the Up Arrow or Down Arrow key to move the anchor.

Press the E key to delete the last VWAP the R key to delete all of the VWAPs.

おすすめのプロダクト
Weis Wave Double Side
Eduardo Da Costa Custodio Santos
The Weis Wave Bouble Side Indicator for MT5 is part of the toolkit (Wyckoff Academy Wave Market) The Weis Wave Bouble side Indicator for MT5 was created based on the already established Weis Wave created by David Weis. The Weis Wave Double Side indicator reads the market in waves as it was done by R. Wyckoff in 1900. It helps in the identification of effort x result, cause and effect, and Supply and demand Its differential is that it can be used below the zero axis, further improving plus operat
White Weis Volume This indicator shows the sum of the volume in each wave, bulish or bearish, as idealized by David Weis , but it brings an important addition , which is the marking of the bar with the highest volume of the wave (White Bar)! In coding the indicator, it was sought to optimize the code to require minimal processing during use and not to overload mt5. The indicator can be used for pre-trading analysis and study, where the trader analyzes possible points of support and resi
Weis Wave Double Side Alert
Eduardo Da Costa Custodio Santos
The Weis Wave Bouble Side Indicator for MT5 is part of the toolkit (Wyckoff Academy Wave Market) The Weis Wave Bouble side Indicator for MT5 was created based on the already established Weis Wave created by David Weis. The Weis Wave Double Side indicator reads the market in waves as R. Wyckoff did in 1900. It helps in the identification of effort x result, cause and effect, and Supply and demand Its differential is that it can be used below the zero axis and has a breakout alert showing Who is s
Midas VWAP
Paulo Henrique Faquineli Garcia
4 (1)
Volume Weighted Average Price (VWAP) is a trading benchmark commonly used by Big Players that gives the average price a Symbol has traded throughout the day. It is based on both Volume and price. This indicator contains Daily VWAP and MIDAS' VWAP, which means you are able to anchor the beggining of MIDAS' calculations and, therefore you will be able to use this methodology to study price versus volume moves after anchor point. You will be able to anchor up to 3 HIGH MIDAS VWAP's and 3 LOW. Wis
FREE
VWAP Indicator
LUC JACOBUS A VERHEECKE
4.19 (21)
Volume Weighted Average Price (VWAP) The volume weighted average price (VWAP) is a   trading   benchmark   used by traders that gives the average price a security has traded at throughout the day, based on both volume and price. It is important because it provides traders with insight into both the trend and value of a security. This indicator VWAP V2 is free and is the manual version of the extended Easy VWAP indicator (30 Euro), where the date and time properties are automatically entered. Wit
FREE
Clear DOM
Oclair Gallacini Prado
Clear Dom This Indicator shows a pressure color box based on depth of market of the current symbol. Notice that it only works when book information is received. You decide weather you want or not to display higher (ask) and lower (bid) levels of book. The proportion ratio is calculated using volumes read from the book. You can read the actual pressure in the market any time. Indicator parameters: color_Ask -> ASK box color and ASK value line color color_Bid -> BID box color and BID valu
Weis Waves
Flavio Javier Jarabeck
3.15 (26)
The original author is David Weis, an expert in the Wyckoff Method. The Weis Wave is a modern adaptation of the 1930's Wyckoff Method, another expert in Tape Reading techniques and Chart Analysis. Weis Waves takes market volume and stacks it into waves according to price conditions giving the trader valuable insights about the market conditions. If you want to learn more about this subject you can find tons of videos in YouTube. Just look for "The Wickoff Method", "Weis Wave" and "Volume Spread
FREE
VWAP and MVWAP
Flavio Javier Jarabeck
4.17 (6)
Volume Weighted Average Price (VWAP) is a trading benchmark commonly used by Big Players that gives the average price a Symbol has traded throughout the day. It is based on both Volume and price. Additionally we put in this indicator the MVWAP (Moving Volume Weighted Average Price). For those who do not know the usage and the importance od this indicator I recommend a great article about this subject at Investopedia ( https://www.investopedia.com/articles/trading/11/trading-with-vwap-mvwap.asp )
FREE
Swiss VWAPsimple Motivation Did not find free VWAP that works, the one that I found craseh. So I created a VWAP which calculates values only for the actual day. So computer resouces are not over stressed. What is VWAP, how is it used?  VWAP stands for Volume Weighed Average Price, it calculates the running sum of tick volume and the runnung sum of price times tickvolume. The division of these sums result in a weighed price (Sum P*V/Sum V). The calculation starts normally at midnight. The value
FREE
Box Weis Wave
Thalles Nascimento De Carvalho
5 (1)
もしアクティブなトレーダーであり、市場の動きを効果的に解釈する方法を探しているなら、Weis Wave Boxを知ることはきっとお好きになるでしょう。この素晴らしいインジケーターは、明瞭で正確なボリュームの波とそれに対応するスウィングポイントのプロットを提供するために設計されています。5つのカスタマイズ可能なスウィング形状と他のユニークな機能を備えたWeis Wave Boxは、経験豊富なトレーダーや初心者にとって欠かせないツールとして際立っています。 Weis Wave Boxの注目すべき特徴の1つは、カスタムティックにおけるボリュームの波を作成できる能力です。これにより、取引の好みに合わせて適応し、戦略に精度と関連性をもたらすことができます。さらに、このインジケーターには調整可能な履歴制限があり、目的の時間帯に焦点を当てて特定のトレンドを分析することができます。 Weis Wave Boxの大きな利点の1つは、ティックボリュームと実際のボリュームに関する情報を提供できる点です。これら2つのボリュームの違いを理解することは、正確な市場分析にとって重要です。このインジケータ
Stackable VWAP
Flavio Javier Jarabeck
3.33 (6)
Volume Weighted Average Price (VWAP) is a trading benchmark commonly used by Big Players that gives the average price a Symbol has traded throughout the day. It is based on both Volume and price. Additionally we put in this indicator the MVWAP (Moving Volume Weighted Average Price). For those who do not know the usage and the importance od this indicator I recommend a great article about this subject at Investopedia ( https://www.investopedia.com/articles/trading/11/trading-with-vwap-mvwap.asp
FREE
MIDAS Super VWAP
Flavio Javier Jarabeck
4.29 (14)
Imagine VWAP, MVWAP and MIDAS in one place... Well, you found it! Now you can track the movement of Big Players in various ways, as they in general pursue the benchmarks related to this measuring, gauging if they had good execution or poor execution on their orders. Traders and analysts use the VWAP to eliminate the noise that occurs throughout the day, so they can measure what prices buyers and sellers are really trading. VWAP gives traders insight into how a stock trades for that day and deter
FREE
Volume Waves
Paulo Henrique Faquineli Garcia
One of the best tools for analyzing volume, Weis Wave was devised by David Weis to facilitate reading the directional flow. For the disciples of the Wyckoff method, this means an evolution, facilitating a predictive reading of the market, always looking for Accumulation and Distribution zones for traded assets. For better understanding, in this indicator we try to cover every reading of EFFORT (traded volume) versus RESULT (price change). Thus, you can apply the indicator on the chart twice
VWAP Simple
Deibson Carvalho
4.03 (33)
The Volume Weighted Average Price is similar to a moving average, except volume is included to weight the average price over a period.    Volume-Weighted Average Price [VWAP] is a dynamic, weighted average designed to more accurately reflect  a security’s true average price over a given period . Mathematically, VWAP is the summation of money (i.e., Volume x Price) transacted divided by the total volume over any time horizon, typically from market open to market close. VWAP reflects the capital
FREE
The VWAP Level indicator is a technical analysis tool that calculates the weighted average price for the traded volumes of a specific asset. The VWAP provides traders and investors with the average price of an asset over a specific time frame. It is commonly used by investors to compare data on "passive" trading operations, such as pension funds and mutual funds, but also by traders who want to check if an asset has been bought or sold at a good market price. To calculate the VWAP level we
FREE
Wave Box Market Frenquency
Jean Jacques Huve Ribeiro
4.83 (6)
Totally linked to the result of a movement and the duration he had. Its height records how many ticks the asset walked during a given movement, its width shows us the duration that movement had. Its configuration must be in line with the Weis Wave Indicator configuration to observe the movement force and can indicate a possible accumulation or distribution of the movement;
FREE
Indicador Regressão Linear – Par de Ativos - INTRADAY Indicador é um oscilador que faz o plot do Resíduo resultado da regressão linear entre os dois ativos inseridos como input do indicador, representado pela fórmula: Y = aX + b + R Onde Y é o valor do ativo dependente, X é o valor do ativo independente, a é a inclinação da reta entre os dois ativos, b é a intersecção da reta e R é o resíduo. O resíduo representa a quantidade da variabilidade que Y que o modelo ajustado não consegue explicar. E
FREE
This is Gekko's Cutomized Cutomized Average Directional Index (ADX), a customized version of the famous ADX indicator. Use the regular ADX and take advantage two entry signals calculations and different ways of being alerted whenever there is potential entry or exit point. Inputs Period: Period for the ADX calculation; PlotSignalType: How will the indicator calculate entry (swing) signals: 1- ShowSwingsOnTrendLevel : Show Signals for Trend Confirmation Swings; 2- ShowSwingsOnTrendLevelDirectio
Volume Weighted Average Price or VWAP is an indicator wich shows different average prices on chart. This is very useful to find strong negotiation price areas and as trend following. Configurations: Day, Week and Month - Show different VWAPs according to the period. You can change each line style on "colors" tab. Any doubt or suggestion please contact us. Enjoy! This is a free indicator, but it took hours to develop. If you want to pay me a coffee, I appreciate a lot   <3 PayPal, Skrill, Ne
FREE
Percent Levels
Cinthia Regina De Moraes
Indicador tipo 2mv frequência mostra os níveis percentuais no mercado financeiro que tendem a ser zonas realmente importantes para os traders. Observem que o preço segue um fluxo e uma frequência que se enquadram em canais percentuais de movimento,  tradicionalmente traçados por níveis Fibonacci. O indicador LevelsPercent traça linhas em pontos específicos de percentual configurados pelo usuário e "pode" anteceder possíveis níveis de SUPORTE e RESISTÊNCIA. A leitura do mercado e a identificação
Value Chart Candlesticks
Flavio Javier Jarabeck
4.75 (8)
The idea of a Value Chart indicator was presented in the very good book I read back in 2020 , " Dynamic Trading Indicators: Winning with Value Charts and Price Action Profile ", from the authors Mark Helweg and David Stendahl. The idea is simple and the result is pure genius: Present candlestick Price analysis in a detrended way! HOW TO READ THIS INDICATOR Look for Overbought and Oversold levels. Of course, you will need to test the settings a lot to find the "correct" one for your approach.
FREE
VWAP Volume And Price is the indicator for Volume Weighted Average Price, designed according to regular calculation. The average price is calculated using typical price - (high + low + close) / 3 - and weighted by volume for each candle. So, the indicator can be used to trend trades, balanced with volume. Try other products and expert advisors too. Any doubt, PM.
Simple Weis Wave
Jean Jacques Huve Ribeiro
4.2 (5)
One of the best tools for analyzing volume, Weis Wave was idelized by David Weis, to facilitate the reading of directional flow. For the VSA method disciples it is an evolution of the practices created by Richard Wycoff, facilitating a predictive reading of the market, always seeking an accumulation and distribution of the negotiated contracts. Cumulative wave volume  Range of wave ( removed) Average Wave volume Ref "Tim Ord lectures" ( removed)
FREE
WAPV Weis Wave Chart Forex
Eduardo Da Costa Custodio Santos
The Weis Wave Chart Forex for MT5 is a Price and Volume indicator. The Price and Volume reading was widely disseminated through Richard Demille Wyckoff based on the three laws created by him: Supply and Demand, Cause and Effect and Effort vs. Result. In 1900 R.Wyckoff already used the wave chart in his analyses. Many years later, around 1990, David Weis Automated R. Wyckoff's wave chart and today we bring you the evolution of David Weis' wave chart. It shows the amount of Volume and the amount o
This indicator is a volume indicator it changes the color of the candles according to a certain number of ticks, and this number of ticks can be informed by the user both the number of ticks and the color of the candles, this indicator works in any graphical time or any asset, provided that the asset has a ticker number to be informed. This indicator seeks to facilitate user viewing when analyzing candles with a certain number of ticks.
FREE
Fundamentação teórica A VWAP é uma média móvel ajustada pelo volume, ou seja o peso de cada preço corresponde ao volume de ações negociadas no período, dando mais importância ao período em que se tenha mais negociações. [1] VWAP = sum(price[i]*volume[i]) / sum(volume[i]) Metodologia É possível configurar o período que será utilizado para o calculo da VWAP, a cor, a espessura e o estilo da linha. A linha é desenhada desde a o começo da série disponível apenas uma vez para economizar recursos com
FREE
The indicator plots dynamic POC, VAH and VAL levels for a specified period from tick data. POC - Point Of Control, the price at which the maximum volume has accumulated over a certain period of time (POC in the volume profile). VA - Volume Area, the zone of the fair value of the asset. VAH - Volume Area High. VAL - Volume Area Low. The DBS_DynamicLevels indicator plots dynamic levels where the calculation point is the maximum volume level (POC) and zone VAH / VAL. The indicator shows the history
The Weis Waves RSJ Indicator sums up volumes in each wave. This is how we receive a bar chart of cumulative volumes of alternating waves. Namely the cumulative volume makes the Weis wave charts unique. It allows comparing the relation of the wave sequence characteristics, such as correspondence of the applied force (expressed in the volume) and received result (the price progress). If you still have questions, please contact me by direct message:  https://www.mql5.com/en/users/robsjunqueira/
FREE
Automatic Vwap Midas
Ricardo Almeida Branco
5 (1)
The 3 Automatic Vwap (Midas) Indicator can be used for Price and Volume studyers to map the movement of market drivers. It automatically plots 3 Vwaps, two of which are dynamic and will be updated throughout the day if new highs or new lows emerge. The third Vwap is daily and can help if the trend is up or down. Also, an auxiliary indicator that plots (also dynamic) points of interest with OHLC prices (Open, High and Low of the current day and Close of the previous day) was inserted. Success and
Donchian Channel is an indicator created by Richard Donchian. It is formed by taking the highest high and the lowest low of the last specified period in candles. The area between high and low is the channel for the chosen period. Its configuration is simple. It is possible to have the average between the upper and lower lines, plus you have alerts when price hits one side. If you have any questions or find any bugs, please contact me. Enjoy!
FREE
このプロダクトを購入した人は以下も購入しています
まず第一に、この取引インジケーターは再描画されず、再描画されず、遅延しないことを強調する価値があります。これにより、手動取引とロボット取引の両方に理想的なものになります。 アトミックアナリストは、価格の強さとモメンタムを利用して市場でより良いエッジを見つけるためのPA価格アクションインジケーターです。ノイズや誤ったシグナルを除去し、取引ポテンシャルを高めるための高度なフィルターを備えています。複雑なインジケーターの複数のレイヤーを使用して、アトミックアナリストはチャートをスキャンし、複雑な数学的計算をシンプルなシグナルと色に変換します。これにより、どのような初心者トレーダーでも理解して使用し、一貫した取引の決定を行うことができます。 「アトミックアナリスト」は、新規および経験豊富なトレーダー向けにカスタマイズされた包括的な取引ソリューションです。プレミアムインジケーターとトップノッチの機能を1つの取引戦略に組み合わせ、すべてのタイプのトレーダーにとって汎用性のある選択肢にします。 デイリートレーディングとスキャルピング戦略:高速で正確なデイトレーディングおよび短期トレード
まず第一に、このトレーディングシステムがノンリペイント、ノンリドロー、ノンラグのインジケーターであることを強調する価値がある。これにより、手動取引とロボット取引の両方に理想的なものになっています。 「スマートトレンドトレーディングシステム MT5」は、新規および経験豊富なトレーダー向けにカスタマイズされた包括的なトレーディングソリューションです。10以上のプレミアムインジケーターを組み合わせ、7つ以上の堅実なトレーディング戦略を備えており、多様な市場状況に対応する多目的な選択肢となっています。 トレンドフォロー戦略:トレンドを効果的に乗り越えるための正確なエントリーとストップロス管理を提供します。 リバーサル戦略:潜在的なトレンドの反転を特定し、トレーダーがレンジ相場を活用できるようにします。 スキャルピング戦略:高速で正確なデイトレードおよび短期取引のために設計されています。 安定性:すべてのインジケーターはノンリペイント、ノンリドロー、ノンラグであり、信頼性の高いシグナルを保証します。 カスタマイズ:個々の取引の嗜好に合わせたカスタム戦略をサポートします。7つ以上の戦略と組み合わせ
ご紹介   クォンタム トレンド スナイパー インジケーターは 、トレンド反転を特定して取引する方法を変革する画期的な MQL5 インジケーターです。 13年以上の取引経験を持つ経験豊富なトレーダーのチームによって開発されました。     クォンタムトレンドスナイパーインジケーター   は、非常に高い精度でトレンドの反転を識別する革新的な方法で、あなたのトレーディングの旅を新たな高みに押し上げるように設計されています。 ***Quantum Trend Sniper Indicatorを購入すると、Quantum Breakout Indicatorを無料で入手できます!*** クォンタム ブレイクアウト インジケーターは、トレンドの反転を特定するとアラートを発し、矢印を示し、3 つのテイクプロフィットレベルを提案します。 初心者トレーダーにもプロのトレーダーにも適しています。 量子EAチャネル:       ここをクリック MT4のバージョン:       ここをクリック 推奨事項: 期間:すべての時間枠。最良の結果を得るには、M
現在33%オフ 初心者にもエキスパートトレーダーにも最適なソリューション このインジケーターは独自の機能と新しい公式を多数内蔵しており、ユニークで高品質かつ手頃な取引ツールです。このアップデートでは、2つの時間枠ゾーンを表示できるようになります。より長いTFだけでなく、チャートTFとより長いTF(ネストゾーンを表示)の両方を表示できます。すべてのSupply Demandトレーダーの皆さんのお気に召すはずです。:) 重要情報の公開 Advanced Supply Demandの可能性を最大化するには、 https://www.mql5.com/ja/blogs/post/720245 にアクセスしてください。   エントリーまたはターゲットの正確なトリガーポイントを正確に特定できれば取引がどのように改善されるか想像してみてください。新しい基盤となるアルゴリズムに基づいて構築されているため、買い手と売り手の間の潜在的な不均衡をさらに簡単に特定できます。これは、最も強い需要と供給のゾーンと、過去のパフォーマンス(古いゾーンを表示)がグラフィカルに表現されるためです。これらの機能は、最適
まず第一に、この取引ツールはノンリペイント、ノンリドロー、ノンラグの指標であり、プロの取引に理想的ですことを強調する価値があります。 スマートプライスアクションコンセプトインジケーターは、新米から経験豊富なトレーダーまで、非常 に強力なツールです。Inner Circle Trader AnalysisやSmart Money Concepts Trading Strategiesなど、20以上の有用な指標を1つに組み合わせています。このインジケーターはスマートマネーコンセプトに焦点を当て、大手機関の取引方法を提供し、彼らの動きを予測するのに役立ちます。 特に、流動性分析に優れており、機関がどのように取引しているかを理解しやすくしています。市場のトレンドを予測し、価格の動きを慎重に分析するのに優れています。機関の戦略とトレードを合わせることで、市場の動向についてより正確な予測ができます。このインジケーターは多目的であり、市場構造を分析し、重要な注文ブロックを特定し、さまざまなパターンを認識するのに優れています。 このインジケーターはBOSやCHoCHなどのパターンの識
今、147ドル(いくつかの更新後に499ドルに増加します) - 無制限のアカウント(PCSまたはMac) RelicusRoad ユーザー マニュアル + トレーニング ビデオ + プライベート Discord グループへのアクセス + VIP ステータス 市場の新しい見方 RelicusRoad は、外国為替、先物、暗号通貨、株式、および指数の世界で最も強力な取引インジケーターであり、トレーダーに収益を維持するために必要なすべての情報とツールを提供します。初心者から上級者まで、すべてのトレーダーが成功するためのテクニカル分析と取引計画を提供します。これは、将来の市場を予測するのに十分な情報を提供する重要な取引指標です。意味をなさないチャート上のいくつかの異なる指標ではなく、完全な解決策を信じています.これは、信号、矢印 + 価格アクション情報を表示するオールインワンのインジケーターで、他に類を見ない非常に正確です。 強力な AI に基づいて、RelicusRoad は不足している情報とツールを提供して、あなたを教育し、トレーディングのプロ、成功したトレーダーにします。
mql5と Telegramの モーニング・ブリーフィングで、詳細とスクリーンショットを含む毎日のマーケット・アップデートをご覧 ください! FX Power MT5 NGは 、長年の人気を誇る通貨強度計FX Powerの次世代モデルです。 この次世代ストレングスメーターは何を提供するのでしょうか?初代FXパワーの魅力すべて プラス GOLD/XAUの強さ分析 より正確な計算結果 個別に設定可能な分析期間 カスタマイズ可能な計算上限値により、さらに優れたパフォーマンスを実現 もっと見たい人のための特別なマルチインスタンス設定 すべてのチャートでお好みの色を無限に設定可能 数え切れないほどの通知オプションにより、重要なことを見逃すことはありません。 Windows 11とmacOSのスタイルで角を丸くした新しいデザイン 魔法のように動くインジケーターパネル FXパワーの主な機能 すべての主要通貨の強さの完全な履歴 すべての時間枠における通貨の強さの履歴 すべてのブローカーとチャートで同一の計算結果 100%信頼できるリアルタイム計算 -> リペイントなし ドロップダウン・リストから
FX Volume MT5
Daniel Stein
4.94 (17)
mql5と Telegramの モーニング・ブリーフィングで、詳細とスクリーンショットを含む毎日のマーケット・アップデートをご覧 ください! FX Volumeは、ブローカーの視点から市場のセンチメントをリアルに洞察する、最初で唯一の出来高インジケーターです。 ブローカーのような機関投資家が外国為替市場でどのようなポジションをとっているか、COTレポートよりもはるかに速く、素晴らしい洞察を提供します。 この情報をチャート上で直接見ることは、あなたの取引にとって真のゲームチェンジャーであり、画期的なソリューションです。 以下のようなユニークなマーケットデータ洞察から利益を得てください。 比率は 、通貨のロングポジションとショートポジションの比率をパーセントで表示します。 比率の変化は 、選択した期間内のロング比率とその変化率を表示します。 Volumes Totalは 、通貨の取引量(ロングとショート)の合計をロット単位で表示します。 Volumes Long :全通貨のロングポジションの取引量を表示します。 Volumes(ショート )は、全通貨のショートポジションの取引量を表示
AW Trend Predictor MT5
AW Trading Software Limited
4.76 (54)
1 つのシステムでのトレンド レベルとブレイクダウン レベルの組み合わせ。高度なインジケーター アルゴリズムは、市場のノイズをフィルター処理し、トレンド、エントリー ポイント、および可能なエグジット レベルを決定します。インジケーターシグナルは統計モジュールに記録されるため、最適なツールを選択してシグナル履歴の有効性を示すことができます。この指標は、テイクプロフィットとストップロスのマークを計算します。 マニュアルと説明書 ->   ここ / MT4 バージョン ->   ここ インジケーターで取引する方法: Trend Predictor での取引は、たった 3 つの簡単なステップです。 ステップ 1 - ポジションを開く 70% 以上の成功率で買いシグナルが受信されました ステップ 2 - ストップロスの決定 逆信号でトランクを選択 ステップ 3 - テイクプロフィット戦略の定義 戦略 1: TP1 に到達したらポジション全体をクローズする 戦略 2: TP1 に達した時点でポジションの 50% をクローズし、TP2 に達した時点で残りの 50% をクローズします。 戦略 3:
これはMT5のインジケーターで、再描画なしで取引に参入するための正確なシグナルを提供します。 外国為替、暗号通貨、金属、株式、インデックスなど、あらゆる金融資産に適用できます。かなり正確な見積もりを提供し、取引を開始して終了するのに最適な時期を教えてくれます。1つのシグナルを処理しただけでインジケーターの元が取れた例の 動画 (6:22)をご覧ください。Entry PointsPro インジケーターの助けを借りたほとんどのトレーダーの最初の1週間の結果が改善しています。 Telegramグループ に登録してください。Entry Points Proインジケーターのメリットは次の通りです。 再描画のないエントリーシグナル 再描画されるインジケーターでは一度表示されたシグナルが削除されて大きな金銭的損失につながることがありますが、これと異なり、表示されて確認されたシグナルは消えることがありません。 エラーなしの取引開始 インジケーターアルゴリズムによって取引を開始する(資産を売買する)理想的な瞬間を見つけることができます。それを使用するすべてのトレーダーの成功率が向上します。
TPSpro TRENDPRO  - is a trend indicator that automatically analyzes the market and provides information about the trend and each of its changes, as well as giving signals for entering trades without redrawing! The indicator uses each candle, analyzing them separately. referring to different impulses - up or down impulse. Exact entry points into transactions for currencies, crypto, metals, stocks, indices!  -  Version MT4                  DETAILED DESCRIPTION        /       TRADING SETUPS       
ご紹介     Quantum Breakout PRO は 、ブレイクアウト ゾーンの取引方法を変革する画期的な MQL5 インジケーターです。 13年以上の取引経験を持つ経験豊富なトレーダーのチームによって開発されました。     クォンタム ブレイクアウト プロ   は、革新的でダイナミックなブレイクアウト ゾーン戦略により、あなたのトレーディングの旅を新たな高みに押し上げるように設計されています。 クォンタム ブレイクアウト インジケーターは、5 つの利益ターゲット ゾーンを備えたブレイクアウト ゾーン上のシグナル矢印と、ブレイクアウト ボックスに基づいたストップロスの提案を提供します。 初心者トレーダーにもプロのトレーダーにも適しています。 量子EAチャネル:       ここをクリック 重要!購入後、インストールマニュアルを受け取るためにプライベートメッセージを送ってください。 推奨事項: 時間枠: M15 通貨ペア: GBPJPY、EURJPY、USDJPY、NZDUSD、XAUUSD アカウントの種類: ECN、Raw、またはス
TrendDecoder Premium MT5
Christophe, Pa Trouillas
5 (1)
レンジと次の動きを特定     |    トレンドの最も早いシグナルと強さを得る     |    反転の前に明確な出口を得る     |    価格がテストするフィボ・レベルを見つける。   |  非リペイント、非遅延インディケータ - マニュアルおよび自動売買に最適 - すべての資産、すべての時間単位に対応 - 発売記念50%割引   - その後 149 ドルに戻る 購入後、 推奨セッティングについては、このチャンネルで私に連絡してください。 MT4 バージョン: ここをクリック BladeSCALPER と PowerZONES を使った完全な方法を入手する どのようなものですか? TrendDECODERは、トレンド監視をシンプルかつ簡単にするための複数のイノベーションを集約したものです。 Projective TrendLine (投影トレンドライン) - 今後のトレンドのスピードリファレンス RealTime TrendLine vs. Projective TrendLine (リアルタイムトレンドライン vs. Projective Tren
Bill Williams Advanced is designed for automatic chart analysis using Bill Williams' "Profitunity" system. The indicator analyzes four timeframes at once. Manual (Be sure to read before purchasing) Advantages 1. Automatically analyzes the chart using the "Profitunity" system of Bill Williams. The found signals are placed in a table in the corner of the screen. 2. Equipped with a trend filter based on the Alligator indicator. Most of the system signals are recommended to be used only accordi
Step into the realm of Forex trading with confidence and precision using XQ, a cutting-edge Forex indicator designed to elevate your trading game to unprecedented heights. Whether you're a seasoned trader or just stepping into the world of currency exchange, XQ Forex Indicator empowers you with the insights and signals needed to make informed trading decisions. The signal conditions are a combination of three indicators, and XQ Forex Indicator only display  medium and long-term trends . The ind
Auto Order Block with break of structure based on ICT and Smart Money Concepts Futures Break of Structure ( BoS )             Order block ( OB )            Higher time frame Order block / Point of Interest ( POI )    shown on current chart           Fair value Gap ( FVG ) / Imbalance   ,  MTF      ( Multi Time Frame )    Volume Imbalance     ,  MTF          vIMB Gap’s Equal High / Low’s     ,  MTF             EQH / EQL Liquidity               Current Day High / Low           HOD /
IX Powerは 、FX Powerの無敵の精度をついにFX以外のシンボルにも提供します。 お気に入りの指数、株式、コモディティ、ETF、さらには暗号通貨の短期、中期、長期のトレンドの強さを正確に判断します。 お使いの端末が提供する すべてを分析する ことができます。ぜひお試しいただき、取引 タイミングが大幅に改善 されることをご体験ください。 IXパワーの主な特徴 100%正確で再描画されない計算結果 - ターミナルで利用可能なすべての取引シンボルに対して 予め設定され、さらに個別に設定可能な強度分析期間のドロップダウン選択 Eメール、メッセージ、モバイル通知による無数の通知オプション EAリクエストのためのアクセス可能なバッファ カスタマイズ可能な計算制限により、さらに優れたパフォーマンスを実現 もっと見たい人のための特別なマルチインスタンス設定 すべてのチャートでお好みの色を無限に設定可能 Windows 11とmacOSのスタイルで角を丸くした新しいパネルデザイン サブ・ウィンドウとメイン・チャートの間をシームレスに移動する、魔法のように動くイン
The Volume by Price Indicator for MetaTrader 5 features Volume Profile and Market Profile TPO (Time Price Opportunity). Get valuable insights out of currencies, equities and commodities data. Gain an edge trading financial markets. Volume and TPO histogram bar and line charts. Volume Footprint charts. TPO letter and block marker charts including split structures. Versatile segmentation and compositing methods. Static, dynamic and flexible ranges with relative and/or absolute visualizations. Lay
ICT, SMC, SMART MONEY CONCEPTS, SMART MONEY, Smart Money Concept, Support and Resistance, Trend Analysis, Price Action, Market Structure, Order Blocks, BOS/CHoCH,   Breaker Blocks ,  Momentum Shift,   Supply&Demand Zone/Order Blocks , Strong Imbalance,   HH/LL/HL/LH,    Fair Value Gap, FVG,  Premium  &   Discount   Zones, Fibonacci Retracement, OTE, Buy Side Liquidity, Sell Side Liquidity, BSL/SSL Taken, Equal Highs & Lows, MTF Dashboard, Multiple Time Frame, BigBar, HTF OB, HTF Market Structure
Quantum平均足PRO のご紹介 市場のトレンドに対する明確な洞察を提供するように設計された平均足キャンドルは、ノイズを除去し、誤ったシグナルを排除する能力で知られています。混乱を招く価格変動に別れを告げ、よりスムーズで信頼性の高いチャート表現を導入しましょう。 Quantum Heiken Ashi PRO を真にユニークなものにしているのは、従来のローソク足データを読みやすい色のバーに変換する革新的なフォーミュラです。赤と緑のバーはそれぞれ弱気トレンドと強気トレンドをエレガントに強調し、潜在的なエントリーポイントとエグジットポイントを驚くほど正確に見つけることができます。 量子EAチャネル:       ここをクリック MT4のバージョン:       ここをクリック この注目すべき指標には、いくつかの重要な利点があります。 明確性の向上: 価格変動を平滑化することで、平均足バーは市場トレンドをより明確に表現し、有利な取引機会を特定しやすくします。 ノイズの削減: 誤ったシグナルを引き起こすことが多い不安定な価格変動に別れを告げます。 Quantum Heik
Gartley Hunter Multi - An indicator for searching for harmonic patterns simultaneously on dozens of trading instruments and on all classic timeframes: (m1, m5, m15, m30, H1, H4, D1, Wk, Mn). Manual (Be sure to read before purchasing) | Version for MT4 Advantages 1. Patterns: Gartley, Butterfly, Shark, Crab. Bat, Alternate Bat, Deep Crab, Cypher 2. Simultaneous search for patterns on dozens of trading instruments and on all classic timeframes 3. Search for patterns of all possible sizes. Fr
Was: $249  Now: $99   Market Profile defines a number of day types that can help the trader to determine market behaviour. A key feature is the Value Area, representing the range of price action where 70% of trading took place. Understanding the Value Area can give traders valuable insight into market direction and establish the higher odds trade. It is an excellent addition to any system you may be using. Inspired by Jim Dalton’s book “Mind Over Markets”, this indicator is designed to suit the
A key element in trading is zones or levels from which decisions to buy or sell a trading instrument are made. Despite attempts by major players to conceal their presence in the market, they inevitably leave traces. Our task was to learn how to identify these traces and interpret them correctly. Reversal First Impulse levels (RFI)   -  Version MT4                  INSTRUCTIONS                 RUS                 ENG                         R ecommended to use with an indicator   -  TREND PRO  
MT4版  |  FAQ Owl Smart Levels Indicator は、 Bill Williams の高度なフラクタル、市場の正しい波構造を構築する Valable ZigZag、エントリの正確なレベルをマークする Fibonacci レベルなどの一般的な市場分析ツールを含む 1 つのインジケーター内の完全な取引システムです。 利益を得るために市場と場所に。 戦略の詳細な説明 インジケータを操作するための指示 顧問-取引助手 プライベートユーザーチャット ->購入後に私に書いて、私はプライベートチャットにあなたを追加し、あなたはそこにすべてのボーナスをダウンロードすることができます 力はシンプルさにあります! Owl Smart Levels 取引システムは非常に使いやすいので、専門家にも、市場を勉強し始めて自分で取引戦略を選択し始めたばかりの人にも適しています。 戦略と指標に秘密の数式や計算方法が隠されているわけではなく、すべての戦略指標は公開されています。 Owl Smart Levels を使用すると、取引を開始するためのシグナルをすばやく確認し、注文を出すため
クリスマスセール!40% OFF!1月1日に価格が$250に値上がり! GoldenGate Entriesをご紹介します:最先端のトレーディングソリューション! GoldenGate Entries(GGE)を使用して取引する革新的なアプローチを発見しましょう。GGEは、取引体験を向上させるために設計された先進的なインジケーターで、ユーザーに正確性と自信を持たせるための包括的な機能を提供します。 通貨ペア:Any(FX - 商品 - 株式 - 株式 - クリプト) タイムフレーム:15分からH1 主な特徴: 買いと売りの矢印の指示:常に情報を受け取るために、買いと売りの矢印の指示をポップアップアラートとともに受け取ります。 GoldenGate_Algo:GoldenGate_Algoを使用して市場の状況を把握し、市場が「売り過ぎ」または「買い過ぎ」かどうかを評価する強力なツールです。 現在のトレンド分析:視聴中のタイムフレームで現在のトレンドにアクセスして、取引を市場の主流方向に合わせることができます。 組み込みのピボットポイント:組み込まれた
スイングトレーディング は、トレンドの方向のスイングと可能な反転スイングを検出するように設計された最初のインジケーターです。トレーディングの文献で広く説明されているベースラインスイングトレーディングアプローチを使用します。インディケータは、いくつかの価格と時間のベクトルを調査して、全体的なトレンドの方向を追跡し、市場が売られ過ぎまたは買われ過ぎて修正の準備ができている状況を検出します。 [ インストールガイド | 更新ガイド | トラブルシューティング | よくある質問 | すべての製品 ] むち打ちを起こさずに市場スイングの利益 インジケーターは常にトレンドの方向を表示します 色付きの価格帯は機会のベースラインを表します 色付きのダッシュは、可能な反転スイングを表します この指標は、独自の品質とパフォーマンスを分析します 複数時間枠のダッシュボードを実装します カスタマイズ可能なトレンドおよびスイング期間 電子メール/サウンド/プッシュアラートを実装します インジケータは再描画またはバックペインティングではありません Swing Tradingとは Swing Tradi
まず最初に、このトレーディングシステムがリペイントされず、再描画されず、遅延しないことを強調する価値があります。これにより、プロのトレーディングに最適な状態になります。 「スマートサポートアンドレジスタンストレーディングシステム」は、新規および経験豊富なトレーダー向けにカスタマイズされた高度なインジケーターです。この包括的なシステムは、7以上の戦略、10のインジケーター、およびデイトレード戦略、スイングトレード戦略、サポートおよびレジスタンス戦略、ローソク足パターン戦略、VWAP戦略、マルチタイムフレームトレンド戦略など、さまざまなトレーディングアプローチを組み合わせています。これは、矢印信号、エントリーポイント、出口ポイント、トレードアラート、より高い時間枠のトレンド分析、リアルタイムのトレードモニタリング、そして洞察力のあるトレンドとボリュームキャンドルの着色を提供します。自動的なサポートとレジスタンスの検出により、さまざまな市況下でトレーダーが的確な決定を下すのを支援する多面的なインジケーターとなっています。 スマートサポートアンドレジスタンストレーディングシステムは、
Was: $299  Now: $99   Supply Demand uses previous price action to identify potential imbalances between buyers and sellers. The key is to identify the better odds zones, not just the untouched ones. Blahtech Supply Demand indicator delivers functionality previously unavailable on any trading platform. This 4-in-1 indicator not only highlights the higher probability zones using a multi-criteria strength engine, but also combines it with multi-timeframe trend analysis, previously confirmed swings
Professional Scalping Tool on Deriv Attention! The indicator will be sold in limited quantities!!! Description: This trading indicator is designed for professional traders focused on scalping. Designed with the market in mind, it provides highly accurate spike trading signals. It works on the M1 timeframe and supports the following symbols: Boom 300 Index, Boom 500 Index, Boom 1000 Index, Crash 300 Index, Crash 500 Index, Crash 1000 Index. Functional Features: - Direction: - Trading is ca
Gartley Hunter - An indicator for searching for harmonic patterns (Gartley patterns) and their projections. The indicator is equipped with a system of alerts and push notifications. Manual (Be sure to read before purchasing) | Version for MT4 Advantages 1. 12 harmonic patterns: 7 classical and 5 exotic. New patterns will be added as the indicator develops. 2. Constant automatic search for harmonic patterns. The indicator is capable of finding from the smallest to the largest patterns. 3. Autom
作者のその他のプロダクト
Attention: New update - 4 major practicality improvements! 1) Alarm 2) Midas text value 3) Click panel 4) Can be connected to an EA to operate in semi-automatic mode Attention - This indicator does not work perfectly in backtest due to MT5 peculiarities (Reading hotkeys or panel clicks) . My suggestion is that you test Automatic Vwap Midas which has automatic operation to analyze the calculation and then buy Start if you think the indicator will match your operating.     This indicator i
Here we have the Start Midas Fibo Bands , I confess that it is an indicator that excited me enough to operate because I was able to find more defined rules. Well, the indicator has the functions of the other indicators of the Start line , which is a possibility to plot several Midas on the screen, you can move the anchor point using keyboard shortcuts and use the legend to differentiate one anchor from another. The rules that I have analyzed for my possible setup are recommended to the entry, st
Launch price (until 05/08/2022) 30 USD Price after 08/05/2022 50 USD The Danko Trend Color indicator is actually a candle coloring to bring practicality, ease and information to your charts. Danko Trend Color combines PRICE AND VOLUME indicators to define the prevailing trend, so the colors are: Blue (indicates an uptrend) Orange (indicates a downtrend) White (indicates undefined trend) I don't like to promise anything with my indicators, I ask you to download, test it for free (for
Start Midas SD Channel
Ricardo Almeida Branco
5 (1)
Do you already know the Start Midas indicator? What about the Vwap Standard Deviation indicator? And I need to speak again in the book MIDAS Technical Analysis ... The Start Midas SD Channel indicator combines the two in one, bringing the practicality and efficiency of Midas with the statistical calculation of the standard deviation. All of this with the practicality of the White Trader Start indicators, where you can plot the indicator and move them on the screen using keyboard s
The Vwap Bands Auto indicator seeks to automatically map the maximum market frequency ( automatic update of the outermost band ) and has two intermediate bands that also adjust to daily volatility. Another tool from White Trader that combines price and volume, in addition to mapping the daily amplitude. The external band is updated automatically when the daily maximum or minimum breaks the current frequency, and can be an input signal, seeking a return to the daily vwap. Thus, in ad
PVA Dragon
Ricardo Almeida Branco
Users of PVRSA / PVA certainly already know the Dragon indicator and its use. The Dragon works as dynamic support and resistance and can be used for scalper or trend follower. In addition to the Dragon we have the WGT (fast) and EMA (slow) averages that can show immediate movement and also trend movement. Stay tuned for the Dragon's inclination! The indicator can be used on any asset/currency pair and can be customized according to the trader's interest. See also my volume analysi
Several techniques use volume as an important point in the trade. Whether to indicate strength, exhaustion, pullback weakness, among others. In chief I quote Richard Wyckoff's theory, which said about the importance of looking price and volume. However, there are several possibilities to filter what is volume that should be noticed. PVRSA/PVA users use an indicator with specific colors, which assist in identifying the volume and type of movement that the price has made. Will the high
O HL2 C Lines
Ricardo Almeida Branco
5 (2)
If you consider the extremes of the daily price as important points, this indicator will help in your trades. Now, instead of manually drawing lines that mark daily highs and lows, you can use the O (HL) ² C Lines indicator. Thus, the OHLC Lines indicator automatically plots the lines O (Open for the current day), H (High for the current day), L (Low for the current day) and C (Close for the previous day). Plot also the high and low of the previous day. Thus, we have 4 static lines
Volume Doji
Ricardo Almeida Branco
Hey guys. This indicator will show you, in the volume histogram, if the candle was a Doji, a bullish candle, or a bearish candle. The construction of this indicator was requested by a trader who uses other indicators from my catalog, and I decided to release it free to help traders who think that the indicator can contribute to their operations. The parameters are: Volume Type: Real Volume or Tick Volume. Color if the candle is bearish: select the color. Color if the candle is high:
FREE
Display N Bars
Ricardo Almeida Branco
4.89 (9)
The Display N Bars utility is a simple tool designed to help identify candles. If a trader tries to share knowledge with a colleague but it is difficult to pinpoint exactly the desired candle, just say the corresponding candle number. The candle count is reset every day. Seeking to offer a good customization the inputs are: Display type -> Display only odd, only odd, or both candles? Direction -> Horizontal or Vertical? Display multiples of: (display frequency) -> Displa
FREE
The best Vwap Midas coding for Metatrader 5 you can find in White Trader indicators. The indicator has been optimized not to recalculate (improving performance) and has several visual settings for you to adapt in your own way. TRY IT FOR FREE by clicking the free demo button Where and why to use Vwap Midas (and Auto Zig Vwap Midas) can be used on a variety of indices, currencies, forex, cryptocurrencies, stocks, indices and commodities. Many successful traders use price and volume to ge
Simple countdown indicator for the next candle. Only claim is to be light! The indicator inserts a text object to the right of the current price and calculates how much time is left for the new bar, showing this to the trader. Leave your comment if the indicator helped you in any way! If you have any suggestions, let me know to evaluate the improvements. Success and Good Trades!
FREE
Automatic Vwap Midas
Ricardo Almeida Branco
5 (1)
The 3 Automatic Vwap (Midas) Indicator can be used for Price and Volume studyers to map the movement of market drivers. It automatically plots 3 Vwaps, two of which are dynamic and will be updated throughout the day if new highs or new lows emerge. The third Vwap is daily and can help if the trend is up or down. Also, an auxiliary indicator that plots (also dynamic) points of interest with OHLC prices (Open, High and Low of the current day and Close of the previous day) was inserted. Success and
Several techniques use volume as an important point in the trade. Whether to indicate strength, exhaustion, pullback weakness, among others. In chief I quote Richard Wyckoff's theory, which said about the importance of looking price and volume. However, there are several possibilities to filter what is volume that should be noticed. PVRSA/PVA users use an indicator with specific colors, which assist in identifying the volume and type of movement that the price has made. Will the high
Do you use volume in your reading of the market? Certainly many traders use it, and do not imagine operating without it. The Color Histogram Volume Set indicator allows the user to choose the value that he considers interesting to monitor. When you pass this you will have visual confirmation and if you want you will also have the audible alert that is given by the indicator. Of course, there are other ways to try to find a high volume, such as assessing whether the volume
Do you use volume in your reading of the market? Certainly many traders use it, and do not imagine operating without it. The Color Candle Volume Set indicator allows the user to choose the value that he considers interesting to monitor. When you pass this you will have visual confirmation on the price chart and if you want you will also have the audible alert that is given by the indicator. Of course, there are other ways to try to find a high volume, such as assessing whet
WT Vwap Bands
Ricardo Almeida Branco
The WT Vwap Bands indicator is an indicator that combines price and volume, helping to show whether the price is within the "fair price", overbought or oversold. The indicator code was designed for performance and has already been tested in a real trading account. In addition to the visual inputs (color, thickness and line style), the user can define a% value that depends on the price. The default values work with the most distant band at 1% of the price and then dividing this distan
Fibo Z
Ricardo Almeida Branco
5 (1)
With it, you leave pre-configured two expansion settings and one fibo retraction configuration to use via keyboard shortcut and mouse click. That is, the Fibo_Z utility facilitates the use of MT5's native functions. The shortcut keys are: "Z" configuration 1 of the expansion. "X" expansion setting 2 "Z" retraction configuration. "V" clears objects from the screen. It is. Success and good trades!
Want to make the graph cleaner? Don't you use the opening price in your analysis? Want to use a chart model that was used by Richard Wyckoff? Then you need to know the Color HLC Candles and Bars indicator. In the same indicator you can switch to the display of candles or bars. Take a look at the other volume indicators to complement your operating. And don't forget to look at the best Vwap Custom (Midas)! Leave your comment! Success and good trades!
Vwap Freeze
Ricardo Almeida Branco
5 (1)
The previous day's vwap is used by some traders as a support and resistance point, after all it is one of the ways to consider the fair price of that asset or that pair the day before. Possible defenses can occur in this region indicating a reversal, or triggering stops starting a new, more directional movement. It is a matter of analyzing how it will add to your operational. To avoid manually drawing the previous day's vwaps and saving time for your analysis, use the Vwap Freeze indicator,
Start Display N Bars
Ricardo Almeida Branco
5 (1)
Do you already know Display N Bars? Do you already know the Start tool (from Midas indicators)? In this indicator, we unified the two tools, allowing you to define which candle will start counting, or use the automatic numbering that was already available in the previous version. Description of the utility follows: Display N Bars The Display N Bars utility is a simple tool that aims to help identify candles. If a trader tries to share the knowledge with a colleague but it i
WT Vwap 5 Bands
Ricardo Almeida Branco
5 (1)
WT Vwap 5 Bands The WT Vwap Bands indicator is an indicator that combines price and volume, helping to show whether the price is within the "fair price", overbought or oversold. The indicator code was designed for performance and has already been tested in a real trading account. In addition to the visual inputs (color, thickness and line style), the user can define a% value that depends on the price. The default values work with the most distant band at 1% of the price and then di
The White's Candle Color indicator (by volume) will color the candles based on the current candle's volume compared to the moving average of the volume. This will allow you to see clearly if the volume (real or tick) is within the normal range, whether it is high or low and bring very important information about the market. I hope that this indicator can help in your operational. Success and good trades!
Haos MT5
Ricardo Almeida Branco
5 (1)
The Haos oscillator coded for the MT5! This oscillator allows to verify overbought / oversold regions in two periods (14 and 96, for example), making it possible to anticipate a reversal. Possibility to activate an audible alert when it reaches a defined level. Possibility to choose the alert sound by placing a .wav song in each asset or timeframe. (save a .wav file to the MQL5 \ Files folder) Possibility to activate / deactivate histogram and levels to make the screen cleaner. Customizable co
The Initial Balance (Initial Balance / Initial Balance) is a concept related to the study of volume (to learn more, study about Market Profile and Auction Market Theory. You can find some videos in English when searching for "Initial Balance Market Profile"). The IB defines a range in which prices were negotiated in the first hour of trading.The amplitude of the range is important and the break in the range defined by the Initial Balance may have occurred due to the movement of several players
The VTC Volatility indicator was written to support a Brazilian stock market strategy in the WDO (USDBRL), but it can be adapted to other strategies and markets. In the new indicator update, it is now allowed to choose up to 4 levels to determine the range, and thus be more versatile. The Brazilian stock exchange (B3) has the VTC which is a "Structured Exchange Rate Volatility Transaction" (more information on the B3 website). At around 10:00 am, the VTC "Call" comes out and Brazilian
White Weis Volume This indicator shows the sum of the volume in each wave, bulish or bearish, as idealized by David Weis , but it brings an important addition , which is the marking of the bar with the highest volume of the wave (White Bar)! In coding the indicator, it was sought to optimize the code to require minimal processing during use and not to overload mt5. The indicator can be used for pre-trading analysis and study, where the trader analyzes possible points of support and resi
O indicador Vwap Deviation Bands segue na mesma linha dos outros indicadores da White Trader, que buscam leveza, personalização e qualidade, para entregar o que há de melhor para o trader. Isto, além de combinar preço e volume (informações importantes para o trader) com uma medida estatística do desvio padrão. Este indicador já foi utilizado e testado por outros traders que deram sugestões, inclusive, para chegarmos nesta versão final (embora ainda esteja aceitando sugestões, sempre :)   ). O d
Prior Lines
Ricardo Almeida Branco
This indicator shows on the current day some lines of interest, such as maximum, minimum and closing of the previous day, as well as the opening, maximum and minimum price of the current day. It can also show the GAP (closing of the previous day and opening of the current day) and projections of the amplitude of the previous day, according to the value you choose in the multiplier. Oh, I was going to forget. It is also possible to determine the time frame, which is daily by default. If th
Launch price (until 08/05/2022) 50 USD Price after 08/05/2022 80 USD Do not buy before seeing the Danko Trend Color product, as this panel is a way to view a summary of this indicator on various timeframes. The Danko DTC Panel utility allows you to look at the trend in up to 5 timeframes. When clicking on the timeframe texts, a new window will open with the indicator plotted on the screen so you can see the complete chart. The width of the panel, with the amount of candles you want to see,
フィルタ:
レビューなし
レビューに返信