• 概要
  • レビュー (5)
  • コメント (8)
  • 最新情報

Fit Channel

5
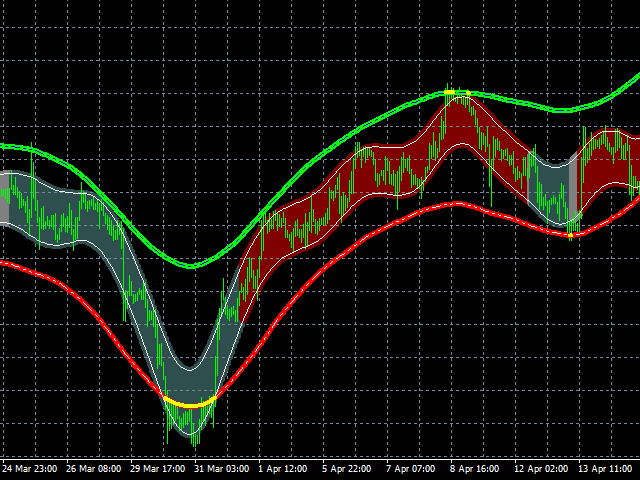
The market price usually falls between the borders of the channel.

If the price is out of range, it is a trading signal or trading opportunity.

Basically, Fit Channel can be used to help determine overbought and oversold conditions in the market. When the market price is close to the upper limit, the market is considered overbought (sell zone). Conversely, when the market price is close to the bottom range, the market is considered oversold (buy zone).

However, the research can be used to help determine the strength of price trends. The closing price of the price above the upper limit of channel trading is used as a buy signal, and the closing price of pushing the price lower and lower than the lower limit price is used as a selling signal.

The price channel will be constantly revised during operation, and the channel will serve as a reference for current trading decisions.
レビュー 5
rainwalker123
3363
rainwalker123 2024.01.07 12:40 
 

Brilliant indicator, among the 97% of useless indis here on MQL5, Timing is the most important thing in trading. Congratz to the Author. Keep up the good work.

ed070279
20
ed070279 2023.04.29 09:00 
 

Крутой индикатор, отработка совместно с уровнями супер!

elite luis
3331
elite luis 2023.03.06 09:44 
 

Amazing indicator, another quality product from Author, Big Thank you! Author is super friendly and responsive, any issue he get it fix fast also he is open to idea suggestions and continously updating to improve his indicators, he is extremely passionate in what he is doing, deserved more than 5 stars for his dedication! Well Done!

*Bought both MT4+MT5, Best Buy for 2023!*

おすすめのプロダクト
RaysFX Supertrend Bar RaysFX Supertrend Bar è un indicatore personalizzato per MetaTrader 4. Utilizza l'indice di canale delle materie prime (CCI) per generare segnali di trading. L'indicatore mostra dei puntini in una finestra separata sotto il grafico principale per indicare i segnali di trading. Caratteristiche principali: Calcola il CCI per diversi periodi temporali. Visualizza puntini per indicare i segnali di trading. Permette all'utente di modificare i periodi temporali e la distanza tra
Simple Long Short Bar A very concise and clear indicator, very easy to understand, but it is very useful for tracking trends. The usage of this indicator is very simple: Long signal: If the price shows signs of a long market, then a yellow box will appear. Short signal: If the price shows signs of a short market, then a blue box will appear. Bull strength: If the size of the box is large, it means the bull strength is strong, and vice versa. Short strength: If the size of the box is small, it m
The presented indicator allows you to determine potential entry points into the market and set protective orders at reasonable levels. This product can be useful for both beginners and experienced traders. The indicator is based on calculation methods proven by time and practicing traders. The indicator is calculated in two stages: At the first stage, linear regression (LR) of the selected price type is determined for a given number of chart periods. At the second stage, the obtained data is p
Legacy of Gann
Pavel Zamoshnikov
4.82 (11)
The indicator very accurately determines the levels of the possible end of the trend and profit fixing. The method of determining levels is based on the ideas of W.D.Gann, using an algorithm developed by his follower Kirill Borovsky. Extremely high reliability of reaching levels (according to K. Borovsky  - 80-90%) Indispensable for any trading strategy – every trader needs to determine the exit point from the market! Precisely determines targets on any timeframes and any instruments (forex, met
This indicator is designed for drawing equidistant channels. Two options are available: based on the number of hours in the indicator calculation and by the number of bars. To draw a channel, enter a number 1 or greater. The maximum value is limited by the amount of visible bars. If the parameters you enter are beyond the allowable limits, you will get notified if the indicator restrictions. Please note that the time involved in calculation of the channel must be greater than the timeframe it wi
This is a unique  Gold Indicator On channel trading pullbacks and gives accurate entries on gold and major Fx Pairs. It has the ability to pass any prop firm Challenge and get accurate entries on gold and major fx pairs. 50% off CHRISTMAS EVE  ACTUAL PRICE 125 -CURRENT OFFER OF 65 DOLLARS TILL 25TH DECEMBER GRAB IT EA FOR PROP FIRM AND CHANNEL INDICAOR IS FREE ALONG WITH THIS POWERFUL INDICATOR ALONG WITH THE BEST SET FILE FOR FIRST 25 USERS. Strategy tester report is in comment section. INDIC
This indicator is looking for such market models as: head and shoulders, triangles, double tops and bottoms, flags, wedges and three touches. Options: barsToProcess - the initial number of bars to calculate; ArrowSize - arrow size; AllowablePatternLength - minimum length of the pattern (in bars); AllowablePatternPriceDiv - the minimum height of the pattern, applicable for all but the 'head and shoulders', 'double top' patterns (for the latter there is another parameter); AllowablePriceA
Dark Sniper arrow indicator. complete lack of redrawing percentage of correct indicator predictions from 80 85% The arrow indicates the direction of the next candle and the possible direction of the trend in the future.  suitable for small m1 timeframes. It is recommended to open deals from 1 to 2 candles. The signal appears on the last candle advantages of the indicator: 1. leading signals. 2.complete lack of redrawing 3. high signal accuracy.
The arrow indicator without redrawing shows potential entry points into the market in the form of arrows of the appropriate color: the up arrows (usually green) suggest opening a purchase, the red down arrows suggest selling. The appearance of arrows may be accompanied by beeps. It is usually assumed to enter at the next bar after the pointer, but there may be non-standard recommendations. Arrow indicators visually "unload" the price chart and save time for analysis: no signal – no deal, if ther
The indicator displays the signals of the RSX oscillator on the price chart. (To display these signals in a separate window, along with the oscillator, another indicator is used -  RSX Osc 4 AM ). It is optimal to use the indicator signals as signals to open a trade when the price overcomes the maximum or minimum of the bar at which the signal was given. An opposite signal cancels the previous signal. Settings: Data period for indicator calculation - data period for indicator calculation; Data
Good day! To your attention the ForexdivergencePS indicator may not be the newest in the trading strategy The Forex indicator detects and displays descending and ascending divergences on the chart. When a new pattern is formed, a pop-up window is triggered. An arrow is formed on the chart that shows the type of phenomenon and helps to open an order in the optimal direction. Friends of traders rate the effectiveness of the tool as above average. You can change settings, including the sensi
Индикатор iVeles_Channel_Extremum_II_MTF вычисляет точки слома направлений движения цены на установленном в параметрах ТФ, на основе этих точек и выбранного их количества строится основной канал цены, который можно использовать в качестве уровней поддержки и сопротивления для меньшего ТФ, на котором установлен индикатор. В зависимости от направления движения основного тренда рассчитывается средняя линия канала по уровню Фибоначи, от которой, как правило, идет отскок в сторону тренда. Также по ур
ADX Pointer is an indicator which is based on "Average Directional Index" and draws three numbers in chart window depending on the value of ADX. In ADX Pointer you can set "ADX_Period" which is of course period of Average Directional Index and you can also set 3 levels. When ADX value exceed first level ("ADX_Level1") in chart window appears number "1", when ADX exceed second level ("ADX_Level2") appears "2" and when ADX exceed third level ("ADX_Level3") appears "3". Simple. ADX Pointer works on
The indicator detects and displays 3 Drives harmonic pattern (see the screenshot). The pattern is plotted by the extreme values of the ZigZag indicator (included in the resources, no need to install). After detecting the pattern, the indicator notifies of that by a pop-up window, a mobile notification and an email. The indicator highlights the process of the pattern formation and not just the complete pattern. In the former case, it is displayed in the contour triangles. After the pattern is com
This is a trend indicator without redrawing Developed instead of the binary options strategy (by the color of the Martingale candlestick) Also works well in forex trading When to open trades (binary options) A signal will appear in the place with a candle signaling the current candle It is recommended to open a deal for one candle of the current timeframe M1 and M5 When a blue dot appears, open a deal up When a red dot appears, open a trade down. How to open trades on Forex. When a signal is rec
KDJ Index 4   交易实用必备工具指标 波浪自动计算指标,通道趋势交易 完美的趋势-波浪自动计算通道计算 , MT4版本 完美的趋势-波浪自动计算通道计算 , MT5版本 本地跟单复制交易 Easy And Fast Copy , MT4版本 Easy And Fast Copy , MT5版本 本地跟单复制交易 模拟试用 Easy And Fast Copy , MT4 模拟账号运行 Easy And Fast Copy , MT5 模拟账号运行 "Cooperative QQ:556024  "  "Cooperation wechat:556024"  "Cooperative email:556024@qq.com" 强烈推荐趋势指标, 波浪的标准自动计算   和   波浪的标准自动计算MT5版本     KDJ指标又叫 随机指标 ,是一种相当新颖、实用的技术分析指标,它起先用于期货市场的分析,后被广泛用于股市的中短期趋势分析,是期货和股票市场上最常用的技术分析工具。 随机指标KDJ一般是用于股票分析的统计体系,根据统计学原理,通过一个特定的周期(常为9日、9周等
"The Squeeze indicator attempts to identify periods of consolidation in a market. In general the market is either in a period of quiet consolidation or vertical price discovery. By identifying these calm periods, we have a better opportunity of getting into trades with the potential for larger moves. Once a market enters into a "squeeze," we watch the overall market momentum to help forecast the market direction and await a release of market energy." The StdATR Squeeze Channel combines standard
Binary Options Support Resistance Indicator This indicator is designed for binary options trading and effectively shows retracements from support and resistance levels. Signals appear on the current candle. A red arrow pointing downwards indicates a potential selling opportunity, while a blue arrow pointing upwards suggests buying opportunities. All that needs adjustment is the color of the signal arrows. It is recommended to use it on the M1-M5 timeframes as signals are frequent on these timef
Fx Perfect Signal indicator is designed for signal trading. This indicator generates trend signals.  It uses many algorithms and indicators to generate this signal. It tries to generate a signal from the points with the highest trend potential. This indicator is a complete trading product. This indicator does not need any additional indicators.  The indicator certainly does not repaint. The point at which the signal is given does not change.  Thanks to the alert features you can get the signals
Power Renko is an indicator which plots Renko bricks underneath the chart using a histogram. You can select the brick size and the timeframe of the Renko bricks as well as whether or not to use the close price or the high/low price of the candles. Renko bricks are based on price alone, not time, therefor the Renko bricks will not be aligned with the chart's time. They are extremely useful for trend trading and many different strategies can be formed from them. Buffers are provided allowing you t
The indicator is designed for opening trades for a long period. he is set up to get as many points from each trade as possible. he uses the scalping method... you can trade on any currency pairs indicator is already  you can trade at any time of the day but the preferred time of trading during the European American session. currency pairs eur / jpy, eur / usd currency pairs with high volatility then the results are much better.
SystemBinaryM1 - a professional indicator for trading short-term binary options, is a complete, self-contained author's strategy for working in the binary options market. The unique algorithm for analyzing the foreign exchange market is based on the calculation of reference points on three different time periods M15, M5. M1. Thus, the indicator simultaneously analyzes the long-term, medium-term and short-term price behavior before issuing a signal. The indicator is set in the usual way and work
Rira Renko
Vitor Palmeira Abbehusen
RENKO on Time Chart This indicator is an enhanced Renko, so you can watch the Renko bricks on the chart to understand price movement more clearly the other improvement is automated box size according to ATR (Average True Range) period you can set the ATR number as you want and the box size of Renko changes automatically based on price movement Inputs Mode: Box size is the input to specify the size of the Renko box you want to print on the chart. This input lets you choose the fixed b
Indicator captures the trend reversals with no-repaint Buy and Sell Arrow signals. CyberZingFx Trend Reversal Indicator - your go-to solution for accurate and reliable trend reversal signals. With its  advanced trading strategy , the indicator offers you Buy and Sell Arrow signals that do not repaint, making it a reliable tool for catching Swing Highs and Swing Lows in any market and any time frame. Indicator works on  any market  and  any time frames . __________________________________________
This indicator triggers an alert for one of the most popular methods used in Stochastic Oscillator. This is as follow: a buying alert when the Oscillator (either MAIN [%K] or SIGNAL [%D]) falls below a specific level (e.g., 20) and then rises above that level. a selling alert when the Oscillator rises above a specific level (e.g., 80) and then falls below that level. Note: this tool was developed based on the code of Stochastic Oscillator indicator included by default in MetaTrader 4 terminal
BeST_Keltner  Channels Variations & Strategies   is an   MT4  Indicator based on the original  Keltner Channels Technical Analysis Indicator and it is a very useful Visual Tool that can display in the Chart all the known Variations of Keltener Channels and also the corresponding 10 totally Strategies   i.e. all ENTRY signals (BUY and SELL) and also any corresponding EXIT signal, in which the Enrty and Exit Signals are derived exclusively by using Keltner Channels Variations. Every variation of K
This indicator is based on the Weis wave principle of wave volume. Below are few features of the indicator It draws the wave on the chart while the accumulated volume per wave in a different window at the bottom of the chart You can configure the turning point move It displays the accumulated volume (in thousands, eg for 15000 volume it will show 15) at the end of each wave You can also configure to show number of candles in the wave along with the wave volume The indicator calculates the distin
This    Nice Trade Point     indicator is designed for signal trading. This indicator generates trend signals. It uses many algorithms and indicators to generate this signal. It tries to generate a signal from the points with the highest trend potential. This indicator is a complete trading product. This indicator does not need any additional indicators. The indicator certainly does not repaint. The point at which the signal is given does not change.     Features and Suggestions Time
BB St Dev BB St Dev is analogous to the Bollinger indicator. Upper and lower parts of the Bollinger channel are calculated by means of iStdDev . iStdDev is a standard indicator of МetaТrader 4. Moving average has a special smoothing algorithm. Settings M - period of Moving average BandsDeviations parameter - channel generation factor. Apart from classic Bollinger Bands, BandsDeviations can possess any value here. Visio parameter If Visio = False , this indicator will coincide with the Bollinger
このプロダクトを購入した人は以下も購入しています
Gann Made Easy は、ミスター・ギャンの理論を使用した取引の最良の原則に基づいた、プロフェッショナルで使いやすい外国為替取引システムです。 W・D・ガン。このインジケーターは、ストップロスとテイクプロフィットレベルを含む正確な買いと売りのシグナルを提供します。 PUSH通知を利用して外出先でも取引可能です。 購入後はご連絡ください!私の取引のヒントと素晴らしいボーナスインジケーターを無料で共有します! おそらく、ギャンの取引手法についてはすでに何度も聞いたことがあるでしょう。通常、ギャンの理論は初心者のトレーダーだけでなく、すでにある程度の取引経験がある人にとっても非常に複雑なものです。なぜなら、ギャンの取引手法は理論的にはそれほど簡単に適用できるものではないからです。私はその知識を磨き、最良の原則を私の外国為替インジケーターに組み込むために数年を費やしました。 このインジケーターは非常に簡単に適用できます。必要なのは、それをチャートに添付し、簡単な取引推奨事項に従うだけです。このインジケーターは常に市場分析の仕事を行い、取引の機会を探します。適切なエントリーポイントを検出
驚異的なFXインジケーター「Miraculous」をご紹介します。完璧な結果を得るための1時間足を含むすべてのタイムフレームで効果的に機能する、最強の強力な特殊MT4フォレックスインジケーターです。 すべてのタイムフレームで優れた結果を提供する最高のFXインジケーターを探し続けるのに疲れましたか?これ以上探す必要はありません!「Miraculous」フォレックスインジケーターをご紹介します。このインジケーターは、トレーディングの経験を変革し、収益を新たなレベルに引き上げるために設計されました。 先進のテクノロジーと長年にわたる緻密な開発に基づいて構築された「Miraculous」フォレックスインジケーターは、FX市場における力と正確さの頂点となります。この素晴らしいツールは、すべてのレベルのトレーダーのニーズを満たすように設計されており、一貫した収益性を追求する上で比類のない優位性を提供します。 「Miraculous」フォレックスインジケーターの他との違いは、その非常に適応性にあります。デイトレーダー、スウィングトレーダーであろうと、長期ポジションを好む方であろうと、このインジケータ
現在20%OFF! 初心者やエキスパートトレーダーのためのベストソリューション! このダッシュボードソフトウェアは、28の通貨ペアで動作しています。それは私達の主要な指標(高度な通貨の強さ28と高度な通貨インパルス)の2に基づいています。それは全体の外国為替市場の大きい概観を与えます。それは、すべての(9)時間枠で28の外国為替ペアのための高度な通貨の強さの値、通貨の動きの速度と信号を示しています。チャート上で1つのインディケータを使用して市場全体を観察し、トレンドやスキャルピングの機会をピンポイントで見つけることができたら、あなたのトレードがどのように改善されるか想像してみてください。 このインディケータには、強い通貨と弱い通貨の識別、潜在的な取引の識別と確認がより簡単になるような機能が搭載されています。このインディケータは、通貨の強さや弱さが増加しているか減少しているか、また、すべての時間枠でどのように機能しているかをグラフィカルに表示します。 新機能として、現在の市場環境の変化に適応するダイナミックなマーケットフィボナッチレベルが追加され、すでに当社のAdvan
まず第一に、この取引インジケーターは再描画されず、再描画されず、遅延しないことを強調する価値があります。これにより、手動取引とロボット取引の両方に理想的なものになります。 アトミックアナリストは、価格の強さとモメンタムを利用して市場でより良いエッジを見つけるためのPA価格アクションインジケーターです。ノイズや誤ったシグナルを除去し、取引ポテンシャルを高めるための高度なフィルターを備えています。複雑なインジケーターの複数のレイヤーを使用して、アトミックアナリストはチャートをスキャンし、複雑な数学的計算をシンプルなシグナルと色に変換します。これにより、どのような初心者トレーダーでも理解して使用し、一貫した取引の決定を行うことができます。 「アトミックアナリスト」は、新規および経験豊富なトレーダー向けにカスタマイズされた包括的な取引ソリューションです。プレミアムインジケーターとトップノッチの機能を1つの取引戦略に組み合わせ、すべてのタイプのトレーダーにとって汎用性のある選択肢にします。 デイリートレーディングとスキャルピング戦略:高速で正確なデイトレーディングおよび短期トレード
TPSpro TRENDPRO  - is a trend indicator that automatically analyzes the market and provides information about the trend and each of its changes, as well as giving signals for entering trades without redrawing! The indicator uses each candle, analyzing them separately. referring to different impulses - up or down impulse. Exact entry points into transactions for currencies, crypto, metals, stocks, indices!  -  Version MT5               DETAILED DESCRIPTION        /       TRADING SETUPS           
A key element in trading is zones or levels from which decisions to buy or sell a trading instrument are made. Despite attempts by major players to conceal their presence in the market, they inevitably leave traces. Our task was to learn how to identify these traces and interpret them correctly. Reversal First Impulse levels (RFI)   -  Version MT5                INSTRUCTIONS                 RUS                 ENG                                       R ecommended to use with an indicator   -  
ご紹介   クォンタム トレンド スナイパー インジケーターは 、トレンド反転を特定して取引する方法を変革する画期的な MQL5 インジケーターです。 13年以上の取引経験を持つ経験豊富なトレーダーのチームによって開発されました。     クォンタムトレンドスナイパーインジケーター   は、非常に高い精度でトレンドの反転を識別する革新的な方法で、あなたのトレーディングの旅を新たな高みに押し上げるように設計されています。 ***Quantum Trend Sniper Indicatorを購入すると、Quantum Breakout Indicatorを無料で入手できます!*** クォンタム ブレイクアウト インジケーターは、トレンドの反転を特定するとアラートを発し、矢印を示し、3 つのテイクプロフィットレベルを提案します。 初心者トレーダーにもプロのトレーダーにも適しています。 量子EAチャネル:       ここをクリック MT5のバージョン:       ここをクリック 推奨事項: 期間: すべての時間枠。最良の結果を得るには、
現在26%オフ 初心者やエキスパートトレーダーに最適なソリューション! このインジケーターは、独自の機能と新しい計算式を取り入れた、ユニークで高品質、かつ手頃な価格のトレーディングツールです。たった1枚のチャートで28の為替ペアの通貨強度を読み取ることができます。新しいトレンドやスキャルピングチャンスの引き金となるポイントを正確に特定することができるので、あなたのトレードがどのように改善されるか想像してみてください。 ユーザーマニュアルはこちら  https://www.mql5.com/en/blogs/post/697384 これが最初の1本、オリジナルだ! 価値のないクローンを買わないでください。 特別な サブウィンドウの矢印で強い通貨の勢いを表示 GAPがあなたのトレードを導く! 基準通貨や気配値が売られすぎ・買われすぎのゾーン(外相フィボナッチレベル)にあるとき、個別チャートのメインウィンドウに警告表示。 通貨がレンジの外側から反落した場合、プルバック/リバーサルのアラート。 クロスパターンの特別なアラート 複数の時間枠を選択可能で、トレンドを素早く
TrendMaestro
Stefano Frisetti
5 (2)
note: this indicator is for METATRADER4, if you want the version for METATRADER5 this is the link: TRENDMAESTRO recognizes a new TREND in the bud, he never makes mistakes. The certainty of identifying a new TREND is priceless. DESCRIPTION TRENDMAESTRO identifies a new TREND in the bud, this indicator examines the volatility, volumes and momentum to identify the moment in which there is an explosion of one or more of these data and therefore the moment in which prices have strong probability of f
An exclusive indicator that utilizes an innovative algorithm to swiftly and accurately determine the market trend. The indicator automatically calculates opening, closing, and profit levels, providing detailed trading statistics. With these features, you can choose the most appropriate trading instrument for the current market conditions. Additionally, you can easily integrate your own arrow indicators into Scalper Inside Pro to quickly evaluate their statistics and profitability. Scalper Inside
まず第一に、この取引ツールはノンリペイント、ノンリドロー、ノンラグの指標であり、プロの取引に理想的ですことを強調する価値があります。 スマートプライスアクションコンセプトインジケーターは、新米から経験豊富なトレーダーまで、非常 に強力なツールです。Inner Circle Trader AnalysisやSmart Money Concepts Trading Strategiesなど、20以上の有用な指標を1つに組み合わせています。このインジケーターはスマートマネーコンセプトに焦点を当て、大手機関の取引方法を提供し、彼らの動きを予測するのに役立ちます。 特に、流動性分析に優れており、機関がどのように取引しているかを理解しやすくしています。市場のトレンドを予測し、価格の動きを慎重に分析するのに優れています。機関の戦略とトレードを合わせることで、市場の動向についてより正確な予測ができます。このインジケーターは多目的であり、市場構造を分析し、重要な注文ブロックを特定し、さまざまなパターンを認識するのに優れています。 このインジケーターはBOSやCHoCHなどのパターンの識
Trend Screener
STE S.S.COMPANY
4.83 (86)
トレンドインジケーター、1つのツールに組み込まれたすべての重要なトレンド機能を備えたトレンドトレーディングとフィルタリングのための画期的なユニークなソリューション! これは、すべてのシンボル/商品(外国為替、商品、暗号通貨、インデックス、株式)で使用できる100%再描画されていないマルチタイムフレームおよびマルチ通貨インジケーターです。 トレンドスクリーナーは、チャート内のドットで矢印トレンドシグナルを提供するインジケーターに続く効率的なインジケーターです。 トレンド分析インジケーターで使用できる機能: 1.トレンドスキャナー。 2.最大利益分析を備えたトレンドライン。 3.トレンド通貨強度メーター。 4.アラート付きのトレンド反転ドット。 5.アラート付きの強いトレンドドット。 6.トレンド矢印 毎日の分析例、毎日のシグナルパフォーマンス...など、トレンドスクリーナーインジケーターを使用して、ここで見つけることができます: ここをクリックしてください 期間限定オファー:トレンドスクリーナーインジケーターは、50ドルと生涯でのみご利用いただけます。 (元の価格125 $) MQ
Step into the realm of Forex trading with confidence and precision using XQ, a cutting-edge Forex indicator designed to elevate your trading game to unprecedented heights. Whether you're a seasoned trader or just stepping into the world of currency exchange,   XQ Forex Indicator   empowers you with the insights and signals needed to make informed trading decisions. The signal conditions are a combination of three indicators, and XQ Forex Indicator only display  medium and long-term trends . The
ご紹介     Quantum Breakout PRO は 、ブレイクアウト ゾーンの取引方法を変革する画期的な MQL5 インジケーターです。 13年以上の取引経験を持つ経験豊富なトレーダーのチームによって開発された Quantum Breakout PROは 、革新的でダイナミックなブレイクアウトゾーン戦略により、あなたの取引の旅を新たな高みに押し上げるように設計されています。 クォンタム ブレイクアウト インジケーターは、5 つの利益ターゲット ゾーンを備えたブレイクアウト ゾーン上のシグナル矢印と、ブレイクアウト ボックスに基づいたストップロスの提案を提供します。 初心者トレーダーにもプロのトレーダーにも適しています。 量子EAチャネル:       ここをクリック MT5バージョン:   ここをクリック 重要!購入後、インストールマニュアルを受け取るためにプライベートメッセージを送ってください。 推奨事項: 時間枠: M15 通貨ペア: GBPJPY、EURJPY、USDJPY、NZDUSD、XAUUSD アカウントの種類: ECN、Raw、また
PRO Renko Systemは、特別にRENKOチャートを取引するために設計された高精度の取引システムです。 これは、様々な取引商品に適用することができる普遍的なシステムです。 システムは効果的に正確な逆転信号へのアクセスを与えるいわゆる市場の騒音を中和する。 表示器は非常に使いやすく、信号の生成に責任がある1つの変数だけがあります。 あなたは簡単にお好みの任意の取引ツールとレンコバーのサイズにツールを適応させることができます。 私はいつもあなたが私のソフトウェアで収益性の高い取引を支援するために余分なサポートを提供する準備ができています! 私はあなたに幸せで収益性の高い取引をしたいです! ご購入後にご連絡ください! 私はあなたに私のレンコチャートジェネレータを送信します。 私はまた、私の個人的な推奨事項やシステムの他のモジュールを無料で共有します!
mql5と Telegramの モーニング・ブリーフィングで、詳細とスクリーンショットを含む毎日のマーケット・アップデートをご覧 ください! FX Power MT4 NGは 、長年の人気を誇る通貨強度計FX Powerの次世代モデルです。 この次世代ストレングスメーターは何を提供するのでしょうか?初代FXパワーの魅力すべて プラス GOLD/XAUの強さ分析 より正確な計算結果 個別に設定可能な分析期間 カスタマイズ可能な計算上限値により、さらに優れたパフォーマンスを実現 もっと見たい人のための特別なマルチインスタンス設定 すべてのチャートでお好みの色を無限に設定可能 数え切れないほどの通知オプションにより、重要なことを見逃すことはありません。 Windows 11とmacOSのスタイルで角を丸くした新しいデザイン 魔法のように動くインジケーターパネル FXパワーの主な機能 すべての主要通貨の強さの完全な履歴 すべての時間枠における通貨の強さの履歴 すべてのブローカーとチャートで同一の計算結果 100%信頼できるリアルタイム計算 -> リペイントなし ドロップダウン・リストから
ON Trade Waves Patterns Harmonic Elliot Wolfeをご紹介します。これは手動および自動の方法を使用して市場のさまざまなパターンを検出するために設計された高度なインジケーターです。以下はその動作方法です: ハーモニックパターン: このインジケーターは、チャートに表示されるハーモニックパターンを識別できます。これらのパターンは、Scott Carneyの「Harmonic Trading vol 1および2」で説明されているように、ハーモニックトレーディング理論を実践するトレーダーにとって重要です。手動で描画するか、自動検出に頼るかにかかわらず、ON Trade Waves Patternsがお手伝いします。 コントロールパネル: このインジケーターはユーザーフレンドリーなコントロールパネルを備えています。チャートと時間枠の設定を保存し、異なる構成間をスムーズに切り替えることができます。チャートスペースを最大限に活用するために最小化することもできます。他の分析ツールで作業することを好む場合、閉じるボタンをクリックするだけで、すべてのインジケーターデ
Advanced Supply Demand
Bernhard Schweigert
4.92 (310)
現在33%オフ 初心者にもエキスパートトレーダーにも最適なソリューション このインジケーターは独自の機能と新しい公式を多数内蔵しており、ユニークで高品質かつ手頃な取引ツールです。このアップデートでは、2つの時間枠ゾーンを表示できるようになります。より長いTFだけでなく、チャートTFとより長いTF(ネストゾーンを表示)の両方を表示できます。すべてのSupply Demandトレーダーの皆さんのお気に召すはずです。:) 重要情報の公開 Advanced Supply Demandの可能性を最大化するには、 https://www.mql5.com/ja/blogs/post/720245 にアクセスしてください。   エントリーまたはターゲットの正確なトリガーポイントを正確に特定できれば取引がどのように改善されるか想像してみてください。新しい基盤となるアルゴリズムに基づいて構築されているため、買い手と売り手の間の潜在的な不均衡をさらに簡単に特定できます。これは、最も強い需要と供給のゾーンと、過去のパフォーマンス(古いゾーンを表示)がグラフィカルに表現されるためです。これらの機能は、最適
カスタムMT4インジケーターで外国為替取引を成功させるための秘密を発見してください! 外国為替市場で成功を達成し、リスクを最小限に抑えながら一貫して利益を得る方法を疑問に思ったことはありますか? これがあなたが探している答えです! 取引へのアプローチに革命をもたらす独自のMT4インジケーターを導入できるようにします。 ユニークな汎用性 私たちのインジケータは、RenkoとRangeBarのろうそくのフォーメーションを好むユーザー向けに特別に設計されています。 これらのチャートタイプは多くの経験豊富なトレーダーに好まれていることを理解しています。そのため、私たちのインジケーターはそれらとシームレスに統合され、比類のない市場分析を提供します。 クリアトレンドシグナル 複雑な分析を忘れてください! 私たちのインジケーターは、鮮やかな色と明確なドット構造を利用して、市場の動向を明確に示しています。 赤と青の点は、価格の動きの方向性について疑いの余地がなく、取引の迅速な意思決定を可能にします。 HH/HL HL/LL戦略とのアライメント HH/HLおよびHL/LL構
通貨強さウィザードは、取引を成功させるためのオールインワン ソリューションを提供する非常に強力な指標です。このインジケーターは、複数の時間枠のすべての通貨のデータを使用して、このまたはその外国為替ペアのパワーを計算します。このデータは、使いやすい通貨インデックスと通貨パワーラインの形式で表され、特定の通貨のパワーを確認するために使用できます。 必要なのは、取引したいチャートにインジケーターを接続することだけです。インジケーターは、取引する通貨の実際の強さを示します。このインジケーターは、トレンドに合わせて取引するときに有利に利用できる売買高の圧力の極値も示します。このインジケーターには、フィボナッチに基づく可能なターゲットも表示されます。 このインジケーターは、PUSH 通知を含むあらゆるタイプのアラートを提供します。 購入後ご連絡下さい。私の取引のヒントをあなたと共有し、素晴らしいボーナスインジケーターを無料で提供します! 幸せで有益な取引をお祈りします。
Scalper Vault は、スキャルピングを成功させるために必要なすべてを提供するプロフェッショナルなスキャルピング システムです。このインジケーターは、外国為替およびバイナリー オプションのトレーダーが使用できる完全な取引システムです。推奨される時間枠は M5 です。 システムは、トレンドの方向に正確な矢印シグナルを提供します。また、トップとボトムのシグナルとギャン マーケット レベルも提供します。 インジケーターは、プッシュ通知を含むすべてのタイプのアラートを提供します。 インジケータの購入後にご連絡ください。私の個人的な取引の推奨事項と素晴らしいボーナス指標を無料で共有します! 幸せで有益な取引をお祈りします!
これはMT4のインジケーターで、再描画なしで取引に参入するための正確なシグナルを提供します。 外国為替、暗号通貨、金属、株式、インデックスなど、あらゆる金融資産に適用できます。かなり正確な見積もりを提供し、取引を開始して終了するのに最適な時期を教えてくれます。1つのシグナルを処理しただけでインジケーターの元が取れた例の 動画 (6:22)をご覧ください。Entry PointsPro インジケーターの助けを借りたほとんどのトレーダーの最初の1週間の結果が改善しています。 Telegramグループ に登録してください。Entry Points Proインジケーターのメリットは次の通りです。 再描画のないエントリーシグナル 再描画されるインジケーターでは一度表示されたシグナルが削除されて大きな金銭的損失につながることがありますが、これと異なり、表示されて確認されたシグナルは消えることがありません。 エラーなしの取引開始 インジケーターアルゴリズムによって取引を開始する(資産を売買する)理想的な瞬間を見つけることができます。それを使用するすべてのトレーダーの成功率が向上します。
まず最初に、このトレーディングシステムがリペイントされず、再描画されず、遅延しないことを強調する価値があります。これにより、プロのトレーディングに最適な状態になります。 「スマートサポートアンドレジスタンストレーディングシステム」は、新規および経験豊富なトレーダー向けにカスタマイズされた高度なインジケーターです。この包括的なシステムは、7以上の戦略、10のインジケーター、およびデイトレード戦略、スイングトレード戦略、サポートおよびレジスタンス戦略、ローソク足パターン戦略、VWAP戦略、マルチタイムフレームトレンド戦略など、さまざまなトレーディングアプローチを組み合わせています。これは、矢印信号、エントリーポイント、出口ポイント、トレードアラート、より高い時間枠のトレンド分析、リアルタイムのトレードモニタリング、そして洞察力のあるトレンドとボリュームキャンドルの着色を提供します。自動的なサポートとレジスタンスの検出により、さまざまな市況下でトレーダーが的確な決定を下すのを支援する多面的なインジケーターとなっています。 スマートサポートアンドレジスタンストレーディングシステムは、
TrendDecoder Premium
Christophe, Pa Trouillas
5 (2)
レンジと次の動きを特定    |  トレンドの最も早いシグナルと強さを得る   |  反転の前に明確な出口を得る   |  価格がテストするフィボ・レベルを見つける。 非リペイント、非遅延インディケータ - マニュアルおよび自動売買に最適 - すべての資産、すべての時間単位に対応 期間限定キャンペーン   >> 50%OFF 購入後、 推奨セッティングについては、このチャンネルで私に連絡してください。 MT5 バージョン: ここをクリック BladeSCALPER   と   PowerZONES   を使った完全な方法を入手する どのようなものですか? TrendDECODERは、トレンド監視をシンプルかつ簡単にするための複数のイノベーションを集約したものです。 Projective TrendLine (投影トレンドライン) - 今後のトレンドのスピードリファレンス。 RealTime TrendLine vs. Projective TrendLine (リアルタイムトレンドライン vs. Projective TrendLine) - 市場が同じ方
TakePropips Donchian Trend Pro
Eric John Pajarillaga Aldana
4.82 (17)
TakePropips Donchian Trend Pro   (MT4) は、ドンチャン チャネルを使用してトレンドの方向を自動的に検出し、エントリーとエグジットの取引シグナルを提供する強力で効果的なツールです! この多機能インジケーターには、トレンド スキャナー、取引シグナル、統計パネル、スクリーナー、取引セッション、およびアラート履歴ダッシュボードが含まれます。取引シグナルを提供し、チャートを分析する時間を節約するように設計されています! ユーザー マニュアルとインストール ガイドは、ブログ投稿 (   https://www.mql5.com/en/blogs/post/751368   ) からダウンロードできます。 今日は 50% オフ! 98ドルから49ドルに値下げ! このインジケーターは、ストラテジー テスターでテストできます (ビジュアル モードを有効にします)。ライブ チャートでテストしたい場合は、7 日間の試用版を入手するようにメッセージを送ることもできます。 詳細については、説明の下にあるビデオ チュートリアルも利用できます。 ご不明な点やサポートが必
Zeusインジケーターのご紹介:トレーディングでの究極の利益ブレークスルーをサポートするツール。 このインジケーターは、ブレイクアウト戦略と深い分析の必要性を排除し、トレーディングを簡素化します。設定した時間フレームに基づいてゾーンを自動的に描画し、ストップロス(SL)、テイクプロフィット(TP)、トレーリングストップのレベルを提案します。 Zeusインジケーターは、価格が買いポイントまたは売りポイントに近づいた際に、すぐに通知し、シグナル矢印を表示します。さらに、4つの異なるテイクプロフィットレベルとさまざまなトレーリングストップオプションの推奨も行います。 このツールは初心者から熟練のトレーダーまで対応しています。 チャンネルサポート: こちらをクリック ストア: こちらをクリックしてください。 MT5バージョン: こちらをクリック おすすめ: 時間枠: M5またはM15 通貨ペア: すべての通貨ペアと互換性があります アカウントタイプ: すべてのアカウントタイプと互換性があります おすすめのストップロス: Zeusインジケーターが提供するSLの提案をご利用ください おすすめの
This indicator is unstoppable when combined with our other indicator called Katana . After purchase, send us a message and you could get Katana  for FREE as a BONUS!  You can also ask to join our private group where we discuss together with other members!  MT5 version: click here There are limited copies available at $45 (3 copies left). Next price is $99. Don't miss this great deal!  The Trend Forecasting indicator is a very unique & easy tool that is able to make prediction a
FX Volume
Daniel Stein
4.6 (35)
mql5と Telegramの モーニング・ブリーフィングで、詳細とスクリーンショットを含む毎日のマーケット・アップデートをご覧 ください! FX Volumeは、ブローカーの視点から市場のセンチメントをリアルに洞察する、最初で唯一の出来高インジケーターです。 ブローカーのような機関投資家が外国為替市場でどのようなポジションをとっているか、COTレポートよりもはるかに速く、素晴らしい洞察を提供します。 この情報をチャート上で直接見ることは、あなたの取引にとって真のゲームチェンジャーであり、画期的なソリューションです。 以下のようなユニークなマーケットデータ洞察から利益を得てください。 比率は 、通貨のロングポジションとショートポジションの比率をパーセントで表示します。 比率の変化は 、選択した期間内のロング比率とその変化率を表示します。 Volumes Totalは 、通貨の取引量(ロングとショート)の合計をロット単位で表示します。 Volumes Long :全通貨のロングポジションの取引量を表示します。 Volumes(ショート )は、全通貨のショートポジションの取引量を表示
このインジケータは、手動および自動的な方法でチャートに描かれたハーモニックパターンを検出します。ユーザーマニュアルは、このリンクから参照できます: あなたのレビューを追加し、入手するために私たちに連絡してください。 この製品をmt4で試すための無料版があります。 GartleyおよびNenstarパターンを検出するために使用できます。 https://www.mql5.com/en/market/product/30181 完全なMT4バージョンを購入するには、次の場所から購入できます。 https://www.mql5.com/en/market/product/15212 注 インジケータにはコントロールパネルがあり、すべての(チャート&時間枠)設定が保存されます。チャート上でスペースをより多く確保するために、最小化することができ、他の分析ツールで作業する場合は、すべてのインジケータデータを非表示にするために閉じるボタンを押すことができます。 このインジケータを使用して設定を変更し、移動平均やボリンジャーバンドなどのインジケータを追加すると、編集のテンプレートが自動的に保存され、必
Cycle Sniper
Elmira Memish
4.41 (34)
NEW YEAR SALE PRICE FOR LIMITED TIME!!! Please contact us after your purchase and we will send you the complimentary indicators to complete the system Cycle Sniper is not a holy grail but when you use it in a system which is explained in the videos, you will feel the difference. If you are not willing to focus on the charts designed with Cycle Sniper and other free tools we provide, we recommend not buying this indicator. We recommend watching the videos about the indiactor and system before pu
作者のその他のプロダクト
[跟单系统] T he most friendly Copier interactive interface, the most abundant easy-to-use functions, and the best Copy solution.    EASY   : Easy to use, load and select the Master or SLAVE to use easily  FAST:   Quickly copy orders, algorithmic optimal follow-up mechanism, priority calculation of new signals, priority queue processing received special signals Multiple:   1. Support multiple signals to be sent at the same time, multiple accounts can select multiple accounts to copy at the same time
[跟单系统] T he most friendly Copier interactive interface, the most abundant easy-to-use functions, and the best Copy solution.    EASY   : Easy to use, load and select the Master or SLAVE to use easily FAST:   Quickly copy orders, algorithmic optimal follow-up mechanism, priority calculation of new signals, priority queue processing received special signals Multiple:   1. Support multiple signals to be sent at the same time, multiple accounts can select multiple accounts to copy at the same time 2
The market price usually falls between the borders of the channel  . If the price is out of range, it is a trading signal or trading opportunity. Basically, Fit Channel can be used to help determine overbought and oversold conditions in the market. When the market price is close to the upper limit, the market is considered overbought (sell zone). Conversely, when the market price is close to the bottom range, the market is considered oversold (buy zone). However, the research can be used
Necessary for traders: tools and indicators Waves automatically calculate indicators, channel trend trading Perfect trend-wave automatic calculation channel calculation , MT4 Perfect trend-wave automatic calculation channel calculation , MT5 Local Trading copying Easy And Fast Copy , MT4 Easy And Fast Copy , MT5 Local Trading copying For DEMO Easy And Fast Copy , MT4 DEMO Easy And Fast Copy , MT5 DEMO 砖图 Renko PRO->>>   The display of the brick map on the main map. The Renko chart ideal
FREE
ピボット取引: 1.ppピボット 2. r1 r2 r3、s1 s2 s3 Necessary for traders: tools and indicators Waves automatically calculate indicators, channel trend trading Perfect trend-wave automatic calculation channel calculation , MT4 Perfect trend-wave automatic calculation channel calculation , MT5 Local Trading copying Easy And Fast Copy , MT4 Easy And Fast Copy , MT5 Local Trading copying For DEMO Easy And Fast Copy , MT4 DEMO Easy And Fast Copy , MT5 DEMO 協力QQ:556024 " 協力wechat:556024 " 協力メール:5560
FREE
MACDは類似性と差異の移動平均と呼ばれ、二重指数移動平均から作成されます。高速指数移動平均(EMA12)を低速指数移動平均(EMA26)から差し引いて、高速DIFを取得し、次に2× (Express DIF-DIFの9日間の加重移動平均DEA)MACDバーを取得します。 MACDの意味は、基本的に二重移動平均と同じです。つまり、高速移動平均と低速移動平均の分散と集約は、現在のロングショートステータスと株価の開発傾向の可能性を特徴づけますが、読む方が便利です。 MACDの変化は市場動向の変化を表し、さまざまなKラインレベルのMACDは、現在のレベルサイクルにおける売買傾向を表します。 1.このインジケーターは、MACDの2行表示を追加します。 2.そしてエネルギーカラムに4つの異なる勾配を適用します! トレンドインジケーター、 波動標準の自動計算 、 MT5バージョンの波動標準の自動計算を強くお勧めします   Necessary for traders: tools and indicators Waves automatically calculate indicators
FREE
ザ   トレーダーのベストパートナー!       取引アシスタント: これは非常に機能が豊富な取引支援ツールです。 開発は簡単ではありません。Pro をサポートしてください。クリックしてジャンプしてください。 KトレードアシスタントプロMT5 取引アシスタントの操作手順 基本的な使用設定 基本: 言語選択スイッチをサポート (現在中国語と英語をサポート)         自動言語認識 バインディングをサポート   ポジションを開閉するホットキー     、ショートカット キーを使用してポジションをすばやく開閉します...     ポジションを閉じるためのショートカット キー。 ロック解除はほとんどの機能をサポートします   リプレイ   で使用できる操作   テスト環境 オープンポジションとクローズポジション: ワンクリックでポジションをオープン (     テイクプロフィットとストップロスの便利な設定、ロットサイズの自動計算などの便利な機能を含む) ワンクリックで閉じる     (ロック)、ミニマリストスタイルのデザイン、クローズポジションのタイプ
FREE
ピボット取引: 1.ppピボット 2. r1 r2 r3、s1 s2 s3 Necessary for traders: tools and indicators Waves automatically calculate indicators, channel trend trading Perfect trend-wave automatic calculation channel calculation , MT4 Perfect trend-wave automatic calculation channel calculation , MT5 Local Trading copying Easy And Fast Copy , MT4 Easy And Fast Copy , MT5 Local Trading copying For DEMO Easy And Fast Copy , MT4 DEMO Easy And Fast Copy , MT5 DEMO トレンドインジケーター、 波動標準の自動計算 、 MT5バージョンの波動標準の自動計算を強くお勧めし
FREE
このインジケーターは、実際の取引に最適なウェーブ自動分析インジケーターです。 バンドの標準化された定義は、もはや異なる人々の波ではなく、人為的な干渉の描画が排除されます。これは、アプローチの厳密な分析において重要な役割を果たします。           現在購入割引!   =》 Increase the choice of international style mode, (red fall green rise style) インデックスの内容: 1.1。       基本波: まず、価格変動過程で基本変動の変曲点を見つけましたが、もちろん、彼の注文はそれほど強くないので、次の計算の基礎になります。 2.2。       二次帯域 :基本波に基づいて、アルゴリズム分析を通じてより明白な二次帯域が得られ、二次帯域は波解析の基礎を提供します 3.3。       波: より明確な傾向とより明確で直感的な方向性があります。波が続くかどうかを分析するには、二次波帯の形状を調べ、二次波の組成を分析して、その後の予測を取得する必要があります。波。 4.4。       チャネ
Necessary for traders: tools and indicators Waves automatically calculate indicators, channel trend trading Perfect trend-wave automatic calculation channel calculation , MT4 Perfect trend-wave automatic calculation channel calculation , MT5 Local Trading copying Easy And Fast Copy , MT4 Easy And Fast Copy , MT5 Local Trading copying For DEMO Easy And Fast Copy , MT4 DEMO Easy And Fast Copy , MT5 DEMO 高度なボリンジャーバンド: 1.ボリンジャーレールは方向によって色が変わります」 2.ボリンジャーアウターレールの伸縮はアウターレールの色の変化でマークされます。」 3.ボリンジャ
FREE
Necessary for traders: tools and indicators Waves automatically calculate indicators, channel trend trading Perfect trend-wave automatic calculation channel calculation , MT4 Perfect trend-wave automatic calculation channel calculation , MT5 Local Trading copying Easy And Fast Copy , MT4 Easy And Fast Copy , MT5 Local Trading copying For DEMO Easy And Fast Copy , MT4 DEMO Easy And Fast Copy , MT5 DEMO 砖图Renko PRO->>> The display of the brick map on the main map. The Renko chart ideally remo
FREE
このインジケーターは、実際の取引に最適なウェーブ自動分析インジケーターです。 バンドの標準化された定義は、もはや異なる人々の波ではなく、人為的な干渉の描画が排除されます。これは、アプローチの厳密な分析において重要な役割を果たします。         現在購入割引!   => Increase the choice of international style mode, (red fall green rise style) インデックスの内容: 1.1。     基本波: まず、価格変動過程で基本変動の変曲点を見つけましたが、もちろん、彼の注文はそれほど強くないので、次の計算の基礎になります。 2.2。     二次帯域 :基本波に基づいて、アルゴリズム分析を通じてより明白な二次帯域が得られ、二次帯域は波解析の基礎を提供します 3.3。     波: より明確な傾向とより明確で直感的な方向性があります。波が続くかどうかを分析するには、二次波帯の形状を調べ、二次波の組成を分析して、その後の予測を取得する必要があります。波。 4.4。     チャネル: チャネル計算で
Necessary for traders: tools and indicators Waves automatically calculate indicators, channel trend trading Perfect trend-wave automatic calculation channel calculation , MT4 Perfect trend-wave automatic calculation channel calculation , MT5 Local Trading copying Easy And Fast Copy , MT4 Easy And Fast Copy , MT5 Local Trading copying For DEMO Easy And Fast Copy , MT4 DEMO Easy And Fast Copy , MT5 DEMO "Cooperative QQ:556024"  "Cooperation wechat:556024"  "Cooperative email:556024@qq.com" Strong
FREE
Necessary for traders: tools and indicators Waves automatically calculate indicators, channel trend trading Perfect trend-wave automatic calculation channel calculation , MT4 Perfect trend-wave automatic calculation channel calculation , MT5 Local Trading copying Easy And Fast Copy , MT4 Easy And Fast Copy , MT5 Local Trading copying For DEMO Easy And Fast Copy , MT4 DEMO Easy And Fast Copy , MT5 DEMO 「協力QQ:556024」  「協力wechat:556024」  「協力メール:556024@qq.com」 トレンドインジケーター、 波動標準の自動計算 、 MT5バージョンの波動標準
FREE
トレーダーにとって最高のパートナー!     取引アシスタント: これは非常に機能が豊富な取引支援ツールです。 開発は簡単ではありません。Pro をサポートしてください。クリックしてジャンプしてください。 Kトレードアシスタントプロ   取引アシスタントの操作手順 基本的な使用設定 基本: 言語選択スイッチをサポート (現在中国語と英語をサポート)     言語を自動的に識別する バインディングをサポート   ポジションを開閉するホットキー     、ショートカット キーを使用してポジションをすばやく開閉します...     ポジションを閉じるためのショートカット キー。 ロック解除はほとんどの機能をサポートします   リプレイ   で使用できる操作   テスト環境 オープンポジションとクローズポジション: ワンクリックでポジションをオープン (     テイクプロフィットとストップロスの便利な設定、ロットサイズの自動計算などの便利な機能を含む) ワンクリックで閉じる     (ロック)、ミニマリストスタイルのデザイン、クロー
FREE
Necessary for traders: tools and indicators Waves automatically calculate indicators, channel trend trading Perfect trend-wave automatic calculation channel calculation , MT4 Perfect trend-wave automatic calculation channel calculation , MT5 Local Trading copying Easy And Fast Copy , MT4 Easy And Fast Copy , MT5 Local Trading copying For DEMO Easy And Fast Copy , MT4 DEMO Easy And Fast Copy , MT5 DEMO 高度なボリンジャーバンド: 1.ボリンジャーレールは方向によって色が変わります」 2.ボリンジャーアウターレールの伸縮はアウターレールの色の変化でマークされます。」 3.ボリンジャ
FREE
指標はトレンドフォロワー向けです! 3つの移動平均によって構築された取引システム。トレンドに合わせて取引し、利益を上げましょう。 Necessary for traders: tools and indicators Waves automatically calculate indicators, channel trend trading Perfect trend-wave automatic calculation channel calculation , MT4 Perfect trend-wave automatic calculation channel calculation , MT5 Local Trading copying Easy And Fast Copy , MT4 Easy And Fast Copy , MT5 Local Trading copying For DEMO Easy And Fast Copy , MT4 DEMO Easy And Fast Copy , MT5 DEMO トレンドインジケーター、 波動標準の自動計算 、
FREE
Necessary for traders: tools and indicators Waves automatically calculate indicators, channel trend trading Perfect trend-wave automatic calculation channel calculation , MT4 Perfect trend-wave automatic calculation channel calculation , MT5 Local Trading copying Easy And Fast Copy , MT4 Easy And Fast Copy , MT5 Local Trading copying For DEMO Easy And Fast Copy , MT4 DEMO Easy And Fast Copy , MT5 DEMO Fibo: from KTrade 1. Automatically calculate and analyze the band. -> Get the desired band 2.
FREE
XM Channel
Kaijun Wang
4.67 (3)
The market price usually falls between the borders of the channel . If the price is out of range, it is a trading signal or trading opportunity . Basically, Fit Channel can be used to help determine overbought and oversold conditions in the market. When the market price is close to the upper limit, the market is considered overbought (sell zone). Conversely, when the market price is close to the bottom range, the market is considered oversold (buy zone). However, the research can be used
Necessary for traders: tools and indicators Waves automatically calculate indicators, channel trend trading Perfect trend-wave automatic calculation channel calculation , MT4 Perfect trend-wave automatic calculation channel calculation , MT5 Local Trading copying Easy And Fast Copy , MT4 Easy And Fast Copy , MT5 Local Trading copying For DEMO Easy And Fast Copy , MT4 DEMO Easy And Fast Copy , MT5 DEMO The homeopathic indicator is also called the CCI indicator. The CCI indicator was propos
FREE
The market price usually falls between the borders of the channel    .   If the price is out of range , it is a trading signal or trading opportunity . Basically , Fit Channel can be used to help determine overbought and oversold conditions in the market. When the market price is close to the upper limit, the market is considered overbought (sell zone). Conversely, when the market price is close to the bottom range, the market is considered oversold (buy zone). However, the research can b
Necessary for traders: tools and indicators Waves automatically calculate indicators, channel trend trading Perfect trend-wave automatic calculation channel calculation , MT4 Perfect trend-wave automatic calculation channel calculation , MT5 Local Trading copying Easy And Fast Copy , MT4 Easy And Fast Copy , MT5 Local Trading copying For DEMO Easy And Fast Copy , MT4 DEMO Easy And Fast Copy , MT5 DEMO Strongly recommend trend indicators,   automatic calculation of wave standard   and   MT5 ve
FREE
Necessary for traders: tools and indicators Waves automatically calculate indicators, channel trend trading Perfect trend-wave automatic calculation channel calculation , MT4 Perfect trend-wave automatic calculation channel calculation , MT5 Local Trading copying Easy And Fast Copy , MT4 Easy And Fast Copy , MT5 Local Trading copying For DEMO Easy And Fast Copy , MT4 DEMO Easy And Fast Copy , MT5 DEMO MACD is called Convergence and Divergence Moving Average, which is developed from the double e
FREE
Necessary for traders: tools and indicators Waves automatically calculate indicators, channel trend trading Perfect trend-wave automatic calculation channel calculation , MT4 Perfect trend-wave automatic calculation channel calculation , MT5 Local Trading copying Easy And Fast Copy , MT4 Easy And Fast Copy , MT5 Local Trading copying For DEMO Easy And Fast Copy , MT4 DEMO Easy And Fast Copy , MT5 DEMO Can set the cycle for other varieties of K line graph covered this window, fluctuations obse
FREE
Necessary for traders: tools and indicators Waves automatically calculate indicators, channel trend trading Perfect trend-wave automatic calculation channel calculation , MT4 Perfect trend-wave automatic calculation channel calculation , MT5 Local Trading copying Easy And Fast Copy , MT4 Easy And Fast Copy , MT5 Local Trading copying For DEMO Easy And Fast Copy , MT4 DEMO Easy And Fast Copy , MT5 DEMO Fibo: from KTrade 1. Automatically calculate and analyze the band. -> Get the desired band 2.
FREE
Necessary for traders: tools and indicators Waves automatically calculate indicators, channel trend trading Perfect trend-wave automatic calculation channel calculation , MT4 Perfect trend-wave automatic calculation channel calculation , MT5 Local Trading copying Easy And Fast Copy , MT4 Easy And Fast Copy , MT5 Local Trading copying For DEMO Easy And Fast Copy , MT4 DEMO Easy And Fast Copy , MT5 DEMO The homeopathic indicator is also called the CCI indicator. The CCI indicator was propos
FREE
Donchian通道(唐奇安通道指标)是用于交易突破的最古老、最简单的技术指标之一。   一般来说,唐奇安通道的宽度越宽,市场波动就越大,而唐奇安通道越窄,市场波动性也就越小 。此外,价格走势可以穿过布林带,但你看不到唐奇安通道的这种特征,因为其波段正在测量特定时期的最高价和最低价。 交易实用必备工具指标 波浪自动计算指标,通道趋势交易 完美的趋势-波浪自动计算通道计算 , MT4版本 完美的趋势-波浪自动计算通道计算 , MT5版本 本地跟单复制交易 Easy And Fast Copy , MT4版本 Easy And Fast Copy , MT5版本 本地跟单复制交易 模拟试用 Easy And Fast Copy , MT4 模拟账号运行 Easy And Fast Copy , MT5 模拟账号运行 唐奇安通道指标计算: 唐奇安上阻力线 - 由过去N天的当日最高价的最大值形成。 唐奇安下支撑线 - 由过去N天的当日最低价的最小值形成。 中心线 - (上线 + 下线)/ 2   唐奇安通道信号   唐奇安通道常用作突破指标。它提供了两种主要类型的突破信号,一个是上阻力线或下支
FREE
Provide ideas for trend trading. Automatic calculation and generation of trend channels. The channel line, also known as the pipeline line, is to draw a straight line parallel to the trend line in the opposite direction of the trend line, and the straight line crosses the highest or lowest price of the recent period. These two lines run the price in the middle and have obvious pipe or channel shapes. Necessary for traders: tools and indicators Waves automatically calculate indicators, chann
Necessary for traders: tools and indicators Waves automatically calculate indicators, channel trend trading Perfect trend-wave automatic calculation channel calculation , MT4 Perfect trend-wave automatic calculation channel calculation , MT5 Local Trading copying Easy And Fast Copy , MT4 Easy And Fast Copy , MT5 Local Trading copying For DEMO Easy And Fast Copy , MT4 DEMO Easy And Fast Copy , MT5 DEMO Can set the cycle for other varieties of K line graph covered this window, fluctuations obse
FREE
フィルタ:
rainwalker123
3363
rainwalker123 2024.01.07 12:40 
 

Brilliant indicator, among the 97% of useless indis here on MQL5, Timing is the most important thing in trading. Congratz to the Author. Keep up the good work.

ed070279
20
ed070279 2023.04.29 09:00 
 

Крутой индикатор, отработка совместно с уровнями супер!

elite luis
3331
elite luis 2023.03.06 09:44 
 

Amazing indicator, another quality product from Author, Big Thank you! Author is super friendly and responsive, any issue he get it fix fast also he is open to idea suggestions and continously updating to improve his indicators, he is extremely passionate in what he is doing, deserved more than 5 stars for his dedication! Well Done!

*Bought both MT4+MT5, Best Buy for 2023!*

mueller74
440
mueller74 2021.06.10 17:13 
 

Fit Channel is an indicator that offers a great deal of utility. I considerate it a prime indicator which can be used to test additional indicators being considered for a particular strategy.

alfy87
885
alfy87 2021.04.24 22:54 
 

simple and cheap - combines amazingly with 2 other indicators I use.. thanks Kaijun

Kaijun Wang
128561
開発者からの返信 Kaijun Wang 2021.04.25 02:46
I am very happy to be able to play a role in your trading system.
レビューに返信
バージョン 8.88 2024.01.28
>>>>>>>>>>>>>>>
バージョン 7.88 2023.04.24
>>>>>>>>>>>>>>>>>
バージョン 6.88 2023.04.23
>>>>>>>>>>>
バージョン 5.88 2023.04.19
>>>>>>>>>>>>>>
バージョン 3.88 2023.04.18
>>>>>>>>>>>>>>>
バージョン 2.88 2023.04.10
>>>>>>>>>>>>
バージョン 2.80 2023.04.10
>>>>>
通道填充方案升级...
バージョン 2.20 2023.03.13
>>>>>>>>>>>>
バージョン 2.10 2023.03.06
>>>>>>>>>>>>>>>>>
バージョン 1.50 2021.07.30
>>>>>
增加碰触报警设置.
バージョン 1.30 2021.06.10
>>>更新中间条带的填充开关.