Donchian Like Channel MT5
- インディケータ
- Kaijun Wang
- バージョン: 1.0
Donchian通道(唐奇安通道指标)是用于交易突破的最古老、最简单的技术指标之一。 一般来说,唐奇安通道的宽度越宽,市场波动就越大,而唐奇安通道越窄,市场波动性也就越小。此外,价格走势可以穿过布林带,但你看不到唐奇安通道的这种特征,因为其波段正在测量特定时期的最高价和最低价。
交易实用必备工具指标
| 波浪自动计算指标,通道趋势交易 | 完美的趋势-波浪自动计算通道计算 , MT4版本 | 完美的趋势-波浪自动计算通道计算 , MT5版本 |
| 本地跟单复制交易 | Easy And Fast Copy , MT4版本 | Easy And Fast Copy , MT5版本 |
| 本地跟单复制交易 模拟试用 | Easy And Fast Copy , MT4 模拟账号运行 | Easy And Fast Copy , MT5 模拟账号运行 |
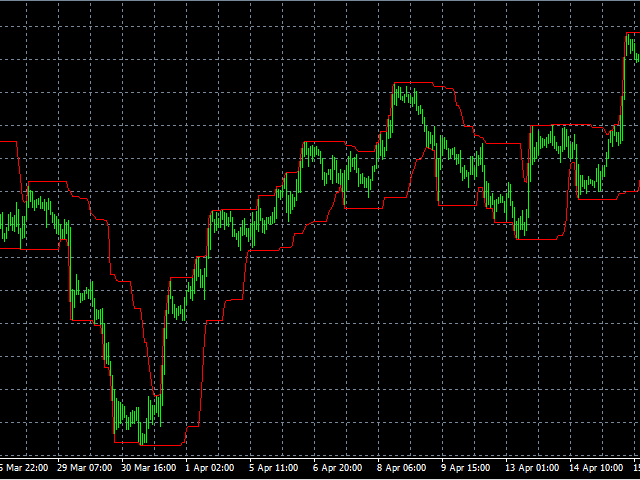
唐奇安通道指标计算:
唐奇安上阻力线 - 由过去N天的当日最高价的最大值形成。
唐奇安下支撑线 - 由过去N天的当日最低价的最小值形成。
中心线 - (上线 + 下线)/ 2
唐奇安通道信号
唐奇安通道常用作突破指标。它提供了两种主要类型的突破信号,一个是上阻力线或下支撑线,第二种突破信号是中心线交叉。
唐奇安通道策略主要是为了利用潜在趋势,因此当你使用这两个突破信号中的任何一个进入市场时,你将几乎可以捕获货币对中所有的新趋势。
唐奇安通道指标支撑/阻力线突围信号
趋势交易者通常是沿着突破的方向进场,预计会有很强劲的趋势跟进,从而导致趋势价格的波动。 使用唐奇安通道,当价格往上突破其上限时,做多;当价格往下突破其下限时,做空。

EXCELLENT INDICATOR