Aliquot level
- インディケータ
- Mark Nosov
- バージョン: 1.0
- アクティベーション: 20
The second indicator from the set for market analysis.
The first one is here: https://www.mql5.com/ru/market/product/65258
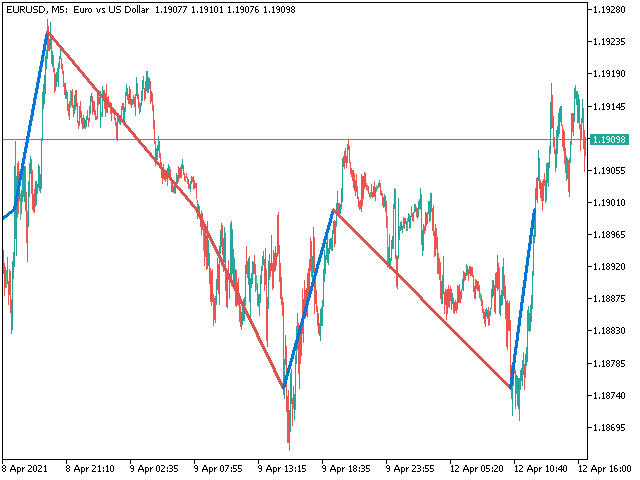
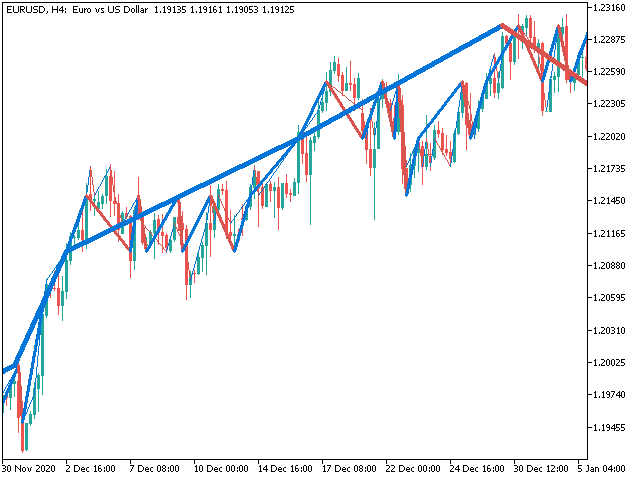
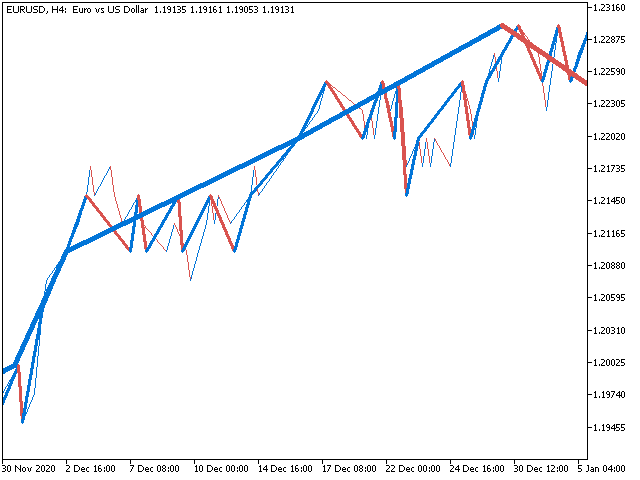
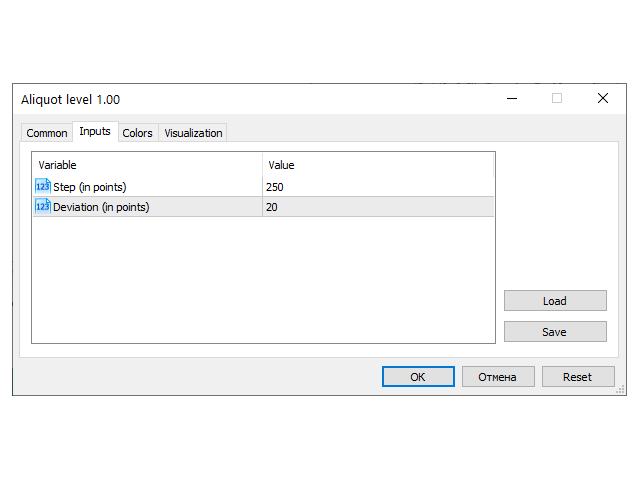
The indicator draws a line by levels where the price reaches a aliquot of the value in the Step parameter.
You can specify the spread of + - points from the required level.
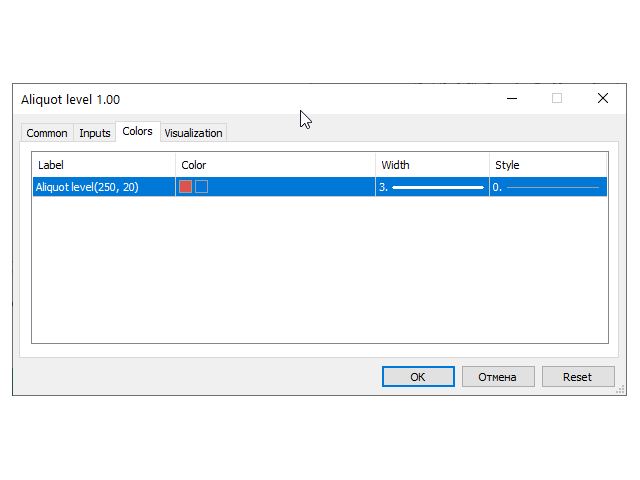
All color settings, line types are customizable.
Example:
Step - 500
Deviation - 20
If the symbol reaches the price for example 1.73500 + - 20, i.e. from 1.73480 to 1.73520, lines are being built. The next point will be at another level 1.73000 (from 1.72980 to 1.73020) or 1.74000 (from 1.73980 to 1.74020).
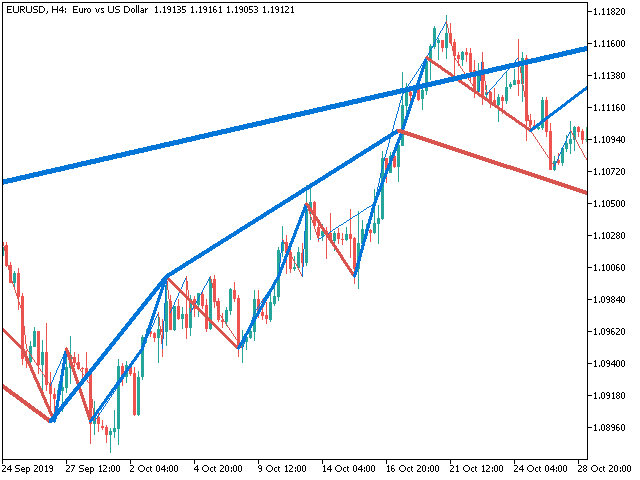
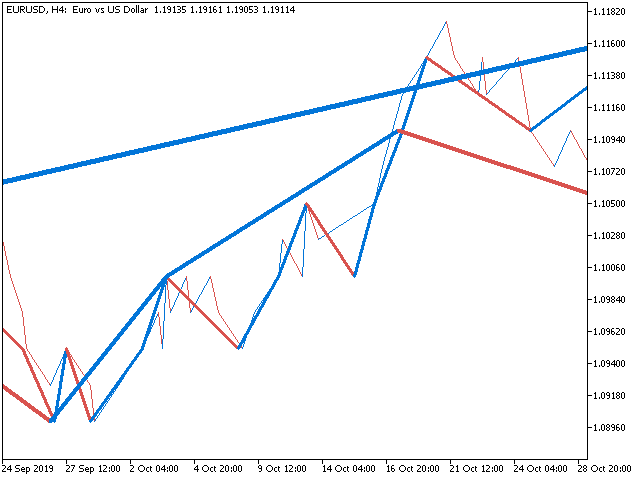
You can combine several indicators with different parameters at the same time.