Trading Strategy for MT5
- インディケータ
- Pavel Krysanov
- バージョン: 1.0
- アクティベーション: 10
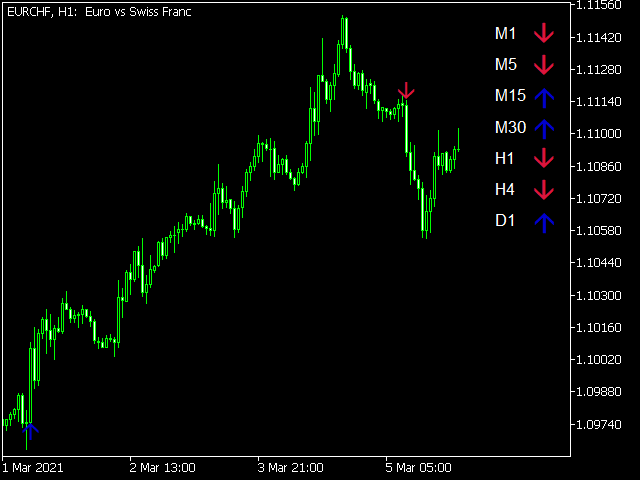
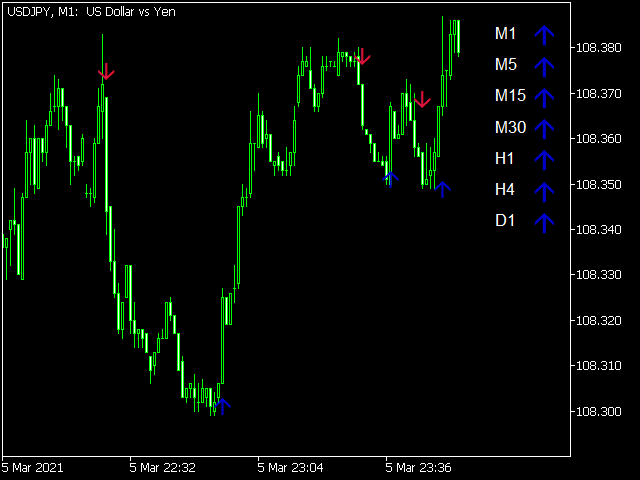
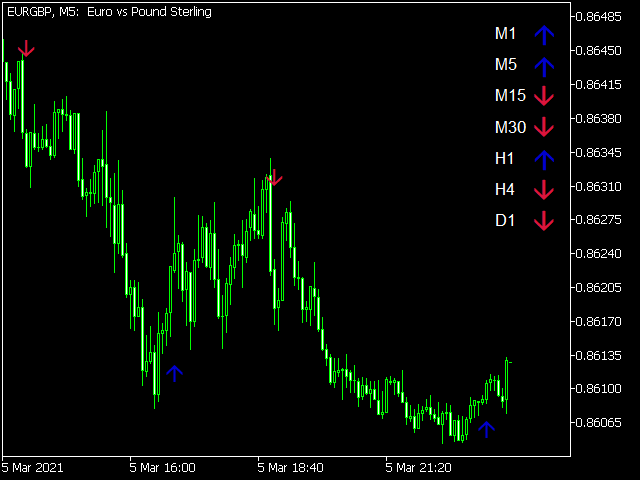
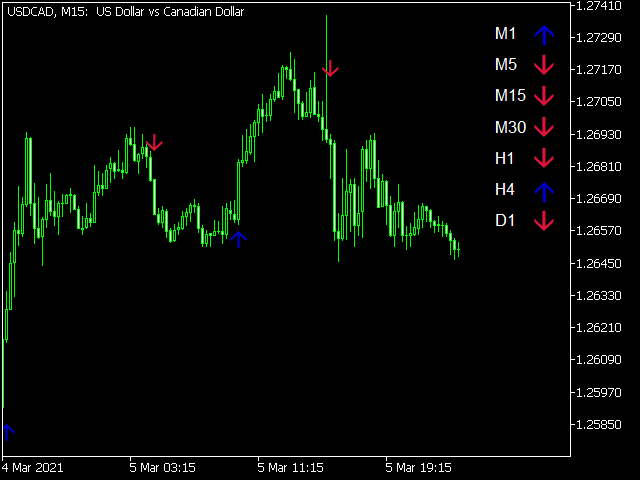
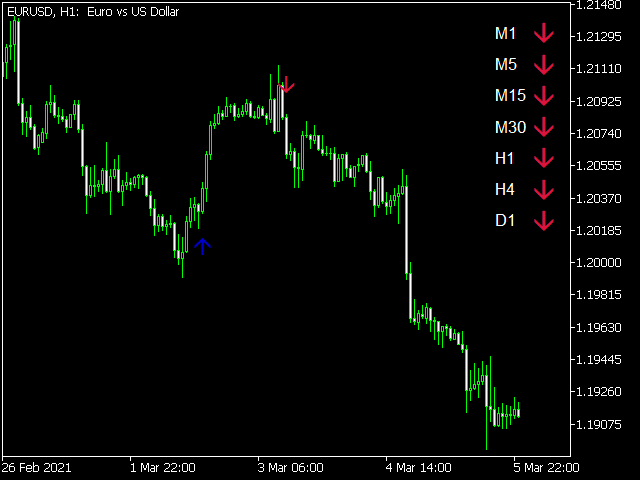
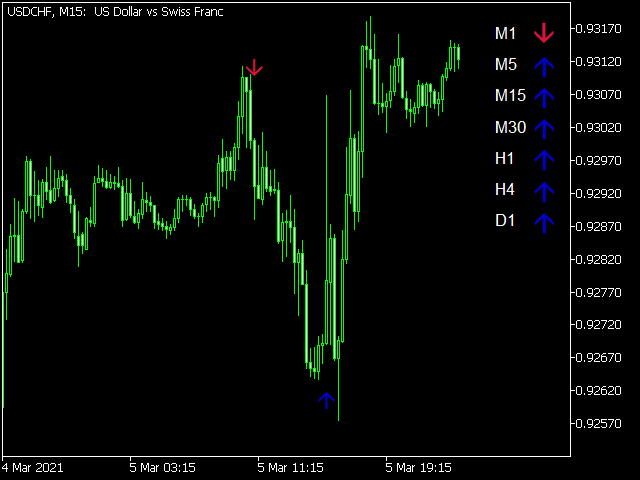
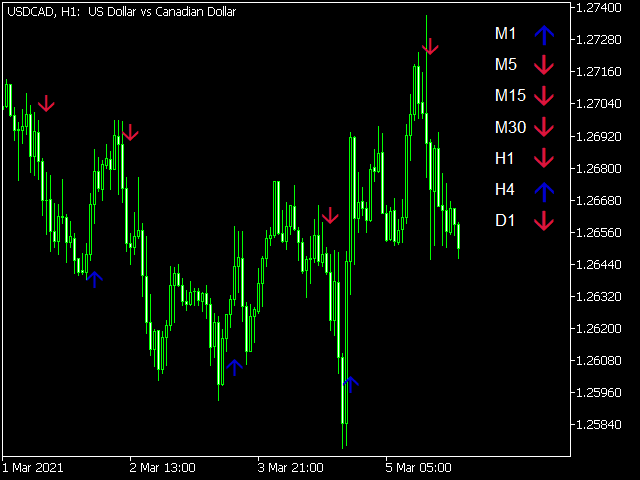
Индикатор Trading Strategy призван помочь трейдерам в поиске оптимальных входов в сделку и выходов из неё. В его основе лежат показания технических индикаторов (MA, RSI, ATR и др.), а также авторский алгоритм, связывающий их сигналы в единое целое. Индикатор даёт сигналы на покупку и продажу в виде стрелочек: стрелочка вверх — сигнал на покупку, вниз — на продажу.
В правом верхнем углу показаны сигналы индикатора на 6 таймфреймах (M1, M5, M15, M30, H1, H4) данной валютной пары.
Индикатор свои значения не перерисовывает: если стрелка появилась в некотором месте, она там и останется.
Есть аналог для MT4.
Параметры
- Power - период индикатора
- Alerts - включить/выключить оповещения при появлении сигнала
- EmailAlert - отправлять ли сообщения на электронную почту при появлении сигнала
- MobileAlert - отправлять ли сообщения на мобильный терминал при появлении сигнала
- Corner - угол привязки панели со значениями индикатора на разных таймфреймах
- X - Координата привязки панели по горизонтали
- Y - Начальная координата привязки панели по вертикали
- Show_[timeframe] - показывать ли данный таймфрейм на панели