• 概要
  • レビュー (40)
  • コメント (21)
  • 最新情報

Tabajara VWAP Ogro RSJ

4.81
Setup Tabajaraは、「ウォール街の鬼」として知られるブラジルのトレーダーによって作成されました。

この設定のアイデアは、トレーダーに価格の現在の傾向とグラフで探す必要のある操作のタイプを示すことです。
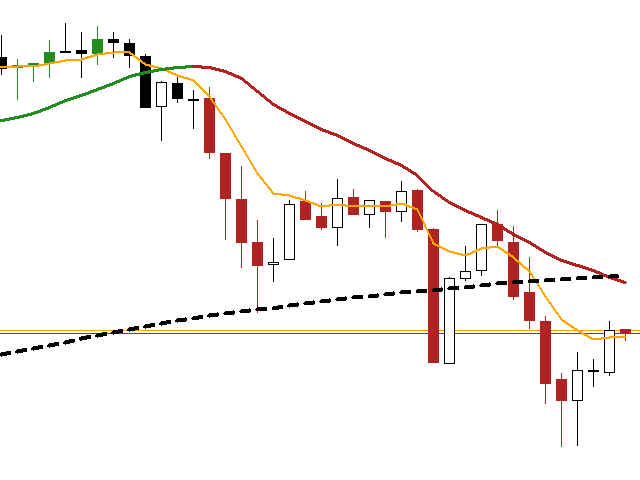
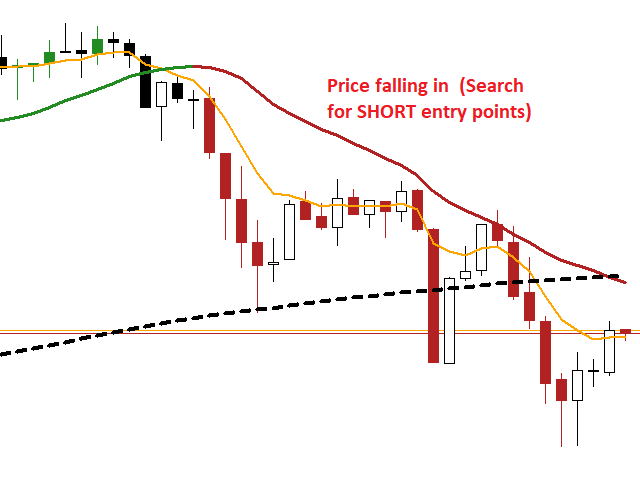
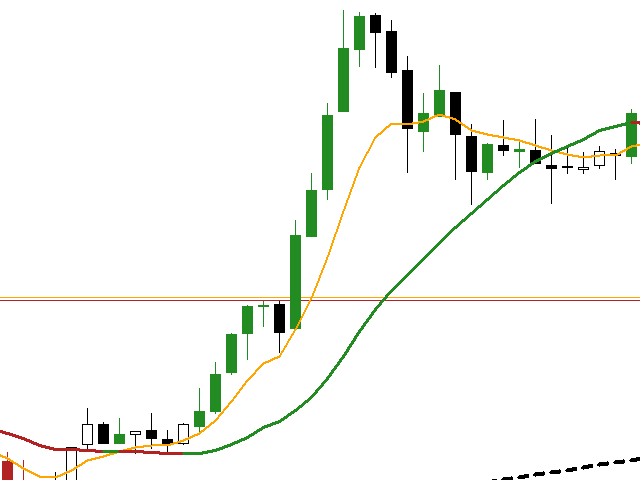
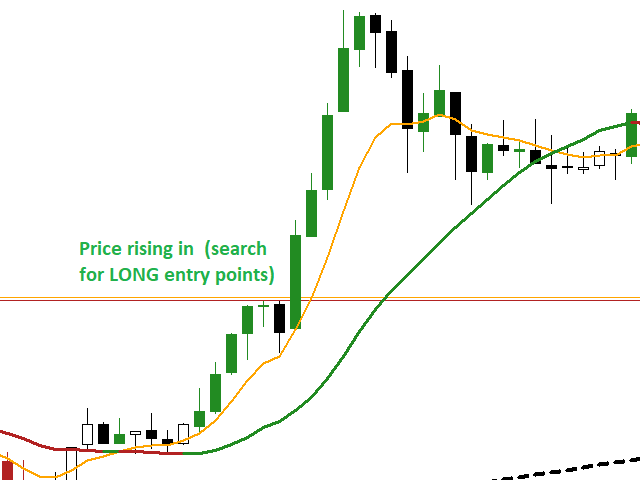
手術

  • これは、ろうそくの閉まりとVWAPを午前10時40分まで配置し、その後20期間の算術平均で、ろうそくを4つの可能な色でペイントすることによって行われます。
    • 緑->上昇傾向の価格上昇(購入のエントリポイントを検索)
    • 黒->強気トレンドでの価格修正(購入のためのエントリーポイントの検索)
    • 赤->価格が下落傾向にある(販売用のエントリポイントを検索)
    • 白->下降トレンドでの価格修正(販売のエントリポイントを検索)
  • さらに、次のインジケーターもスクリプトに追加しました。
    • 8期間の指数平均:短期的な価格変動を特定するため
    • 50期間の算術平均:中期的な価格変動を特定する
    • 80期間の指数平均:中期的な価格変動を特定する
    • 200期間の算術平均:長期的な価格変動を特定する

それでも質問がある場合は、ダイレクトメッセージで私に連絡してください:https://www.mql5.com/ja/users/robsjunqueira/


レビュー 20
Tanya Silver
24
Tanya Silver 2024.02.06 21:38 
 

Awesome indicator. Simple, customisable, effective.

mohamad.H Valipour
295
mohamad.H Valipour 2023.12.15 12:34 
 

awesome

eduardonascimentto23
14
eduardonascimentto23 2023.08.30 02:38 
 

Já uso a muito tempo... MARAVILHOSO

おすすめのプロダクト
ピボットポイントフィボRSJは、フィボナッチレートを使用してその日のサポートラインとレジスタンスラインを追跡するインジケーターです。 この壮大な指標は、フィボナッチレートを使用してピボットポイントを通じて最大7レベルのサポートとレジスタンスを作成します。 価格がこのサポートとレジスタンスの各レベルを尊重する方法は素晴らしいです。そこでは、オペレーションの可能な入口/出口ポイントを認識することができます。 特徴 最大7レベルのサポートと7レベルの抵抗 レベルの色を個別に設定します 入力 ピボットタイプ ピボットフィボRSJ1 =フィボ比1の計算 ピボットフィボRSJ2 =フィボ比2の計算 ピボットフィボRSJ3 =フィボ比3の計算 ピボットフィボクラシック=クラシックピボット計算 最小ピボットレベル ピボット3レベル ピボット4レベル ピボット5レベル ピボット6レベル ピボット7レベル それでも質問がある場合は、ダイレクトメッセージで私に連絡してください: https://www.mql5.com/ja/users/robsjunqueira/
FREE
Funciona como bandas de bollinger normais. Criado por Joe Ross, é um setup de maior risco por ser contra-tendência. Pode ser usado para Day Trade, Swing Trade e Position. Para identificar, é necessário inserir no gráfico as Bandas de Bollinger, com uma Média Móvel Simples de 20 períodos e largura (desvio) 2. Verifica-se um fechamento de determinado candle abaixo da banda inferior de Bollinger. Se o próximo candle fechar dentro das Bandas, marca-se a máxima dele. O rompimento dessa máxima será o
FREE
Rejection Zones
Paulo Henrique Faquineli Garcia
Este poderoso indicador analisa o gráfico e mostra zonas de Rejeição de Preços! Isto é, locais onde o preço foi, mas não foi aceito pelo mercado! A visualização desta zona de Rejeição, facilita o entendimento do trader na tomada de decisões de onde operar e como operar! O indicador é composto por 4 linhas, sendo classificadas em 2 grupos: Linhas Vermelha e Amarela: Denotam os extremos onde o preço conseguiu chegar, mas não foi aceito! Linhas Laranja e Azul: A partir delas, denotam o Início da
FREE
Price Momentum
Flavio Javier Jarabeck
4.92 (13)
Value Chart indicator presents the Price evolution in a new form. This indicator, Price Momentum , was developed taking all the calculations presented in the book " Dynamic Trading Indicators " by Mark W. Helweg and David Stendahl (2002). The technique involves de-trended Prices from a user-defined Period of analysis and the addition of a Volatility index correction. The result is an Oscillator with 3 zones: Fair Price Value, Overbought/Oversold and Extremely Overbought/Oversold zones. Adding th
FREE
Donchian Channel is an indicator created by Richard Donchian. It is formed by taking the highest high and the lowest low of the last specified period in candles. The area between high and low is the channel for the chosen period. Its configuration is simple. It is possible to have the average between the upper and lower lines, plus you have alerts when price hits one side. If you have any questions or find any bugs, please contact me. Enjoy!
FREE
The Indicator indicator draws 2 clouds based on Donchian Channels indicator values. The upper cloud is formed by the upper lines values and the lower cloud by the lowers lines values. The indicator allows to change the Channels parameters and the clouds colors the period of the base line and the multiplier of each Donchian Channels instance. The indicator holds 5 buffer index as follow: [0] - Outer values of the upper cloud [1]  - Inner values of the upper cloud [2]  - Base/Center line values [3
FREE
Volume Projection Indicator The Volume Projection Indicator is a specialized tool designed for traders who focus on the relationship between volume and price action. This intuitive indicator projects the expected volume for the ongoing candle, aiding in decision-making during live market conditions. The indicator presents volume data in a histogram format directly on the chart for quick analysis. Features: Bullish Volume Representation : Each green bar in the histogram signifies the volume for a
FREE
Tabajara V5
Flavio Javier Jarabeck
4.87 (38)
Metatrader 5 version of the famous Andre Machado's Tabajara indicator. If you don't know Andre Machado's Technical Analysis work you don't need this indicator... For those who need it and for those several friend traders who asked this porting from other platforms, here it is... FEATURES 8-period Moving Average 20-period Moving Average 50-period Moving Average 200-period Moving Average Colored candles according to the inflexion of the 20-period MA SETTINGS You can change the Period of all M
FREE
Wave Box Market Frenquency
Jean Jacques Huve Ribeiro
4.83 (6)
Totally linked to the result of a movement and the duration he had. Its height records how many ticks the asset walked during a given movement, its width shows us the duration that movement had. Its configuration must be in line with the Weis Wave Indicator configuration to observe the movement force and can indicate a possible accumulation or distribution of the movement;
FREE
MACD Mago Trader
Flavio Javier Jarabeck
4.4 (5)
For those traders and students who follow the famous brazilian trader Igor Rodrigues (Mago Trader) here it is another tool he uses: a 2-line MACD specially set with Phi ratios. This MACD is packed with a twist: a Filling Area , to easily and visually spot the corresponding trend on the chart. Obviously, you can turn On and Off this filling feature. If you don't know Igor Rodrigues and you are a brazilian trader and student, just google for him... Very simple and useful indicator. If you are lo
FREE
MACD Intraday Trendは、1960年代にGeraldAppelによって作成された元のMACDを適応させて開発された指標です。 長年の取引を通じて、MACDのパラメーターをフィボナッチの比率で変更することにより、トレンドの動きの連続性をより適切に表現できることが観察され、価格トレンドの開始と終了をより効率的に検出できるようになりました。 価格トレンドの検出が効率的であるため、トップとボトムの相違を非常に明確に識別し、取引機会をより有効に活用することもできます。 設定可能な機能とアラートを備えたプロフェッショナルバージョンをぜひお試しください: MACD Intraday Trend PRO 特徴 任意の通貨ペアで機能します 任意の時間枠で動作します 練行足チャートで動作します それでも質問がある場合は、直接メッセージで私に連絡してください。 https://www.mql5.com/ja/users/robsjunqueira/
FREE
MIDAS Super VWAP
Flavio Javier Jarabeck
4.29 (14)
Imagine VWAP, MVWAP and MIDAS in one place... Well, you found it! Now you can track the movement of Big Players in various ways, as they in general pursue the benchmarks related to this measuring, gauging if they had good execution or poor execution on their orders. Traders and analysts use the VWAP to eliminate the noise that occurs throughout the day, so they can measure what prices buyers and sellers are really trading. VWAP gives traders insight into how a stock trades for that day and deter
FREE
Indicador Regressão Linear – Par de Ativos Indicador é um oscilador que faz o plot do Resíduo resultado da regressão linear entre os dois ativos inseridos como input do indicador, representado pela fórmula: Y = aX + b + R Onde Y é o valor do ativo dependente, X é o valor do ativo independente, a é a inclinação da reta entre os dois ativos, b é a intersecção da reta e R é o resíduo. O resíduo representa a quantidade da variabilidade que Y que o modelo ajustado não consegue explicar. E os resíduos
FREE
High Low Open Close
Alexandre Borela
4.97 (35)
このプロジェクトが好きなら、5つ星レビューを残してください。 インスタグラムでフォロー:borelatech このインジケータは、指定されたためのオープン、ハイ、ロー、クローズ価格を描画します 特定のタイムゾーンの期間と調整が可能です。 これらは、多くの機関や専門家によって見られた重要なレベルです トレーダーは、彼らがより多くのかもしれない場所を知るために有用であり、 アクティブ。 利用可能な期間は次のとおりです。 前の日。 前週。 前の月。 前の四半期。 前年。 または: 現在の日。 現在の週。 現在の月。 現在の四半期。 現年。
FREE
This is a smooth and responsive accelerometer which reveals the market trend and strength. [ Installation Guide | Update Guide | Troubleshooting | FAQ | All Products ] Two moving averages indicate trend direction The histogram represents strength of the price movement It draws buy and sell zones as colored vertical lines Should be used as a confirmation indicator Customizable line widths and colors It implements alerts of all kinds This indicator is similar to MACD but aims to react faster t
FREE
MACD Colored ZeroLag
Farzin Sadeghi Bonjar
4.14 (7)
It is the MQL5 version of zero lag MACD that was available for MT4 here: https://www.mql5.com/en/code/9993 Also there was a colored version of it here but it had some problems: https://www.mql5.com/en/code/8703 I fixed the MT4 version which has 95 lines of code. It took me 5 days to write the MT5 version.(reading the logs and testing multiple times and finding out the difference of MT5 and MT4!) My first MQL5 version of this indicator had 400 lines of code but I optimized my own code again and n
FREE
Stackable VWAP
Flavio Javier Jarabeck
3.33 (6)
Volume Weighted Average Price (VWAP) is a trading benchmark commonly used by Big Players that gives the average price a Symbol has traded throughout the day. It is based on both Volume and price. Additionally we put in this indicator the MVWAP (Moving Volume Weighted Average Price). For those who do not know the usage and the importance od this indicator I recommend a great article about this subject at Investopedia ( https://www.investopedia.com/articles/trading/11/trading-with-vwap-mvwap.asp
FREE
Donchian Pro
Paulo Henrique Faquineli Garcia
5 (2)
The Donchian Channel Channels are among the most popular tools of technical analysis, as they visually convey to the analyst the limits within which most price movement tends to occur. Channel users know that valuable information can be obtained at any time, whether prices are in the central region of a band or close to one of the border lines. One of the best known techniques to explore these concepts is Bollinger Bands. However, John Bollinger was not the only one to research the applicatio
FREE
Follow The Line MT5
Oliver Gideon Amofa Appiah
4.4 (30)
This indicator obeys the popular maxim that: "THE TREND IS YOUR FRIEND" It paints a GREEN line for BUY and also paints a RED line for SELL. (you can change the colors). It gives alarms and alerts of all kinds. IT DOES NOT REPAINT and can be used for all currency pairs and timeframes. Yes, as easy and simple as that. Even a newbie can use it to make great and reliable trades. NB: For best results, get my other premium indicators for more powerful and reliable signals. Get them here: https://www.m
FREE
The   OHLC indicator   shows the current and historical values of High, Low, Open, Close and Mid for a specific time period. It can plot the current values or the values from the previous session. The indicator's range can be calculated from a daily, weekly, monthly, or user-specified session. Levels High  of the current or previous session. Low  of the current or previous session. Open  of current or previous session. Close  of the current or previous session. Midpoint  of the current or pre
FREE
This is the best Support and Resistance Indicator on the market, and it shows both confirmed Support and Resistance as well as Retests. Support & Resistance: Support marks where buying demand halts price declines, acting as a safety net. Resistance caps price surges, driven by selling pressure. Traders leverage these levels to predict reversals, plan entries, exits, and manage risks, making them trading's fundamental guideposts. You can also find Premium and Discount Levels, Strong High/Low,  
FREE
Cybertrade Keltner Channels - MT5 Created by Chester Keltner, this is a volatility indicator used by technical analysis. It is possible to follow the trend of financial asset prices and generate support and resistance patterns. In addition, envelopes are a way of tracking volatility in order to identify opportunities to buy and sell these assets. It works on periods longer than the period visible on the chart. All values ​​are available in the form of buffers to simplify possible automations.
FREE
Bollinger Bands B
Flavio Javier Jarabeck
5 (3)
John Bollinger created this indicator in 2010 as a way to read the original indicator (Bollinger Bands) in a more "technical" way, shown as an oscillator. The typical range of the Bollinger Bands %B is 0 - 0.5 - 1.0, where "0" represents the lower band, the "0.5" the middle band, and "1" the upper band. The line on the indicator represents the Closing prices. As simple as that. SETTINGS Bollinger Bands period of analysis Standard Deviation multiplier Shift Price type to be analyzed If you
FREE
Supports And Resistances Lines
Francisco Gomes Da Silva
4.76 (38)
サポートゾーンとレジスタンスゾーンのインジケーターMT5 このインジケーターは、トップとボトムを自動的に識別する方法を知っています。 このサポートとレジスタンスインジケーターは、トップとボトムに基づいてサポートラインとレジスタンスラインを作成します。 サポートラインとレジスタンスラインの作り方。 これは、自動サポートラインとレジスタンスラインを作成するためのインジケーターです。 インジケーターを使用してサポートレベルを見つける方法。 このインジケーターはトップとボトムを自動的に検出します。 インジケーターは、「ZigZag」が自動的に底を作成するか、新しい底を前の底より低くするたびにサポートラインを自動的に作成するため、インジケーターは画面に自動サポートラインを自動的に描画します。 レジスタンスラインの作成方法。 インジケーターは、「ZigZag」が新しいトップまたは前のトップよりも高いトップを作成するたびに、サポートレベルを作成するのと同じ方法で抵抗線を自動的に作成します。したがって、インジケーターは新しい抵抗を自動的に作成します。トップレベルとボトムレベルがどこにあるかを心配する必
FREE
SDivergence Indicator calculates and shows regular divergences and hidden divergences for MACD and Stochastic(for now). The benefit of this indicator is multiple input variables. Using these inputs you can modify to get more adaptive RD and HD's to your strategy. Guide : 1- First put your desired oscillator (MACD or Stochastic or Both) on the chart. 2- Run SDivergence indicator and set corresponding sub-window index of previously put oscillator in SDivergence input window. -Note: the chart sub-w
FREE
LT Colored Fibo is a simple indicator that paints the price zones between Fibonacci Retracement levels. Its configuration is extremely simple. It is possible to change the colors of each level of the retracement, choose between background or front of the chart and also work only with the current asset or all open. If you found a bug or have any suggestion for improvement, please contact me. Enjoy! This is a free indicator, but it took hours to develop. If you want to pay me a coffee, I appreci
FREE
What is this indicator? このインジケーターはMT5のFX検証ソフト「 Knots Compositor 」の 全てのチャートモードに対応したMACD です。 どのチャートモードでも、 チャートに表示されているローソク足で計算して表示します 。 Types of the applied price - Close - Open - High - Low - Median Price (HL/2) - Typical Price (HLC/3) - Weighted Price (HLCC/4) KC-Indicators -   KC-MA   (移動平均線) -   KC-ENV   (エンベロープ) -   KC-BB   (ボリンジャーバンド) -   KC-ADX   (Average Directional Movement Index) -   KC-MACD   (Moving Average Convergence/Divergence) -   KC-RSI   (Relative Strength Index) -   KC-S
FREE
Midas VWAP
Paulo Henrique Faquineli Garcia
4 (1)
Volume Weighted Average Price (VWAP) is a trading benchmark commonly used by Big Players that gives the average price a Symbol has traded throughout the day. It is based on both Volume and price. This indicator contains Daily VWAP and MIDAS' VWAP, which means you are able to anchor the beggining of MIDAS' calculations and, therefore you will be able to use this methodology to study price versus volume moves after anchor point. You will be able to anchor up to 3 HIGH MIDAS VWAP's and 3 LOW. Wis
FREE
Rainbow MT5
Jamal El Alama
4.33 (3)
Description : Rainbow MT5 is a technical indicator based on Moving Average with period 34 and very easy to use. When price crosses above MA and MA changes color to green, then this is a signal to buy. When price crosses below MA and MA changes color to red, then this is a signal to sell. The Expert advisor ( Rainbow EA MT5 ) based on Rainbow MT5 indicator is now available here . MT4 version is available here .
FREE
This information indicator will be useful for those who always want to be aware of the current situation on the account. - More useful indicators The indicator displays data such as profit in points, percentage and currency, as well as the spread for the current pair and the time until the bar closes on the current timeframe. There are several options for placing the information line on the chart: - To the right of the price (runs behind the price); - As a comment (in the upper left corner
FREE
このプロダクトを購入した人は以下も購入しています
まず第一に、この取引インジケーターは再描画されず、再描画されず、遅延しないことを強調する価値があります。これにより、手動取引とロボット取引の両方に理想的なものになります。 アトミックアナリストは、価格の強さとモメンタムを利用して市場でより良いエッジを見つけるためのPA価格アクションインジケーターです。ノイズや誤ったシグナルを除去し、取引ポテンシャルを高めるための高度なフィルターを備えています。複雑なインジケーターの複数のレイヤーを使用して、アトミックアナリストはチャートをスキャンし、複雑な数学的計算をシンプルなシグナルと色に変換します。これにより、どのような初心者トレーダーでも理解して使用し、一貫した取引の決定を行うことができます。 「アトミックアナリスト」は、新規および経験豊富なトレーダー向けにカスタマイズされた包括的な取引ソリューションです。プレミアムインジケーターとトップノッチの機能を1つの取引戦略に組み合わせ、すべてのタイプのトレーダーにとって汎用性のある選択肢にします。 デイリートレーディングとスキャルピング戦略:高速で正確なデイトレーディングおよび短期トレード
まず第一に、このトレーディングシステムがノンリペイント、ノンリドロー、ノンラグのインジケーターであることを強調する価値がある。これにより、手動取引とロボット取引の両方に理想的なものになっています。 「スマートトレンドトレーディングシステム MT5」は、新規および経験豊富なトレーダー向けにカスタマイズされた包括的なトレーディングソリューションです。10以上のプレミアムインジケーターを組み合わせ、7つ以上の堅実なトレーディング戦略を備えており、多様な市場状況に対応する多目的な選択肢となっています。 トレンドフォロー戦略:トレンドを効果的に乗り越えるための正確なエントリーとストップロス管理を提供します。 リバーサル戦略:潜在的なトレンドの反転を特定し、トレーダーがレンジ相場を活用できるようにします。 スキャルピング戦略:高速で正確なデイトレードおよび短期取引のために設計されています。 安定性:すべてのインジケーターはノンリペイント、ノンリドロー、ノンラグであり、信頼性の高いシグナルを保証します。 カスタマイズ:個々の取引の嗜好に合わせたカスタム戦略をサポートします。7つ以上の戦略と組み合わせ
ご紹介   クォンタム トレンド スナイパー インジケーターは 、トレンド反転を特定して取引する方法を変革する画期的な MQL5 インジケーターです。 13年以上の取引経験を持つ経験豊富なトレーダーのチームによって開発されました。     クォンタムトレンドスナイパーインジケーター   は、非常に高い精度でトレンドの反転を識別する革新的な方法で、あなたのトレーディングの旅を新たな高みに押し上げるように設計されています。 ***Quantum Trend Sniper Indicatorを購入すると、Quantum Breakout Indicatorを無料で入手できます!*** クォンタム ブレイクアウト インジケーターは、トレンドの反転を特定するとアラートを発し、矢印を示し、3 つのテイクプロフィットレベルを提案します。 初心者トレーダーにもプロのトレーダーにも適しています。 量子EAチャネル:       ここをクリック MT4のバージョン:       ここをクリック 推奨事項: 期間:すべての時間枠。最良の結果を得るには、M
トレンド スクリーナー インジケーターでトレンド取引の力を解き放ちます。ファジー ロジックと複数通貨システムを活用した究極のトレンド取引ソリューションです。 ファジー ロジックを活用した革新的なトレンド インジケーターである Trend Screener を使用して、トレンド取引を向上させます。 これは、13 を超えるプレミアム ツールと機能、および 3 つの取引戦略を組み合わせた強力なトレンド追跡インジケーターであり、Metatrader をトレンド アナライザーにする多用途の選択肢となります。 期間限定オファー : トレンド スクリーナー インジケーターは、わずか 50 ドルで生涯ご利用いただけます。 (元の価格 125$ ) (オファー延長) Trend Screener の 100% 非再描画精度の揺るぎない精度を体験して、取引の決定が過去の価格変動の影響を受けないようにしてください。 マルチタイムフレームおよびマルチ通貨機能の多用途性を解放し、比類のない自信を持って外国為替、商品、暗号通貨、インデックスの世界を取引できるようにします。 Trend Screener の包括的な
Gold Stuff mt5
Vasiliy Strukov
4.88 (162)
Gold Stuff mt5 は、金専用に設計されたトレンド指標であり、あらゆる金融商品にも使用できます。 インジケーターは再描画せず、遅れません。 推奨時間枠 H1. 設定と個人的なボーナスを得るために、購入後すぐに私に連絡してください!   設定 矢印を描く - オンオフ。 チャートに矢印を描く。 アラート - 可聴アラートのオンオフ。 メール通知 - オンオフ。 電子メール通知。 プチ通知 - オンオフ。 プッシュ通知。 次に、色域を調整します。 Gold Stuff mt5 は、金専用に設計されたトレンド指標であり、あらゆる金融商品にも使用できます。 インジケーターは再描画せず、遅れません。 推奨時間枠 H1. 設定と個人的なボーナスを得るために、購入後すぐに私に連絡してください!   設定 矢印を描く - オンオフ。 チャートに矢印を描く。 アラート - 可聴アラートのオンオフ。 メール通知 - オンオフ。 電子メール通知。 プチ通知 - オンオフ。 プッシュ通知。 次に、色域を調整します。
現在33%オフ 初心者にもエキスパートトレーダーにも最適なソリューション このインジケーターは独自の機能と新しい公式を多数内蔵しており、ユニークで高品質かつ手頃な取引ツールです。このアップデートでは、2つの時間枠ゾーンを表示できるようになります。より長いTFだけでなく、チャートTFとより長いTF(ネストゾーンを表示)の両方を表示できます。すべてのSupply Demandトレーダーの皆さんのお気に召すはずです。:) 重要情報の公開 Advanced Supply Demandの可能性を最大化するには、 https://www.mql5.com/ja/blogs/post/720245 にアクセスしてください。   エントリーまたはターゲットの正確なトリガーポイントを正確に特定できれば取引がどのように改善されるか想像してみてください。新しい基盤となるアルゴリズムに基づいて構築されているため、買い手と売り手の間の潜在的な不均衡をさらに簡単に特定できます。これは、最も強い需要と供給のゾーンと、過去のパフォーマンス(古いゾーンを表示)がグラフィカルに表現されるためです。これらの機能は、最適
まず第一に、この取引ツールはノンリペイント、ノンリドロー、ノンラグの指標であり、プロの取引に理想的ですことを強調する価値があります。 スマートプライスアクションコンセプトインジケーターは、新米から経験豊富なトレーダーまで、非常 に強力なツールです。Inner Circle Trader AnalysisやSmart Money Concepts Trading Strategiesなど、20以上の有用な指標を1つに組み合わせています。このインジケーターはスマートマネーコンセプトに焦点を当て、大手機関の取引方法を提供し、彼らの動きを予測するのに役立ちます。 特に、流動性分析に優れており、機関がどのように取引しているかを理解しやすくしています。市場のトレンドを予測し、価格の動きを慎重に分析するのに優れています。機関の戦略とトレードを合わせることで、市場の動向についてより正確な予測ができます。このインジケーターは多目的であり、市場構造を分析し、重要な注文ブロックを特定し、さまざまなパターンを認識するのに優れています。 このインジケーターはBOSやCHoCHなどのパターンの識
今、147ドル(いくつかの更新後に499ドルに増加します) - 無制限のアカウント(PCSまたはMac) RelicusRoad ユーザー マニュアル + トレーニング ビデオ + プライベート Discord グループへのアクセス + VIP ステータス 市場の新しい見方 RelicusRoad は、外国為替、先物、暗号通貨、株式、および指数の世界で最も強力な取引インジケーターであり、トレーダーに収益を維持するために必要なすべての情報とツールを提供します。初心者から上級者まで、すべてのトレーダーが成功するためのテクニカル分析と取引計画を提供します。これは、将来の市場を予測するのに十分な情報を提供する重要な取引指標です。意味をなさないチャート上のいくつかの異なる指標ではなく、完全な解決策を信じています.これは、信号、矢印 + 価格アクション情報を表示するオールインワンのインジケーターで、他に類を見ない非常に正確です。 強力な AI に基づいて、RelicusRoad は不足している情報とツールを提供して、あなたを教育し、トレーディングのプロ、成功したトレーダーにします。
mql5と Telegramの モーニング・ブリーフィングで、詳細とスクリーンショットを含む毎日のマーケット・アップデートをご覧 ください! FX Power MT5 NGは 、長年の人気を誇る通貨強度計FX Powerの次世代モデルです。 この次世代ストレングスメーターは何を提供するのでしょうか?初代FXパワーの魅力すべて プラス GOLD/XAUの強さ分析 より正確な計算結果 個別に設定可能な分析期間 カスタマイズ可能な計算上限値により、さらに優れたパフォーマンスを実現 もっと見たい人のための特別なマルチインスタンス設定 すべてのチャートでお好みの色を無限に設定可能 数え切れないほどの通知オプションにより、重要なことを見逃すことはありません。 Windows 11とmacOSのスタイルで角を丸くした新しいデザイン 魔法のように動くインジケーターパネル FXパワーの主な機能 すべての主要通貨の強さの完全な履歴 すべての時間枠における通貨の強さの履歴 すべてのブローカーとチャートで同一の計算結果 100%信頼できるリアルタイム計算 -> リペイントなし ドロップダウン・リストから
FX Volume MT5
Daniel Stein
4.94 (17)
mql5と Telegramの モーニング・ブリーフィングで、詳細とスクリーンショットを含む毎日のマーケット・アップデートをご覧 ください! FX Volumeは、ブローカーの視点から市場のセンチメントをリアルに洞察する、最初で唯一の出来高インジケーターです。 ブローカーのような機関投資家が外国為替市場でどのようなポジションをとっているか、COTレポートよりもはるかに速く、素晴らしい洞察を提供します。 この情報をチャート上で直接見ることは、あなたの取引にとって真のゲームチェンジャーであり、画期的なソリューションです。 以下のようなユニークなマーケットデータ洞察から利益を得てください。 比率は 、通貨のロングポジションとショートポジションの比率をパーセントで表示します。 比率の変化は 、選択した期間内のロング比率とその変化率を表示します。 Volumes Totalは 、通貨の取引量(ロングとショート)の合計をロット単位で表示します。 Volumes Long :全通貨のロングポジションの取引量を表示します。 Volumes(ショート )は、全通貨のショートポジションの取引量を表示
AW Trend Predictor MT5
AW Trading Software Limited
4.76 (54)
1 つのシステムでのトレンド レベルとブレイクダウン レベルの組み合わせ。高度なインジケーター アルゴリズムは、市場のノイズをフィルター処理し、トレンド、エントリー ポイント、および可能なエグジット レベルを決定します。インジケーターシグナルは統計モジュールに記録されるため、最適なツールを選択してシグナル履歴の有効性を示すことができます。この指標は、テイクプロフィットとストップロスのマークを計算します。 マニュアルと説明書 ->   ここ / MT4 バージョン ->   ここ インジケーターで取引する方法: Trend Predictor での取引は、たった 3 つの簡単なステップです。 ステップ 1 - ポジションを開く 70% 以上の成功率で買いシグナルが受信されました ステップ 2 - ストップロスの決定 逆信号でトランクを選択 ステップ 3 - テイクプロフィット戦略の定義 戦略 1: TP1 に到達したらポジション全体をクローズする 戦略 2: TP1 に達した時点でポジションの 50% をクローズし、TP2 に達した時点で残りの 50% をクローズします。 戦略 3:
これはMT5のインジケーターで、再描画なしで取引に参入するための正確なシグナルを提供します。 外国為替、暗号通貨、金属、株式、インデックスなど、あらゆる金融資産に適用できます。かなり正確な見積もりを提供し、取引を開始して終了するのに最適な時期を教えてくれます。1つのシグナルを処理しただけでインジケーターの元が取れた例の 動画 (6:22)をご覧ください。Entry PointsPro インジケーターの助けを借りたほとんどのトレーダーの最初の1週間の結果が改善しています。 Telegramグループ に登録してください。Entry Points Proインジケーターのメリットは次の通りです。 再描画のないエントリーシグナル 再描画されるインジケーターでは一度表示されたシグナルが削除されて大きな金銭的損失につながることがありますが、これと異なり、表示されて確認されたシグナルは消えることがありません。 エラーなしの取引開始 インジケーターアルゴリズムによって取引を開始する(資産を売買する)理想的な瞬間を見つけることができます。それを使用するすべてのトレーダーの成功率が向上します。
TPSpro TRENDPRO  - is a trend indicator that automatically analyzes the market and provides information about the trend and each of its changes, as well as giving signals for entering trades without redrawing! The indicator uses each candle, analyzing them separately. referring to different impulses - up or down impulse. Exact entry points into transactions for currencies, crypto, metals, stocks, indices!  -  Version MT4                  DETAILED DESCRIPTION        /       TRADING SETUPS       
ご紹介     Quantum Breakout PRO は 、ブレイクアウト ゾーンの取引方法を変革する画期的な MQL5 インジケーターです。 13年以上の取引経験を持つ経験豊富なトレーダーのチームによって開発されました。     クォンタム ブレイクアウト プロ   は、革新的でダイナミックなブレイクアウト ゾーン戦略により、あなたのトレーディングの旅を新たな高みに押し上げるように設計されています。 クォンタム ブレイクアウト インジケーターは、5 つの利益ターゲット ゾーンを備えたブレイクアウト ゾーン上のシグナル矢印と、ブレイクアウト ボックスに基づいたストップロスの提案を提供します。 初心者トレーダーにもプロのトレーダーにも適しています。 量子EAチャネル:       ここをクリック 重要!購入後、インストールマニュアルを受け取るためにプライベートメッセージを送ってください。 推奨事項: 時間枠: M15 通貨ペア: GBPJPY、EURJPY、USDJPY、NZDUSD、XAUUSD アカウントの種類: ECN、Raw、またはス
TrendDecoder Premium MT5
Christophe, Pa Trouillas
5 (1)
レンジと次の動きを特定     |    トレンドの最も早いシグナルと強さを得る     |    反転の前に明確な出口を得る     |    価格がテストするフィボ・レベルを見つける。   |  非リペイント、非遅延インディケータ - マニュアルおよび自動売買に最適 - すべての資産、すべての時間単位に対応 - 発売記念50%割引   - その後 149 ドルに戻る 購入後、 推奨セッティングについては、このチャンネルで私に連絡してください。 MT4 バージョン: ここをクリック BladeSCALPER と PowerZONES を使った完全な方法を入手する どのようなものですか? TrendDECODERは、トレンド監視をシンプルかつ簡単にするための複数のイノベーションを集約したものです。 Projective TrendLine (投影トレンドライン) - 今後のトレンドのスピードリファレンス RealTime TrendLine vs. Projective TrendLine (リアルタイムトレンドライン vs. Projective Tren
Bill Williams Advanced is designed for automatic chart analysis using Bill Williams' "Profitunity" system. The indicator analyzes four timeframes at once. Manual (Be sure to read before purchasing) Advantages 1. Automatically analyzes the chart using the "Profitunity" system of Bill Williams. The found signals are placed in a table in the corner of the screen. 2. Equipped with a trend filter based on the Alligator indicator. Most of the system signals are recommended to be used only accordi
Step into the realm of Forex trading with confidence and precision using XQ, a cutting-edge Forex indicator designed to elevate your trading game to unprecedented heights. Whether you're a seasoned trader or just stepping into the world of currency exchange, XQ Forex Indicator empowers you with the insights and signals needed to make informed trading decisions. The signal conditions are a combination of three indicators, and XQ Forex Indicator only display  medium and long-term trends . The ind
ブレーカートレーダーになり、価格が反転すると市場構造からの利益が変化します。 注文ブロックブレーカーインジケーターは、トレンドまたは価格の動きが枯渇に近づいており、逆転の準備ができていることを識別します。通常、反転または大規模なプルバックが発生しようとしているときに発生する市場構造の変化について警告します。 この指標は、ブレイクアウトと価格の勢いを識別する独自の計算を使用します。使い果たされる可能性のあるポイントの近くで新しい高値が形成されるたびに、インディケーターはその高値の作成を担当する最後の注文ブロックを描きます。次に、移動する価格とともに注文ブロックを追跡します。その後、価格が反対方向にシフトし、その注文ブロックを突破すると、新しい市場構造を作成し、トレンドまたは大きな後退の可能性のある反転の開始を警告します。 注文ブロックは、高値/安値が作成される前の最後の反対色のろうそくであり、価格がこれらの重要な領域を下抜けすると、トレンドの短期的ま​​たは長期的な反転の兆候です。 特徴 重要な枯渇点での市場構造の変化を警告します 価格が使い果たされるレベルに近づくと、
Auto Order Block with break of structure based on ICT and Smart Money Concepts Futures Break of Structure ( BoS )             Order block ( OB )            Higher time frame Order block / Point of Interest ( POI )    shown on current chart           Fair value Gap ( FVG ) / Imbalance   ,  MTF      ( Multi Time Frame )    Volume Imbalance     ,  MTF          vIMB Gap’s Equal High / Low’s     ,  MTF             EQH / EQL Liquidity               Current Day High / Low           HOD /
IX Powerは 、FX Powerの無敵の精度をついにFX以外のシンボルにも提供します。 お気に入りの指数、株式、コモディティ、ETF、さらには暗号通貨の短期、中期、長期のトレンドの強さを正確に判断します。 お使いの端末が提供する すべてを分析する ことができます。ぜひお試しいただき、取引 タイミングが大幅に改善 されることをご体験ください。 IXパワーの主な特徴 100%正確で再描画されない計算結果 - ターミナルで利用可能なすべての取引シンボルに対して 予め設定され、さらに個別に設定可能な強度分析期間のドロップダウン選択 Eメール、メッセージ、モバイル通知による無数の通知オプション EAリクエストのためのアクセス可能なバッファ カスタマイズ可能な計算制限により、さらに優れたパフォーマンスを実現 もっと見たい人のための特別なマルチインスタンス設定 すべてのチャートでお好みの色を無限に設定可能 Windows 11とmacOSのスタイルで角を丸くした新しいパネルデザイン サブ・ウィンドウとメイン・チャートの間をシームレスに移動する、魔法のように動くイン
The Volume by Price Indicator for MetaTrader 5 features Volume Profile and Market Profile TPO (Time Price Opportunity). Get valuable insights out of currencies, equities and commodities data. Gain an edge trading financial markets. Volume and TPO histogram bar and line charts. Volume Footprint charts. TPO letter and block marker charts including split structures. Versatile segmentation and compositing methods. Static, dynamic and flexible ranges with relative and/or absolute visualizations. Lay
TrendLine PRO MT5
Evgenii Aksenov
4.78 (49)
The Trend Line PRO indicator is an independent trading strategy. It shows the trend change, the entry point to the transaction, as well as automatically calculates three levels of Take Profit and Stop Loss protection Trend Line PRO is perfect for all Meta Trader symbols: currencies, metals, cryptocurrencies, stocks and indices Advantages of Trend Line PRO Never redraws its signals The possibility of using it as an independent strategy It has three automatic levels Take Profit and Stop Loss lev
ICT, SMC, SMART MONEY CONCEPTS, SMART MONEY, Smart Money Concept, Support and Resistance, Trend Analysis, Price Action, Market Structure, Order Blocks, BOS/CHoCH,   Breaker Blocks ,  Momentum Shift,   Supply&Demand Zone/Order Blocks , Strong Imbalance,   HH/LL/HL/LH,    Fair Value Gap, FVG,  Premium  &   Discount   Zones, Fibonacci Retracement, OTE, Buy Side Liquidity, Sell Side Liquidity, BSL/SSL Taken, Equal Highs & Lows, MTF Dashboard, Multiple Time Frame, BigBar, HTF OB, HTF Market Structure
Quantum平均足PRO のご紹介 市場のトレンドに対する明確な洞察を提供するように設計された平均足キャンドルは、ノイズを除去し、誤ったシグナルを排除する能力で知られています。混乱を招く価格変動に別れを告げ、よりスムーズで信頼性の高いチャート表現を導入しましょう。 Quantum Heiken Ashi PRO を真にユニークなものにしているのは、従来のローソク足データを読みやすい色のバーに変換する革新的なフォーミュラです。赤と緑のバーはそれぞれ弱気トレンドと強気トレンドをエレガントに強調し、潜在的なエントリーポイントとエグジットポイントを驚くほど正確に見つけることができます。 量子EAチャネル:       ここをクリック MT4のバージョン:       ここをクリック この注目すべき指標には、いくつかの重要な利点があります。 明確性の向上: 価格変動を平滑化することで、平均足バーは市場トレンドをより明確に表現し、有利な取引機会を特定しやすくします。 ノイズの削減: 誤ったシグナルを引き起こすことが多い不安定な価格変動に別れを告げます。 Quantum Heik
Gartley Hunter Multi - An indicator for searching for harmonic patterns simultaneously on dozens of trading instruments and on all classic timeframes: (m1, m5, m15, m30, H1, H4, D1, Wk, Mn). Manual (Be sure to read before purchasing) | Version for MT4 Advantages 1. Patterns: Gartley, Butterfly, Shark, Crab. Bat, Alternate Bat, Deep Crab, Cypher 2. Simultaneous search for patterns on dozens of trading instruments and on all classic timeframes 3. Search for patterns of all possible sizes. Fr
Was: $249  Now: $99   Market Profile defines a number of day types that can help the trader to determine market behaviour. A key feature is the Value Area, representing the range of price action where 70% of trading took place. Understanding the Value Area can give traders valuable insight into market direction and establish the higher odds trade. It is an excellent addition to any system you may be using. Inspired by Jim Dalton’s book “Mind Over Markets”, this indicator is designed to suit the
A key element in trading is zones or levels from which decisions to buy or sell a trading instrument are made. Despite attempts by major players to conceal their presence in the market, they inevitably leave traces. Our task was to learn how to identify these traces and interpret them correctly. Reversal First Impulse levels (RFI)   -  Version MT4                  INSTRUCTIONS                 RUS                 ENG                         R ecommended to use with an indicator   -  TREND PRO  
MT4版  |  FAQ Owl Smart Levels Indicator は、 Bill Williams の高度なフラクタル、市場の正しい波構造を構築する Valable ZigZag、エントリの正確なレベルをマークする Fibonacci レベルなどの一般的な市場分析ツールを含む 1 つのインジケーター内の完全な取引システムです。 利益を得るために市場と場所に。 戦略の詳細な説明 インジケータを操作するための指示 顧問-取引助手 プライベートユーザーチャット ->購入後に私に書いて、私はプライベートチャットにあなたを追加し、あなたはそこにすべてのボーナスをダウンロードすることができます 力はシンプルさにあります! Owl Smart Levels 取引システムは非常に使いやすいので、専門家にも、市場を勉強し始めて自分で取引戦略を選択し始めたばかりの人にも適しています。 戦略と指標に秘密の数式や計算方法が隠されているわけではなく、すべての戦略指標は公開されています。 Owl Smart Levels を使用すると、取引を開始するためのシグナルをすばやく確認し、注文を出すため
**   All Symbols   x   All Time frames   scan just by pressing scanner button ** ***Contact me after the purchase to send you instructions and add you in "Swing scanner group" for sharing or seeing experiences with other users. Introduction: Swing Scanner   is the indicator designed to detect swings in the direction of the trend and possible reversal swings. The indicator studies several price and time vectors to track the aggregate trend direction and detects situations in which the market is o
Dark Power  is an Indicator for intraday trading. This Indicator is based on   Trend Following  strategy, also adopting the use of an histogram to determine the right power . We can enter in good price with this Indicator, in order to follow the   strong trend   on the current instrument. The histogram is calculated based on the size of the bars and two moving averages calculated on the histogram determine the direction of the signal Key benefits Easily visible take profit/stop loss lines Int
作者のその他のプロダクト
キャンドルタイマーカウントダウンは、現在のバーが閉じて新しいバーが形成されるまでの残り時間を表示します。 時間管理に使用できます。 MT4バージョンはこちら ! 機能のハイライト 現地時間ではなくサーバー時間を追跡します 構成可能なテキストの色とフォントサイズ シンボルの日次変動のオプションの視覚化 CPU使用率を削減するために最適化 入力パラメータ 毎日の変化を表示:true / false テキストフォントサイズ テキストの色 それでも質問がある場合は、直接メッセージで私に連絡してください。 https://www.mql5.com/ja/users/robsjunqueira/ これが私たちが継続的に進化することができる唯一の方法であるため、改善のための提案に気軽に連絡してください。
FREE
MACD Intraday Trendは、1960年代にGeraldAppelによって作成された元のMACDを適応させて開発された指標です。 長年の取引を通じて、MACDのパラメーターをフィボナッチの比率で変更することにより、トレンドの動きの連続性をより適切に表現できることが観察され、価格トレンドの開始と終了をより効率的に検出できるようになりました。 価格トレンドの検出が効率的であるため、トップとボトムの相違を非常に明確に識別し、取引機会をより有効に活用することもできます。 設定可能な機能とアラートを備えたプロフェッショナルバージョンをぜひお試しください: MACD Intraday Trend PRO 特徴 任意の通貨ペアで機能します 任意の時間枠で動作します 練行足チャートで動作します それでも質問がある場合は、直接メッセージで私に連絡してください。 https://www.mql5.com/ja/users/robsjunqueira/
FREE
キャンドルタイマーカウントダウンは、現在のバーが閉じて新しいバーが形成されるまでの残り時間を表示します。 時間管理に使用できます。 MT5バージョンはこちら ! 機能のハイライト 現地時間ではなくサーバー時間を追跡します 構成可能なテキストの色とフォントサイズ シンボルの日次変動のオプションの視覚化 CPU使用率を削減するために最適化 入力パラメータ 毎日の変化を表示:true / false テキストフォントサイズ テキストの色 それでも質問がある場合は、直接メッセージで私に連絡してください。 https://www.mql5.com/ja/users/robsjunqueira/ これが私たちが継続的に進化することができる唯一の方法であるため、改善のための提案に気軽に連絡してください。
FREE
キャンドルカウンターは、その日の最初のキャンドルからのキャンドルの数を印刷するインジケーターです。 その日の最初のキャンドルは1番になり、新しいキャンドルはこのカウントで1ずつ増えます。 入力パラメータ 偶数、奇数、またはすべてから選択します ろうそくから数字を印刷するまでの距離 テキストのフォントサイズ テキストフォントの色 それでも質問がある場合は、直接メッセージで私に連絡してください。 https://www.mql5.com/ja/users/robsjunqueira/ ------------- これが私たちが継続的に進化することができる唯一の方法であるため、改善のための提案に気軽に連絡してください。
FREE
ピボットポイントフィボRSJは、フィボナッチレートを使用してその日のサポートラインとレジスタンスラインを追跡するインジケーターです。 この壮大な指標は、フィボナッチレートを使用してピボットポイントを通じて最大7レベルのサポートとレジスタンスを作成します。 価格がこのサポートとレジスタンスの各レベルを尊重する方法は素晴らしいです。そこでは、オペレーションの可能な入口/出口ポイントを認識することができます。 特徴 最大7レベルのサポートと7レベルの抵抗 レベルの色を個別に設定します 入力 ピボットタイプ ピボットフィボRSJ1 =フィボ比1の計算 ピボットフィボRSJ2 =フィボ比2の計算 ピボットフィボRSJ3 =フィボ比3の計算 ピボットフィボクラシック=クラシックピボット計算 最小ピボットレベル ピボット3レベル ピボット4レベル ピボット5レベル ピボット6レベル ピボット7レベル それでも質問がある場合は、ダイレクトメッセージで私に連絡してください: https://www.mql5.com/ja/users/robsjunqueira/
FREE
MACD Intraday Trendは、1960年代にGeraldAppelによって作成された元のMACDを適応させて開発された指標です。 長年の取引を通じて、MACDのパラメーターをフィボナッチの比率で変更することにより、トレンドの動きの連続性をより適切に表現できることが観察され、価格トレンドの開始と終了をより効率的に検出できるようになりました。 価格トレンドの検出が効率的であるため、トップとボトムの相違を非常に明確に識別し、取引機会をより有効に活用することもできます。 設定可能な機能とアラートを備えたプロフェッショナルバージョンをぜひお試しください: MACD Intraday Trend PRO 特徴 任意の通貨ペアで機能します 任意の時間枠で動作します 練行足チャートで動作します それでも質問がある場合は、直接メッセージで私に連絡してください。 https://www.mql5.com/ja/users/robsjunqueira/
FREE
Delta Aggression Volume PRO is an indicator developed to monitor the strength and continuity of the aggression volume of sell and buy negotiations. Note: This indicator DOES NOT WORK for Brokers and/or Markets WITHOUT the type of aggression (BUY or SELL). Cryptocurrencies and Forex do not provide this type of data, that is, it does not work with them. O Delta Agrression Volume PRO has features that allow you to view beyond the delta volume of the day. Operation Multi symbols  (those who pro
ピボットポイントフィボRSJは、フィボナッチレートを使用してその日のサポートラインとレジスタンスラインを追跡するインジケーターです。 この壮大な指標は、フィボナッチレートを使用してピボットポイントを通じて最大7レベルのサポートとレジスタンスを作成します。 価格がこのサポートとレジスタンスの各レベルを尊重する方法は素晴らしいです。そこでは、オペレーションの可能な入口/出口ポイントを認識することができます。 特徴 最大7レベルのサポートと7レベルの抵抗 レベルの色を個別に設定します 入力 ピボットタイプ ピボットフィボRSJ1 =フィボ比1の計算 ピボットフィボRSJ2 =フィボ比2の計算 ピボットフィボRSJ3 =フィボ比3の計算 ピボットフィボクラシック=クラシックピボット計算 最小ピボットレベル ピボット3レベル ピボット4レベル ピボット5レベル ピボット6レベル ピボット7レベル それでも質問がある場合は、ダイレクトメッセージで私に連絡してください: https://www.mql5.com/ja/users/robsjunqueira/
FREE
The Weis Waves RSJ Indicator sums up volumes in each wave. This is how we receive a bar chart of cumulative volumes of alternating waves. Namely the cumulative volume makes the Weis wave charts unique. It allows comparing the relation of the wave sequence characteristics, such as correspondence of the applied force (expressed in the volume) and received result (the price progress). If you still have questions, please contact me by direct message:  https://www.mql5.com/en/users/robsjunqueira/
FREE
Setup Tabajara was created by a Brazilian trader known as  "The OGRO of Wall Street" . The idea of this setup is to indicate to the trader the current trend of prices and  the type of operation should be looked for in the graph. Operation It does this through the relation of the closing price position and the     of 20 periods, by painting the candles in 4 possible colors : Green -> Price rising in upward trend (Search entry points for PURCHASE) Black -> Price correcting in Bullish Trend
FREE
VWAP Fibo Bands RSJ is an indicator that traces the lines of the daily VWAP and from it creates bands using Fibonacci proportions. This spectacular indicator creates 10 band levels through the selected VWAP period using Fibonacci ratios. It is fantastic how the prices respect each level of the bands, where it is possible to realize that almost every time the price closes above / below a level of the bands he will seek the next one. If close above will seek to reach the level above and if close
FREE
MACD Intraday Trend PROは、1960年代にGeraldAppelによって作成された元のMACDを応用して開発されたインジケーターです。 長年の取引を通じて、MACDのパラメーターをフィボナッチの比率で変更することにより、トレンドの動きの連続性をより適切に表現できることが観察され、価格トレンドの開始と終了をより効率的に検出できるようになりました。 価格トレンドの検出が効率的であるため、トップとボトムの相違を非常に明確に識別し、取引機会をより有効に活用することもできます。 特徴 インディケータMACD日中トレンドPROは、任意の通貨ペア、任意の時間枠、および練行足チャートで機能します。 5つのモードを選択することにより、トレンド検出速度を設定することができます。 最速 速い 正常 スロー 最も遅い 資力 6つの構成可能なアラートがあります。 MACDがシグナルラインを引き戻す MACDが信号線を横切る MACDがレベル0を超える 信号線がレベル0を超えています MACDはトレンドカラーを変更します 信号線変更トレンドカラー アラートごとに、以下を
Trend WIN B3は、MT5プラットフォーム用に作成され、ブラジルのB3でMINI FUTURE INDEX(WIN)と連携するように最適化されたプロの取引システムです。. システムは、いくつかの時間枠(1M、5M、15M、30M、H1、H4、D1)でファジー論理を使用して価格トレンドを識別し、行われた計算に従って各時間枠で重みを適用します。 トレンドを特定した後、システムは平均ボラティリティに従ってストップ注文(買いまたは売り)を配置し、ポジションが開かれると、EAは常に利益を最大化することを目指してトレーリングストップを介して取引を行います. 主な特徴 マーチンゲールを使用しません グリッドを使用しません ファジーアルゴリズムによって計算された傾向をグラフに表示します 任意の時間枠で動作します 設定可能な稼働時間 構成可能なオープニングGAPコントロール 構成可能なロット拡張動的モード 4つの構成可能なトレーリングストップレベル 製品マニュアルとビデオを含むブログにアクセスして、詳細と情報を確認してください:  https://www.mql5.com/pt/blo
MACD Intraday Trend PROは、1960年代にGeraldAppelによって作成された元のMACDを応用して開発されたインジケーターです。 長年の取引を通じて、MACDのパラメーターをフィボナッチの比率で変更することにより、トレンドの動きの連続性をより適切に表現できることが観察され、価格トレンドの開始と終了をより効率的に検出できるようになりました。 価格トレンドの検出が効率的であるため、トップとボトムの相違を非常に明確に識別し、取引機会をより有効に活用することもできます。 特徴 インディケータMACD日中トレンドPROは、任意の通貨ペア、任意の時間枠、および練行足チャートで機能します。 5つのモードを選択することにより、トレンド検出速度を設定することができます。 最速 速い 正常 スロー 最も遅い 資力 6つの構成可能なアラートがあります。 MACDがシグナルラインを引き戻す MACDが信号線を横切る MACDがレベル0を超える 信号線がレベル0を超えています MACDはトレンドカラーを変更します 信号線変更トレンドカラー アラートごとに、以下を
This simple indicator paints with a darker color on the volume bar when the quantity traded is above the average of select number of periods of the volume itself, highlighting the moments when there was a large volume of deals above the average. It is also possible to use a configuration of four colors where the color tone shows a candle volume strength. The indicator defaults to the simple average of 20 periods, but it is possible to change to other types of averages and periods. If you like
FREE
Vwap RSJ
JETINVEST
4.93 (14)
VWAP RSJ is an indicator that plots the Hourly, Daily, Weekly and Monthly  VWAP Lines. Large institutional buyers and   mutual funds   use the VWAP ratio to help move into or out of stocks with as small of a market impact as possible. Therefore, when possible, institutions will try to buy below the VWAP, or sell above it. This way their actions push the price back toward the average, instead of away from it. Based on this information I developed this indicator that combines 4 types of VWAP T
FREE
EAは、ボラティリティ、スプレッド、頻度、タイミングを使用して、いつ取引するかを決定します。 EAは指値注文方式を使用してポジションをオープンします。 この場合、Slippageは最大でもエントリの実行に対してポジティブになります。 システムの焦点はあなたの資本を保護しながらお金を稼ぐことであるため、EAはTrailing TakeProfitロジックを使用します。 ほとんどの取引はすぐに終了するので、狙撃兵のヘッドショットのように。 主な特徴 マーチンゲールを使用しません グリッドを使用しません 最適化された通貨ペア:EURUSD | GBPUSD | USDJPY | USDCHF 時間枠:M5 そのことに注意してください:このEAは、ロールオーバーの数分前からロールオーバー後の数分まで、1日あたりの時間の範囲でのみ取引を行います。 1つのチャート設定:すべての最適化されたシンボルを取引するために必要なチャートは1つだけです 複数の通貨ペアのサポート .setファイルは必要ありません。すべての設定はEAに保存されます ブローカーがサフィックス(XXXXXX.aなど)を使用
This indicator sums up the difference between the sells aggression and the buys aggression that occurred in each Candle, graphically plotting the waves of accumulation of the aggression volumes.   Through these waves an exponential average is calculated that indicates the direction of the business flow. Note: This indicator DOES NOT WORK for Brokers and/or Markets WITHOUT the type of aggression (BUY or SELL).   Be sure to try our Professional version with configurable features and alerts:  Agr
FREE
This indicator calculates the difference between the SELL aggression and the BUY aggression that occurred in each Candle, plotting the balance of each one graphically. Note: This indicator DOES NOT WORK for Brokers and/or Markets WITHOUT the type of aggression (BUY or SELL). Be sure to try our   Professional   version with configurable features and alerts:   Delta Agression Volume PRO Settings Aggression by volume (Real Volume) or by number of trades (Tick Volume) Start of the Aggression De
FREE
Funcionamento: O Painel  Netting Panel RSJ  funciona com   qualquer ativo   e em   qualquer tempo gráfico . Ele funciona em contas do tipo " Netting " e " Hedge ", mas gerencia apenas uma posição por ativo, por isso o nome   Netting.   Se ele for executado em contas do tipo " Hedge ", ele fará o gerenciamento e proteção   apenas da posição mais antiga , ou seja, da primeira posição que foi aberta por ele. Em contas " Netting " quando os botões " SELL " ou " BUY " forem pressionados,   ocorrer
FREE
This simple indicator paints with a darker color on the volume bar when the quantity traded is above the average of select number of periods of the volume itself, highlighting the moments when there was a large volume of deals above the average. It is also possible to use a configuration of four colors where the color tone shows a candle volume strength. The indicator defaults to the simple average of 20 periods, but it is possible to change to other types of averages and periods. If you like
FREE
RENKO PRICE ACTION ATRは、レンコチャートの作成を通じて開発された「エキスパートアドバイザー」であり、各BRICKは、ユーザーが選択した期間のATRによって計算されたサイズを持ちます。 レンコチャートは、マイナーな価格変動を除外するように設計されているため、トレーダーは重要なトレンドに集中しやすくなります。 価格動向の検出効率が高いため、支持と抵抗、および上下の相違を明確に識別して、取引機会をより有効に活用することもできます。 手術 RENKO PRICE ACTION ATRは、どの通貨ペアでも機能します。 RENKO PRICE ACTION ATRは、優れたリアルタイム更新パフォーマンスを備えています。 設定 ATR計算時間枠:ATRの平均を適用し、各BRICKのサイズを計算/再計算するためのRENKO PRICE ACTIONATRのユーザー選択期間。 ATR計算平均化期間:各BRICKのサイズ計算を実行するためのRENKO PRICE ACTIONATRのATR平均化のユーザー選択期間。 ATRサイズのパーセンテージ:各BRICKの形成に使用され
インジケータSupplyDemand RSJ PROは、グラフ上に「Supply」ゾーンと「Demand」ゾーンを計算してプロットし、ゾーンのタイプ(弱い、強い、検証済み、証明済み)を識別し、ゾーンの再テストの場合は、その回数を示します。再テストされました。 「供給」ゾーンは、需要よりも供給が多く発生し、価格が下がる価格ゾーンです。 「需要」ゾーンは、供給よりも多くの需要が発生し、価格を押し上げる価格ゾーンです。 構成可能な機能とアラートを備えたプロフェッショナルバージョンをぜひお試しください: Suppy Demand RSJ PRO ゾーンの分類 弱い:再テストされた場合、違反される可能性が高い価格地域。 強い:トレンドの方向を変えており、すぐに再テストされる可能性が低い価格地域。 検証済み:価格が高い地域。最大で1〜3回の再テストがありましたが、価格が地域を破ることはできませんでした。 実証済み:3回以上の再テストがあったが、価格がこの地域を突破できなかった、価格の高い地域。 壊れた/ターンコート:壊れた価格領域。サポートの場合は抵抗になり、抵抗の場合はサポート
Aggression Wave PRO is an indicator developed to monitor the divergence, strength, and continuity of the aggression volume of sell and buy negotiations.  The  Agrression Wave PRO   has features that allow you to view beyond the accumulated delta volume of the day. Note: This indicator DOES NOT WORK for Brokers and/or Markets WITHOUT the type of aggression (BUY or SELL). Cryptocurrencies and Forex do not provide this type of information, that is, it does not work with it. Operation It is pos
インジケータSupplyDemand RSJ PROは、グラフ上に「Supply」ゾーンと「Demand」ゾーンを計算してプロットし、ゾーンのタイプ(弱い、強い、検証済み、証明済み)を識別し、ゾーンの再テストの場合は、その回数を示します。 再テストされました。 「供給」ゾーンは、需要よりも供給が多く発生し、価格が下がる価格ゾーンです。 「需要」ゾーンは、供給よりも多くの需要が発生し、価格を押し上げる価格ゾーンです。 ゾーンの分類 弱い:再テストされた場合、違反される可能性が高い価格地域。 強い:トレンドの方向を変えており、すぐに再テストされる可能性が低い価格地域。 検証済み:価格が高い地域。最大で1〜3回の再テストがありましたが、価格が地域を破ることはできませんでした。 実証済み:3回以上の再テストがあったが、価格がこの地域を突破できなかった、価格の高い地域。 壊れた/ターンコート:壊れた価格領域。サポートの場合は抵抗になり、サポートの場合は抵抗になります。 設定 視覚的な設定: 弱いゾーンを表示:弱いゾーンとして分類されたゾーンが表示されます。 テストされていないゾーンを表示
Trend WDO B3は、MT5プラットフォーム用に作成され、ブラジルのB3でMINI DOLAR INDEX(WDO)と連携するように最適化されたプロの取引システムです。. システムは、いくつかの時間枠(1M、5M、15M、30M、H1、H4、D1)でファジー論理を使用して価格トレンドを識別し、行われた計算に従って各時間枠で重みを適用します。 トレンドを特定した後、システムは平均ボラティリティに従ってストップ注文(買いまたは売り)を配置し、ポジションが開かれると、EAは常に利益を最大化することを目指してトレーリングストップを介して取引を行います. 主な特徴 マーチンゲールを使用しません グリッドを使用しません ファジーアルゴリズムによって計算された傾向をグラフに表示します 任意の時間枠で動作します 設定可能な稼働時間 構成可能なオープニングGAPコントロール 構成可能なロット拡張動的モード 4つの構成可能なトレーリングストップレベル 製品マニュアルとビデオを含むブログにアクセスして、詳細と情報を確認してください:  https://www.mql5.com/pt/blog
EAは、ボラティリティ、スプレッド、頻度、タイミングを使用して、いつ取引するかを決定します。 EAは指値注文方式を使用してポジションをオープンします。 この場合、Slippageは最大でもエントリの実行に対してポジティブになります。 システムの焦点はあなたの資本を保護しながらお金を稼ぐことであるため、EAはTrailing TakeProfitロジックを使用します。 ほとんどの取引はすぐに終了するので、狙撃兵のヘッドショットのように。 主な特徴 マーチンゲールを使用しません グリッドを使用しません 最適化された通貨ペア:EURUSD 時間枠:M5 そのことに注意してください:このEAは、ロールオーバーの数分前からロールオーバー後の数分まで、1日あたりの時間の範囲でのみ取引を行います。 .setファイルは必要ありません。すべての設定はEAに保存されます ブローカーがサフィックス(XXXXXX.aなど)を使用している場合、EAは自動的に識別するため、心配する必要はありません。 インストールする方法 このシステムはスタンドアロンであり、VPSで継続的に実行する必要があります。 低ス
This is an EXPERT with a FOCUS on LEARNING and PROFESSIONAL DEVELOPMENT!!! The idea of this product is to commercialize the source code, allowing those who want to develop their own robots, or start a professional activity developing customized experts, to have a reference source code that helps them in the learning and development process. This source code will be increased, that is, new functionalities will be created, thus allowing the project to continue evolving. For every 10 sales a new v
フィルタ:
Tanya Silver
24
Tanya Silver 2024.02.06 21:38 
 

Awesome indicator. Simple, customisable, effective.

JETINVEST
245099
開発者からの返信 Roberto Sant Ana Junqueira 2024.02.07 12:02
tks
mohamad.H Valipour
295
mohamad.H Valipour 2023.12.15 12:34 
 

awesome

JETINVEST
245099
開発者からの返信 Roberto Sant Ana Junqueira 2023.12.15 13:00
tks
eduardonascimentto23
14
eduardonascimentto23 2023.08.30 02:38 
 

Já uso a muito tempo... MARAVILHOSO

JETINVEST
245099
開発者からの返信 Roberto Sant Ana Junqueira 2023.08.30 11:44
Obrigado pelo review
TonyynoT
29
TonyynoT 2023.04.05 09:06 
 

Ótimo indicador! Só acho que os candles deveriam manter a cor do tipo se desce ficar vermelho... sobe ficar verde, porque confunde um pouco isso, mas é muito bom!

JETINVEST
245099
開発者からの返信 Roberto Sant Ana Junqueira 2023.08.30 11:44
Bom dia Tony, mas o indicador pinta os candles conforme a posição das médias. Da uma lida na descrição que você vai compreender a ideia. Abraço
dallagnol81
17
dallagnol81 2023.02.17 15:04 
 

entrega o que esta descrito valeu

JETINVEST
245099
開発者からの返信 Roberto Sant Ana Junqueira 2023.02.17 15:12
tks
teatime
76
teatime 2023.01.18 02:23 
 

very good indicator !!! tysm for many green pips !!!

JETINVEST
245099
開発者からの返信 Roberto Sant Ana Junqueira 2023.02.17 15:12
tks
KinGor
71
KinGor 2023.01.05 13:46 
 

ユーザーは評価に対して何もコメントを残しませんでした

JETINVEST
245099
開発者からの返信 Roberto Sant Ana Junqueira 2023.02.17 15:12
tks
kravaneda
19
kravaneda 2022.12.20 03:12 
 

ユーザーは評価に対して何もコメントを残しませんでした

JETINVEST
245099
開発者からの返信 Roberto Sant Ana Junqueira 2022.12.20 18:17
obrigado pelo review
goldenjumper
47
goldenjumper 2022.10.17 22:31 
 

Show de bola! Estou tendo bons resultados.

JETINVEST
245099
開発者からの返信 Roberto Sant Ana Junqueira 2022.10.18 11:42
obrigado pelo review
grummel2
14
grummel2 2022.09.19 20:04 
 

prima Indicator. sehr nützlich.

JETINVEST
245099
開発者からの返信 Roberto Sant Ana Junqueira 2022.09.19 20:08
tks
DDDD7777777PPPP
44
DDDD7777777PPPP 2022.05.22 12:43 
 

Muito Bom!

JETINVEST
245099
開発者からの返信 Roberto Sant Ana Junqueira 2022.09.19 20:08
obrigado
y728115
329
y728115 2022.04.30 04:02 
 

Thank you very much. I will utilize it.

JETINVEST
245099
開発者からの返信 Roberto Sant Ana Junqueira 2022.04.30 15:54
tks
sanobalano
99
sanobalano 2022.04.28 10:38 
 

Very good indicator!!!

JETINVEST
245099
開発者からの返信 Roberto Sant Ana Junqueira 2022.04.30 15:53
tks
Johan Taljaard
18
Johan Taljaard 2022.03.27 09:21 
 

Unable to get it working

JETINVEST
245099
開発者からの返信 Roberto Sant Ana Junqueira 2022.03.28 01:18
explain....
dragonmark
175
dragonmark 2022.03.23 11:36 
 

Good indicator!

JETINVEST
245099
開発者からの返信 Roberto Sant Ana Junqueira 2022.03.28 01:18
tks
Silvio Sam
18
Silvio Sam 2022.03.17 03:51 
 

muito bom funciona muito bem, está me ajudando bastante.

JETINVEST
245099
開発者からの返信 Roberto Sant Ana Junqueira 2022.03.17 10:32
Aproveite
AyrtonMB
59
AyrtonMB 2022.03.09 21:57 
 

Muito bom auxiliar

JETINVEST
245099
開発者からの返信 Roberto Sant Ana Junqueira 2022.03.09 21:59
obrigado
ahmadiiiii
198
ahmadiiiii 2022.02.28 07:58 
 

not bad

Jose Manuel Gonzalez Esquivel
57
Jose Manuel Gonzalez Esquivel 2022.02.27 13:56 
 

Excelente indicador, lo uso desde hace tiempo en Tradinview!

JETINVEST
245099
開発者からの返信 Roberto Sant Ana Junqueira 2022.02.27 14:32
Obrigado
gfedrigo
94
gfedrigo 2022.02.23 11:30 
 

Excelente

JETINVEST
245099
開発者からの返信 Roberto Sant Ana Junqueira 2022.02.27 14:31
Obrigado
12
レビューに返信
バージョン 1.20 2021.03.19
Fixed an error in which, depending on the settings, the SMA 20 was not plotted.
バージョン 1.10 2021.03.17
There was an error in the management of the VWAP calculation that sometimes caused it to lose reference.