Gold n XAU MT5
- インディケータ
- Pavel Verveyko
- バージョン: 1.1
- アップデート済み: 25 10月 2021
- アクティベーション: 5
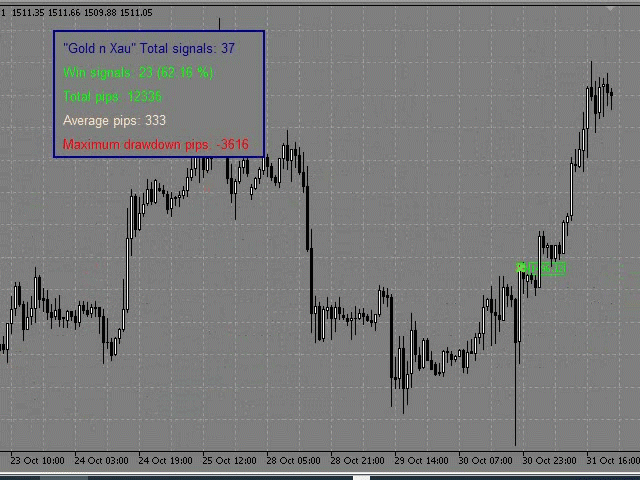
The trading system is designed to work with gold on time periods: 30M, 1H. The indicator allows you to adjust to the market situation.
Parameters for 1H: PERIOD=9F, FILTER=300.
Parameters for 30M: PERIOD=22B, FILTER=450.
A small adjustment to a specific broker is allowed.
If you change the amount of history displayed, you may also need to adjust the parameters.
The indicator is not redrawn.
In "Gold n XAU" there is a system of alerts: a sound signal, a letter to an email, a message to a mobile terminal, a standard alert.
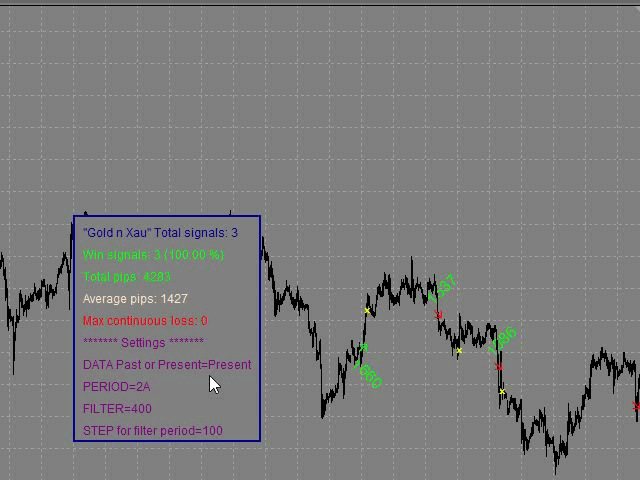
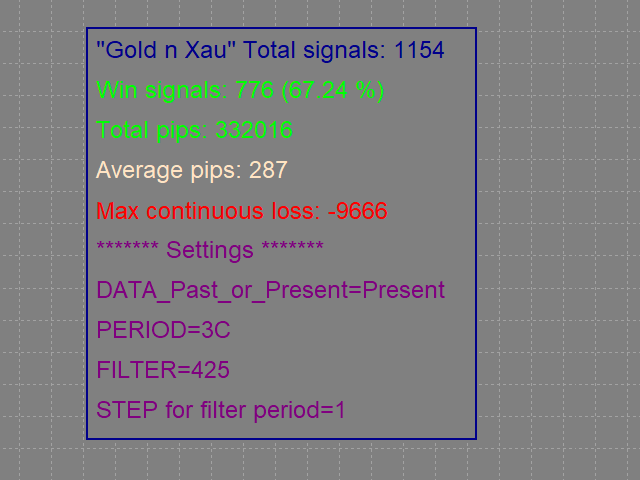
Optimization and selection of parameters works according to the following principle:
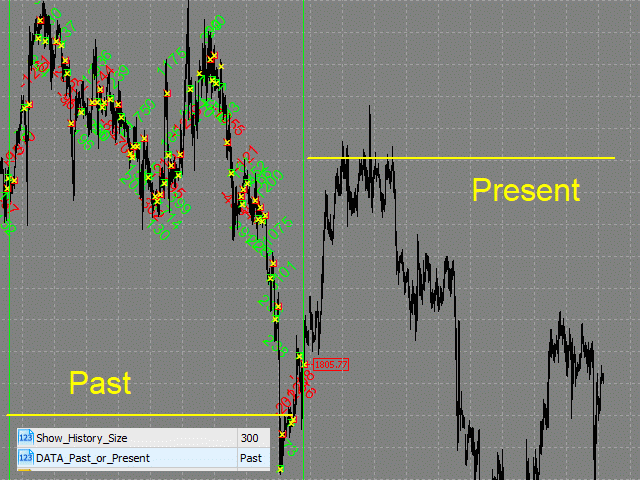
Select the "Past" value in the "DATA_Past_or_Present" setting, so the indicator is based on past data.
When switching the visual setting "PERIOD", the indicator period, signal type, and/or signal combination are changed.
Each time you change the visual settings, the indicator is rebuilt, which makes it possible to instantly evaluate the effectiveness of certain settings.
When the "Present" mode is enabled, the indicator is based on the current data. The estimates of the signals in "Present" and "Past" should be approximately the same.
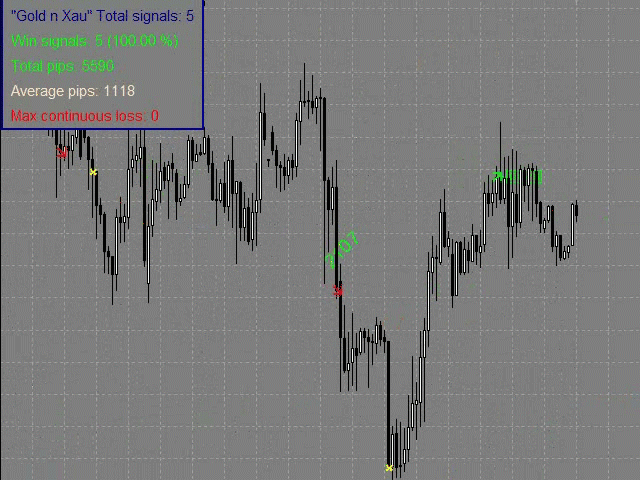
After selecting the appropriate value of the "PERIOD" parameter, you can select the "FILTER" parameter, the desired result of this action, an increase in the value in "Average pips".
For the convenience of switching the "PERIOD" and "FILTER" parameters, you can adjust the step of their change, for this you need to select the appropriate coefficient in the "STEP_for_filter_period" setting.
After adjusting the parameters, you need to return to the "Present" mode.
Also, the procedure for selecting parameters may be different, at your discretion.
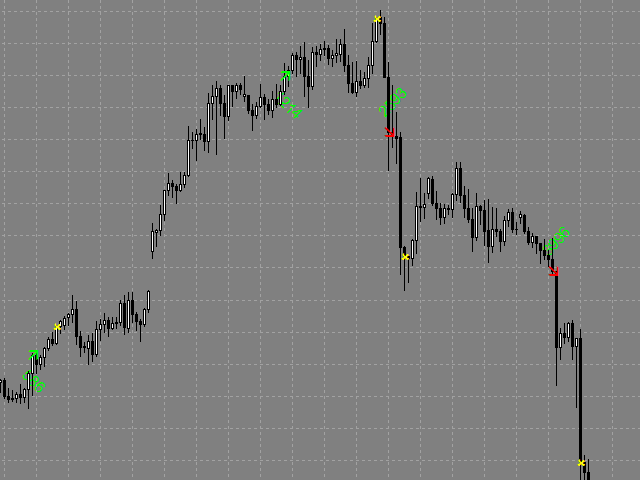
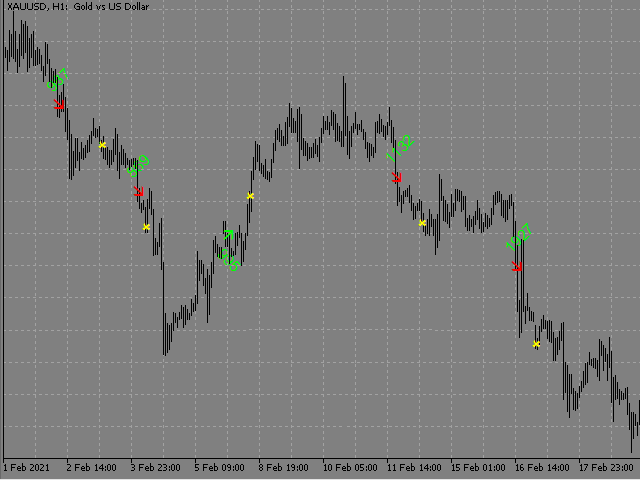
The down arrow is a sell signal, the up arrow is a buy signal, and the cross is a position close.
Analysis of the signal appearance, analysis of the signal result, analysis of the results table is performed after the candle closes.
The indicator keeps statistics of signals.
The size of the results table depends on the font size of the table selected in the settings.
You can drag the results table with the mouse.
Settings
(for convenience, the settings are divided into groups):group Main Settings - main settings:
- Show_History_Size - the size of the displayed history.
- DATA_Past_or_Present - switching indicator data by type: past/present.
- PERIOD - indicator period and signals type.
- FILTER - filter for low-volatility signals.
- STEP_for_filter_period - the step of changing the parameters PERIOD, FILTER.
Other groups of settings affect the appearance of the indicator (in each group of settings, you can change the color, size, type of elements, font, line thickness, and even hide unnecessary groups of elements).
- group of settings "Tags of signals" - settings for signal labels (up(Buy) and down(Sell) arrows.
- group of settings "Price Tags of open signals" - settings for price tags of open (current) signals. (price tags of open signals are necessary for visibility of prices when opening positions).
- group of settings "Result of the signal" - configuring the labels of the result signal (in points) (without taking into account spread, commissions, swap).
- group of settings "Table Results & Settings" - settings for a common table of results for all signals. (excluding spread, Commission, and swap). and visual settings to optimize the parameters.
- group of settings "Notification" - settings for enabling/disabling different types of notifications.