MACD Intraday Trend
MACD Intraday Trendは、1960年代にGeraldAppelによって作成された元のMACDを適応させて開発された指標です。
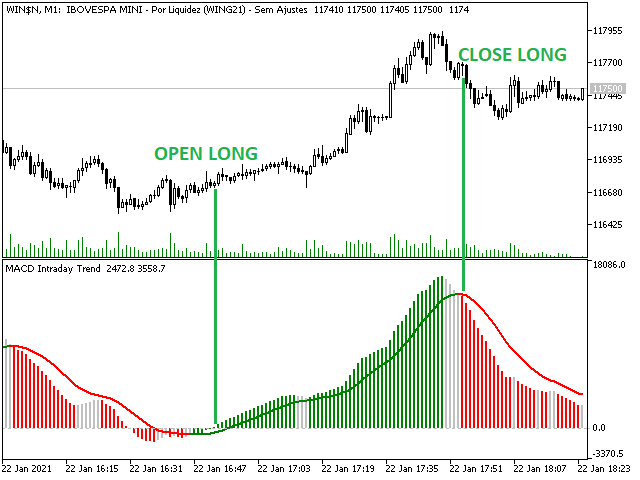
長年の取引を通じて、MACDのパラメーターをフィボナッチの比率で変更することにより、トレンドの動きの連続性をより適切に表現できることが観察され、価格トレンドの開始と終了をより効率的に検出できるようになりました。
価格トレンドの検出が効率的であるため、トップとボトムの相違を非常に明確に識別し、取引機会をより有効に活用することもできます。
設定可能な機能とアラートを備えたプロフェッショナルバージョンをぜひお試しください:MACD Intraday Trend PRO
特徴
- 任意の通貨ペアで機能します
- 任意の時間枠で動作します
- 練行足チャートで動作します


başarılı..