Follow Lines Follow Trend Discoloration lines
- インディケータ
- Kaijun Wang
- バージョン: 1.50
- アップデート済み: 6 10月 2021
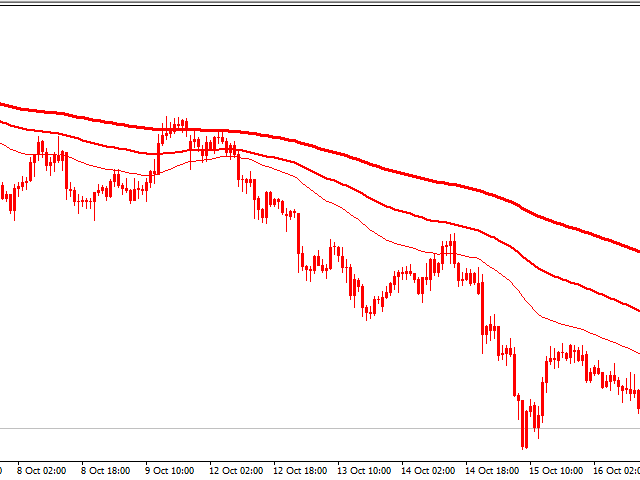
指標はトレンドフォロワー向けです!
3つの移動平均によって構築された取引システム。トレンドに合わせて取引し、利益を上げましょう。
Necessary for traders: tools and indicators
| Waves automatically calculate indicators, channel trend trading | Perfect trend-wave automatic calculation channel calculation , MT4 | Perfect trend-wave automatic calculation channel calculation , MT5 |
| Local Trading copying | Easy And Fast Copy , MT4 | Easy And Fast Copy , MT5 |
| Local Trading copying For DEMO | Easy And Fast Copy , MT4 DEMO | Easy And Fast Copy , MT5 DEMO |
トレンドインジケーター、波動標準の自動計算、MT5バージョンの波動標準の自動計算を強くお勧めします
協力QQ:556024 "
協力wechat:556024 "
協力メール:556024@qq.com」
プロのEAインジケーターの書き込み。
まず第一に、すべての移動平均は遅れている指標であることを理解する必要があります。それらは、貴重な情報を提供し、ポジションを確立するのに役立ちますが、利益を最大化するのに役立つことはできません。 したがって、平均値リターンエリアと組み合わせて使用する必要があります。価格は、遅れることなく、重要なサポートラインの指示に従うことができます。市場が現在のトンネルから始まり、トレンドに従う場合、トランザクションはフォローアップを継続でき、最終的にはより大きな利益を得ることができます。 トレンドでのポジションを固め、トレンドをしっかりと終わらせ、このラウンドの取引を終了し、次のトレンドを開始します。
取引の本質はシンプルで自然に戻ります...


Useful indeed, thanks.