Renko indicator MainChart For MT5
- インディケータ
- Kaijun Wang
- バージョン: 2.99
- アップデート済み: 2 5月 2023
Necessary for traders: tools and indicators
| Waves automatically calculate indicators, channel trend trading | Perfect trend-wave automatic calculation channel calculation , MT4 | Perfect trend-wave automatic calculation channel calculation , MT5 |
| Local Trading copying | Easy And Fast Copy , MT4 | Easy And Fast Copy , MT5 |
| Local Trading copying For DEMO | Easy And Fast Copy , MT4 DEMO | Easy And Fast Copy , MT5 DEMO |
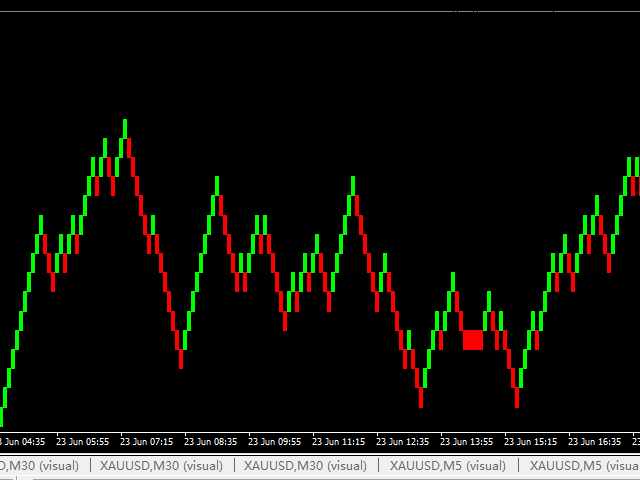
The display of the brick map on the main map.
The Renko chart ideally removes price burrs, so it looks very comfortable. In particular, the establishment of a pattern-based trading system on it looks very ideal.
For example, if we plan to use trend lines, we will often find that some trend line breakthroughs do not make much sense, it is just a shock. Dangling, the trend line broke. The use of brick diagrams can effectively avoid similar embarrassment.


Muito bom gráfico limpo atemporal movido pelo preço