Gold Snake Trends
- インディケータ
- Kaijun Wang
- バージョン: 2.0
- アップデート済み: 14 10月 2020
- アクティベーション: 5
「一緒に成長!」
「協力QQ:556024」
「協力wechat:556024」
「協力メール:556024@qq.com」
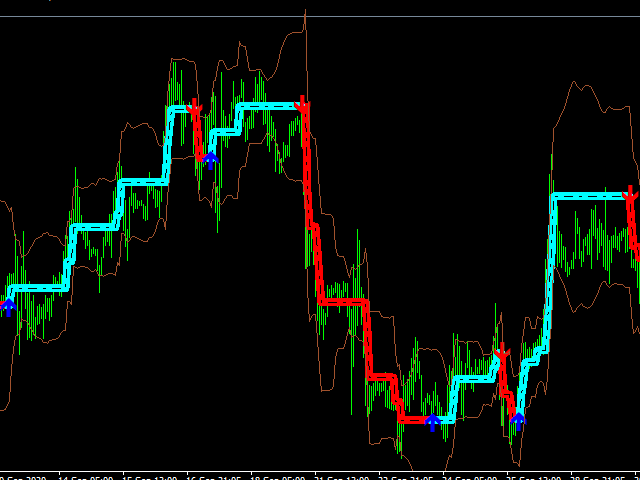
「トレンドは形成されているか死にかけている、そして踊る蛇が旋回するのに続いて、一緒に前進し、決してあきらめない
「はっきりと見える長い判断と短い判断、それに従ってください!」
「ねじれた蛇は、トレンドにつながるはしごであり、一歩一歩、上昇と下降を繰り返します!」
「私たちはトレンドと良い友達であり、ショックは私たちの最高のパートナーでもあります!」
「一緒に成長!」
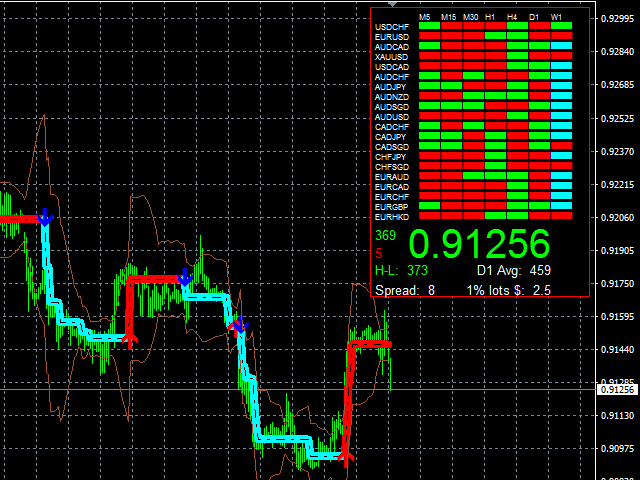
インデックスの内容:
1.ベンチマーク価格、ベンチマーク価格を参照してください。短期的には、価格は継続的かつ無秩序に変動し、短期的な運命は予測できないように見えます。
2.参照トレンド方向
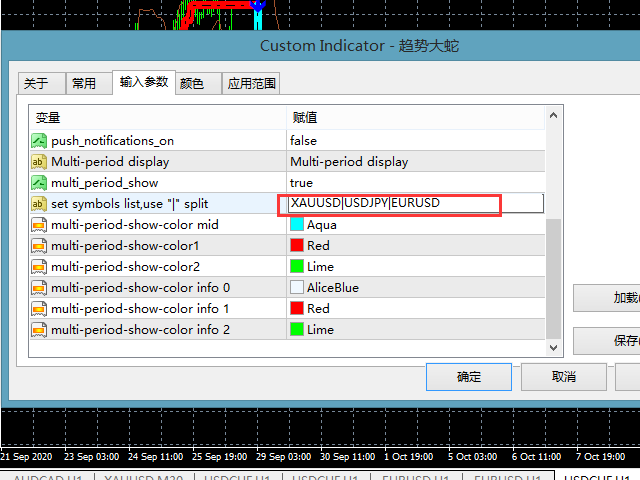
3.複数の種類と複数の期間のトレンド表示
注:最大20種類の制限があります。そうしないと、システムがフリーズします。
提案:
Kラインの短期的な変動を弱め、中長期的な傾向を追う。