GG Time To Trade
- インディケータ
- Pham Quoc Gia
- バージョン: 1.1
- アップデート済み: 7 10月 2020
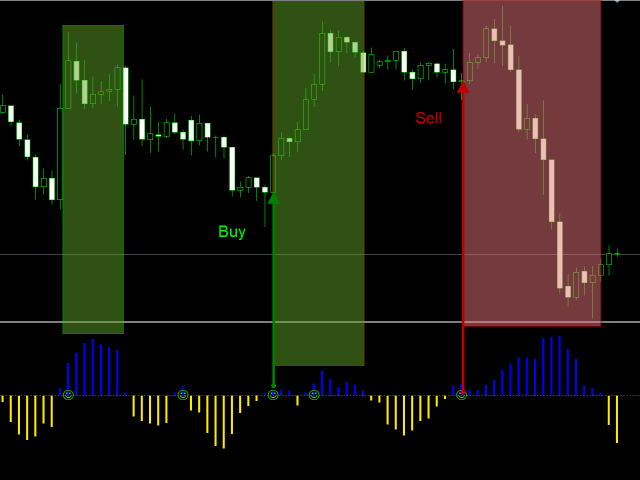
Time to Trade
Trading timing indicator is based on market volatility through 2 ATR indicators to determine the timing of a transaction. The indicator determines the times when the market has strong volatility in trend. When histogram is greater than 0 (blue) is a strong market, when histogram is less than 0 (yellow) is a weak market. Should only trade within histograms greater than 0.
Based on the histogram chart, the first histogram value is greater than 0 and the second histogram appears, this is the definite time to trade. Combine with other indicators to identify buy or sell trades.
Signals are broadcast alerts and sent to the phone
Feedback for improvement is appreciated. If you feel good and effective, please share with your friends and review the product. Thanks for your attention.


Спасибо, очень удобно.