Di Napoli MACD MT5
- インディケータ
- Samil Bozuyuk
- バージョン: 1.1
- アップデート済み: 13 5月 2023
Non-proprietary study of Joe Dinapoli used for trend analysis. The indicator gives trend signals when the fast line penetrates the slow line. These signals remain intact until another penetration occurs. The signal is confirmed at the close of the period. It is applicable for all timeframes.
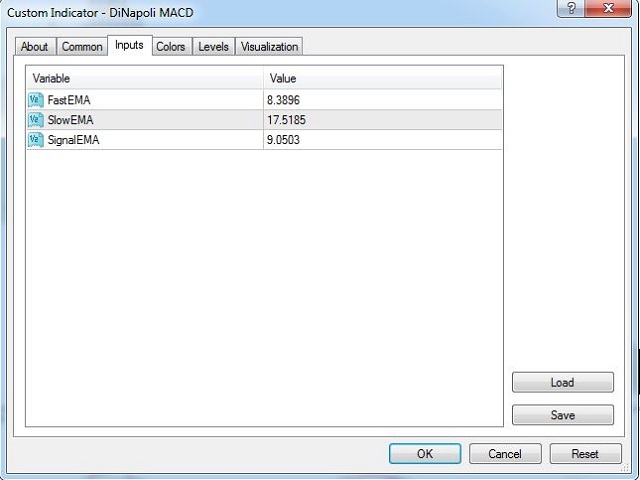
Parameters
- Fast EMA: period of the fast moving average.
- Slow EMA: period of the slow moving average.
- Signal EMA: period of the signal line.
********************************************************************************
If you want to know MACD trend change a head of time with Dinapoli's most popular MACD predictor indicator;
Please visit ► https://www.mql5.com/en/market/product/52623
You no longer need to monitor standart MACD indicator anymore !!!
*********************************************************************************
For Dinapoli MACD Dashboard Scanner;
Please visit ► https://www.mql5.com/en/market/product/52813
*********************************************************************************
For My Other Products;
Please visit ►https://www.mql5.com/en/users/samil34
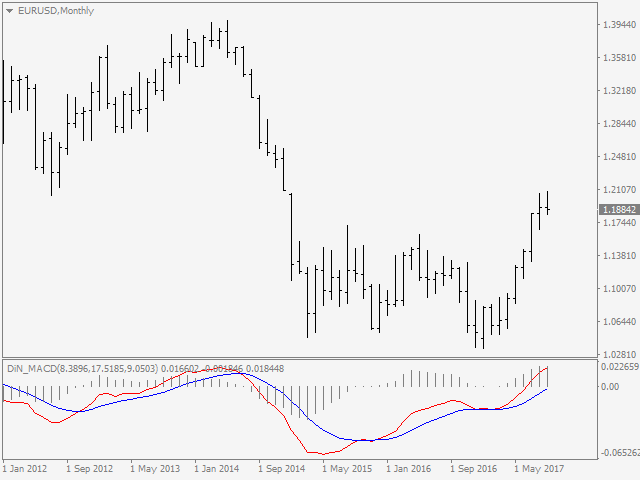
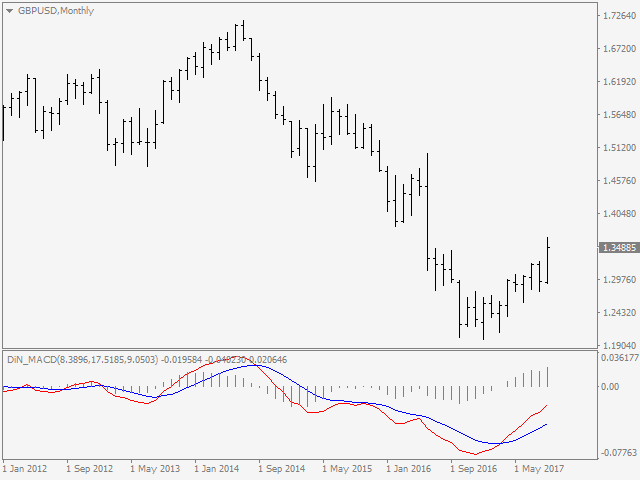


Legit Dinapoli MACD. Comparable with other popular Dinapoli MACD I've seen on TradingView