• 概要
  • レビュー (5)
  • コメント
  • 最新情報

Stop Grabber Scanner MT4


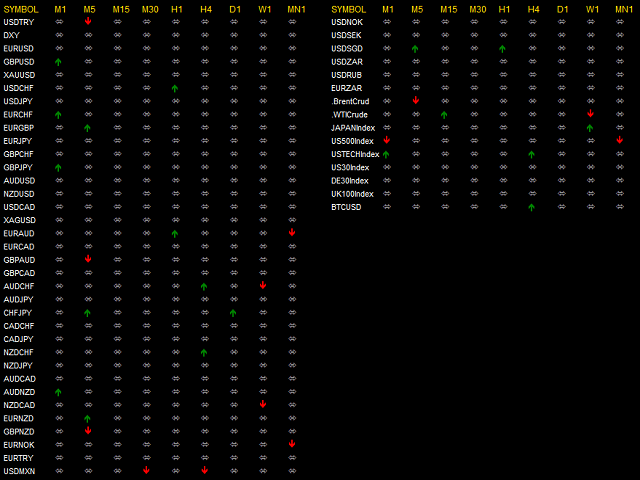
The indicator scans for stop grabber (special pattern of Joe Dinapoli which gives very high probability buy / sell signals and does not repaint ) signals in multiple timeframes for the all markets filtered and shows the results on Dashboard.


Key Features

  • Dashboard can be used for all markets
  • It can scan for stop grabber pattern on MN1, W1, D1, H4, H1, M30, M15 ,M5, M1 timeframes
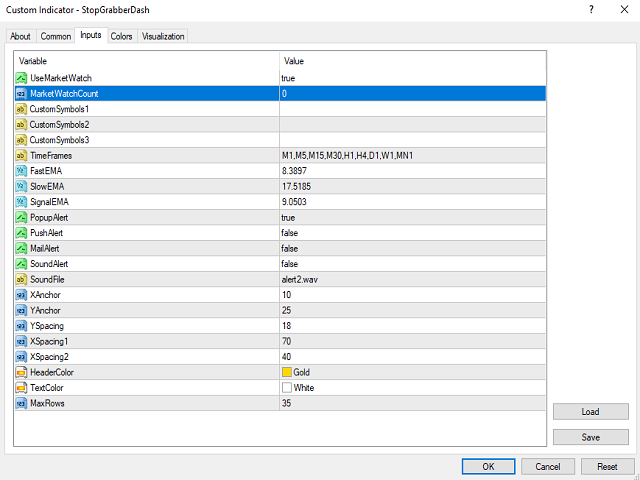
Parameters

  • UseMarketWatch: Set true to copy all symbols available in market watch
  • MarketWatchCount : Set the number of symbols that you want to copy from the market watch list.
  • CustomSymbols: Enter the custom symbols that you want to be available in dashboard.
  • Timeframes: Set the timeframes for dashboard.
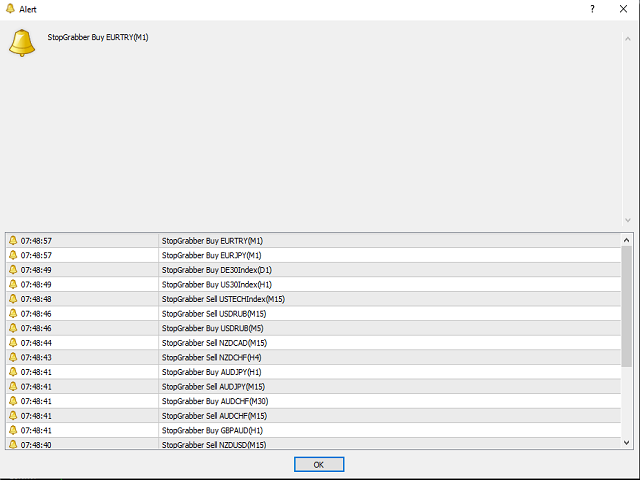
  • Popup Alert: Set True to enable window popup and sound alert on the terminal when a fresh signal is generated. Set False to disable
  • Email Alert: Set True to receive email notifications when a fresh signal is generated. Set False to disable.
  • Push Alert: Set True to receive push notifications on your Apple or Android devices when a fresh signal is generated. Set False to disable


For Stop Grabber Indicator; please visit ►  https://www.mql5.com/en/market/product/52773


おすすめのプロダクト
Limitless MT4は、すべての初心者と経験豊富なトレーダーに適したユニバーサルインジケーターです。 すべての通貨ペア、暗号通貨、生の株式で動作します 無制限のMT4-構成済みで、追加の構成は不要 そして今、主なもの なぜ無制限のMT4なのか? 1再描画の完全な欠如 2トレーディングの最高のスペシャリストによる2年間のテスト 3正しい信号の精度が80%を超える 4ニュースリリース中の取引で好調 取引ルール 1買いシグナル-青い上向き矢印の出現 下向きの赤い矢印の外観を販売するシグナル シグナル後の次のローソク足で取引を開始するには2 3テイクプロフィット チャート上 М1-40ピップ М5-50ピップ М15-55-60ピップ 4ストップロスは利益をとる 5誤った信号をフィルタリングするために、 パラボリックSAR-トレンドとのトレードへの参入を除外する移動平均または同様のトレンドインジケーター。 
タイトル: ノンリペイント XY トレンドインジケーターの紹介: フォレックスとバイナリオプションで成功するための究極のガイド はじめに: ノンリペイント XY トレンドインジケーターは、複雑で常に変化する金融市場において、トレーダーが情報に基づいた意思決定を行うために設計された革新的な取引ツールです。この高度な MetaTrader 4 (MT4) インジケーターは、リペイントという一般的な問題を排除しながら、驚くほどの精度で価格トレンドを予測するそのユニークな能力により、トレーダーの間で大きな人気を集めています。 インジケーターの理解: ノンリペイント XY トレンドインジケーターを際立たせている重要な機能の一つは、その精度へのこだわりです。過去のシグナルをリペイントし、トレーダーに信頼性の低いデータを残してしまう他の多くのインジケーターとは異なり、このインジケーターは一貫性を保っています。トレーダーは、生成されたシグナルが過去の価格変動を正確に反映していることを知って、安心して取引できます。 XY トレンドインジケーターは、高度なアルゴリズムを使用して価格データを分析し、市場のト
Nice Stable Arrow   indicator is designed for signal trading. This indicator generates trend signals. It uses many algorithms and indicators to generate this signal. It tries to generate a signal from the points with the highest trend potential. This indicator is a complete trading product. This indicator does not need any additional indicators. The indicator certainly does not repaint. The point at which the signal is given does not change. Signals are sent at the beginning of new candle
Special Entry Arrow   indicator is designed for signal trading. This indicator generates trend signals. It uses many algorithms and indicators to generate this signal. It tries to generate a signal from the points with the highest trend potential. This indicator is a complete trading product. This indicator does not need any additional indicators. The indicator certainly does not repaint. The point at which the signal is given does not change.     Features and Suggestions Time Frame:
バイナリーハッカーインジケーター 金融市場の高速な世界では、1秒も無駄にできません。すべての意思決定が、取引の成否を分けるのです。そこで登場するのが、バイナリーハッカーインジケーターです。これは、トレーダーに貴重な洞察を提供するために、チャート上の1分ごとに分析を提供する画期的なツールです。 バイナリーハッカーは、手動による広範な分析が必要な従来のインジケーターとは異なり、トレーディングストラテジーから推測作業を取り除き、純粋なデータに基づいた計算されたアプローチを提供します。 取引における精度の向上: バイナリーハッカーインジケーターは、一般的なトレーディングツールではありません。チャート上の各分を分析し、トレーダーに貴重な洞察を提供するリアルタイムアナライザーとして機能します。 バイナリーハッカーを使用すると、売買圧力の微妙なバランスを理解しながら、取引の1分ごとに分析する機能を備えています。この機能により、常に市場の勢いに沿った取引を行うことができます。 1分ごとのパワー: 取引の1分ごとに分析し、売り買い圧力の微妙なバランスを理解する能力を想像してみてください。バイナリーハッカ
The   True Magic Oscillator   indicator is designed for signal trading. This indicator generates trend signals. It uses many algorithms and indicators to generate this signal. It tries to generate signals from the points with the highest trend potential. This indicator is a complete trading product. This indicator does not need any additional indicators. The indicator is never repainted. The point at which the signal is given does not change.         Features and Recommendations Wor
Maximum Directional Index (MDI) is designed for two purposes. 1. To show the direction of the trend (The blue yellow trend line) 2. To show the Overbought (Resistance) and Oversold (Support) zones for a trader to know whether the trend is about to reverse or not. It shows the maximum direction of the price trend. How it works 1. The indicator works on all time-frames but for clarity I recommend you use it on 5minutes, 15miutes, 30minutes, 1 hour and 4 hours time-frame charts. 2. The indicator
MT4インジケーター「イーグルアイ」でバイナリーオプション取引の可能性を引き出す MetaTrader 4(MT4)用の「イーグルアイインジケーター」を使って、バイナリーオプション取引の世界に革命を起こしましょう。この革新的なツールは、レーザーのような精度と比類のない収益性をもたらし、あなたのトレーディング体験を変える準備ができています。 ポテンシャルの境界が崩れ、利益が最大化される世界に飛び込んでください。イーグルアイインジケーターの比類のない精度と揺るぎない信頼性によって、市場の隠された秘密が明らかにされます。細部への緻密な注意を払って設計されたこの先進的なインジケーターは、先進的なアルゴリズム、入念なテクニカル分析、リアルタイムの市場データを組み合わせ、並外れたトレーディングの優位性を提供します。 イーグルアイインジケーターは市場のポイントを的確に把握し、迅速な意思決定をサポートします。直感的なインターフェースと使いやすいデザインにより、初心者のトレーダーでもバイナリーオプションの複雑な世界をスムーズにナビゲートし、その強力な力を最大限に活用することができます。 過去の推測や感情
The King of Forex Trend Cloud Indicator is a trend following indicator based on moving averages. The Indicator is meant to Capture both the beginning and the end of a trend. This indicator can be used to predict both short and long terms market trends.  The king of Forex Trend Cloud if paired together with the King of Forex Trend Indicator can give a broad picture in market analysis and forecasts. I have attached images for both the  The king of Forex Trend Cloud on its own and  The king of Fore
信頼性の低いバイナリオプションのインジケーターにうんざりしていませんか?偽のシグナルを出して損失や失望を招くこともありますよね?それなら、CLOCK INDICATORを探す必要はありません。これはMT4トレーディングプラットフォームで利用できる最高のバイナリオプションのインジケーターです。 高度なアルゴリズムと強力なテクニカル分析ツールを備えたCLOCK INDICATORは、初心者から経験豊富なトレーダーまで、究極のトレーディングツールです。市場のトレンドを正確に予測し、利益を生むトレードの機会を特定し、利益を最大化し、損失を最小限に抑えるのに役立ちます。 他の複雑で使いにくいバイナリオプションのインジケーターとは異なり、CLOCK INDICATORは簡単にインストールしてカスタマイズできます。設定を個別の取引の好みに合わせることができ、すべての主要な通貨ペアと時間枠でシームレスに動作します。 CLOCK INDICATORの特筆すべき特徴の1つは、再描画されない性質です。シグナルが生成されると、チャート上に表示されるため、正確な情報に基づいて的確な取引決定をするこ
Stronger Trend is an indicator that generates trend signal. It generates trend signal with its own algorithm. These arrows give buying and selling signals. The indicator certainly does not repaint. Can be used in all pairs. Sends a signal to the user with the alert feature. Trade rules Enter the signal when the buy and sell signal arrives. Processing should only be initiated when signal warnings are received. It is absolutely necessary to close the operation when an opposite signal is received
This   Rattling Signal Point   indicator is designed for signal trading. This indicator generates trend signals. It uses many algorithms and indicators to generate this signal. It tries to generate signals from the points with the highest trend potential. This indicator is a complete trading product. This indicator does not need any additional indicators. The indicator is never repainted. The point at which the signal is given does not change. When the signal comes the arrows are put back
The indicator is designed for binary options. It produces a sound alert, after which you should instantly enter the market. The indicator operates based on signals form RSI and CCI, as well as support and resistance levels. When the chart is in overbought and oversold zones, the indicator finds a level in this zone and notifies you using a sound and a message. Indicator Parameters dist - the number of points to generate a signal. Suitable values ​​are from 21 to 50. Filtr_SMA - the filter, use
First of all, it is worth highlighting here that this Trading Indicator is Non Repainting, Non Redrawing and Non Lagging, which makes it ideal for manual trading. Never repaint and recalculate Once an arrow appears it never disappears, the signal comes at the opening of the new candle You will now be more profitable with this indicator The indicator will alert you when an arrow appears You can do swing trading or scalping trading The indicator helps you identify the trend Can be optimized acros
Entry Signal Arrows   indicator is designed for signal trading. This indicator generates trend signals.  It uses many algorithms and indicators to generate this signal. It tries to generate a signal from the points with the highest trend potential. This indicator is a complete trading product. This indicator does not need any additional indicators.  The indicator certainly does not repaint. The point at which the signal is given does not change.  Thanks to the alert features you can get the sign
The technical indicator "Reversal patterns" is a mathematical interpretation of the classic reversal patterns: Pin Bar, Harami and Engulfing. That is, the "reversal bar", "Harami" and "Absorption". This indicator allows you to determine the moment of reversal of quotes based on market dynamics and the winner between the "bulls" and "bears". The indicator displays the moment of reversal at the local highs and lows of the chart of any timeframe, which allows you to increase the accuracy of the
**Binary Smart Systemのご紹介:究極のトレードパートナー** Binary Smart Systemは単なるインジケーターではありません。様々な市場で的確なシグナルを提供し、洗練されたアルゴリズムと豊富なテクニカルインジケーターの集合をベースにした、トレーダーを的確さとタイムリーなシグナルで装備するための厳選されたトレードツールです。 **インジケーターコンポーネント:** 1. **移動平均パーセンテージ(MAP):** このコンポーネントは複数の移動平均の加重平均を計算し、トレンドの特定の強力な基盤を形成します。MAPは市場の状況に動的に適応し、現在のトレンド方向に対する洞察を提供します。 2. **商品チャネル指数(CCI):** 平均価格からの偏差を分析することで、CCIは買われすぎと売られすぎの状態を評価します。Binary Smart SystemのCCI統合は、ポテンシャルな反転ポイントを特定する包括的なアプローチを保証します。 3. **移動平均収束拡散法(MACD):** シンプルなクロスオーバーを超えるMACDコンポーネント
This   Real Magic Trend   indicator is designed for signal trading. This indicator generates trend signals. It uses many algorithms and indicators to generate this signal. It tries to generate signals from the points with the highest trend potential. This indicator is a complete trading product. This indicator does not need any additional indicators. The indicator is never repainted. The point at which the signal is given does not change.      Features and Recommendations Time Frame
Fx Perfect Signal indicator is designed for signal trading. This indicator generates trend signals.  It uses many algorithms and indicators to generate this signal. It tries to generate a signal from the points with the highest trend potential. This indicator is a complete trading product. This indicator does not need any additional indicators.  The indicator certainly does not repaint. The point at which the signal is given does not change.  Thanks to the alert features you can get the signals
Super signal series mystery arrows is an indicator designed to generate trading signals. This indicator uses a number of different indicators and generates a signal using a number of historical data. Currency pairs:  Any Time interval:  M5, M15, M30. Suggested M5 Work with at least 20 pairs Parameters AlertsOn -  send alerts. If this feature is activated, it will be activated in other warning properties. AlertsMessage -  send a message AlertsSound -  sound alert setting AlertsEmail -  email al
Binary Lines is a technical analysis indicator for currencies, commodities, cryptocurrencies, stocks, indices and any financial instruments. Can be used for binary options or Forex scalping. Shows entry and exit points at fixed intervals and provides traders the necessary information about the results of possible transactions. Entry points are formed at the very beginning of the candle, in the direction of the MA line, duration trades in bars can be adjusted manually and adjusted to any financi
Dark Sniper arrow indicator. complete lack of redrawing percentage of correct indicator predictions from 80 85% The arrow indicates the direction of the next candle and the possible direction of the trend in the future.  suitable for small m1 timeframes. It is recommended to open deals from 1 to 2 candles. The signal appears on the last candle advantages of the indicator: 1. leading signals. 2.complete lack of redrawing 3. high signal accuracy.
This   Happy Trend Arrow   indicator is designed for signal trading. This indicator generates trend signals. It uses many algorithms and indicators to generate this signal. It tries to generate signals from the points with the highest trend potential. This indicator is a complete trading product. This indicator does not need any additional indicators. The indicator is never repainted. The point at which the signal is given does not change.       Features and Recommendations Time Fra
The BB Reversal Arrows technical trading system has been developed to predict reverse points for making retail decisions. The current market situation is analyzed by the indicator and structured for several criteria: the expectation of reversal moments, potential turning points, purchase and sale signals. The indicator does not contain excess information, has a visual understandable interface, allowing traders to make reasonable decisions. All arrows appear to close the candle, without redr
Non-proprietary study of Joe Dinapoli used for overbought/oversold evaluation.   Uses of Detrended Oscillator indicator Profit taking. Filter for market entry technics. Stop placement. Part of volatility breakout pattern. Determining major trend changes. Part of Dinapoli Stretch pattern.   Inputs lnpPeriod: Perid of moving average Method: Calculation method                           ********************************************************************************* If you want to know market Overb
FREE
The Exact Arrow Entry Signal Indicator is a powerful tool designed to assist traders in making informed decisions in the financial markets. This advanced indicator leverages cutting-edge algorithms and technical analysis to identify potential entry points with high accuracy.  Features: 1. Precision Entry Points: The indicator generates precise arrow signals on the chart, highlighting potential entry points for various trading strategies. 2. Trend Identification: By analyzing price movements
"BUYUK SAVDOGAR" TM has developed this strategy to support anyone who trades binary options. The "monoBAR" trading system is based on mathematical probability and consists of algorithms that can analyze the market situation with high accuracy. This trading system consists of mathematical probability, which helps to determine the most accurate state of the price movement. The strategy algorithm helps to detect small impulse movements in a timely manner. You can simultaneously analyze and r
Smart Reversal Signal  is a professional indicator for the MetaTrader 4 platform; it has been developed by a group of professional traders. This indicator is designed for Forex and binary options trading. By purchasing this indicator, you will receive: Excellent indicator signals. Free product support. Regular updates. Various notification options: alert, push, emails. You can use it on any financial instrument (Forex, CFD, options) and timeframe. Indicator Parameters Perod - indicator calcula
Leo Trend is a signal indicator that shows the market entry points, as well as the trend direction and flat on the chart in the form of arrows and lines. Leo Trend will be useful both for beginners creating a trading strategy, and for professionals to integrate into ready-made trading systems. Leo Trend works without redrawing and without significant delays. The operation of the indicator is demonstrated in the video. In addition, you can test this indicator in the strategy tester free of charge
The newest indicator for binary options. The indicator looks for large market turns and gives out qualitative signals for 2 candles ahead. The indicator also works on Forex, but was developed initially under binary options. After the appearance of the arrow, you receive a notification by e-mail, PUSH notification to the phone or an allert at the terminal. Signals appear at the beginning of the new bar. Timeframe 1 hour. Expiration period 2 candles. More than 75% of signals are closed in p
このプロダクトを購入した人は以下も購入しています
まず第一に、この取引インジケーターは再描画されず、再描画されず、遅延しないことを強調する価値があります。これにより、手動取引とロボット取引の両方に理想的なものになります。 アトミックアナリストは、価格の強さとモメンタムを利用して市場でより良いエッジを見つけるためのPA価格アクションインジケーターです。ノイズや誤ったシグナルを除去し、取引ポテンシャルを高めるための高度なフィルターを備えています。複雑なインジケーターの複数のレイヤーを使用して、アトミックアナリストはチャートをスキャンし、複雑な数学的計算をシンプルなシグナルと色に変換します。これにより、どのような初心者トレーダーでも理解して使用し、一貫した取引の決定を行うことができます。 「アトミックアナリスト」は、新規および経験豊富なトレーダー向けにカスタマイズされた包括的な取引ソリューションです。プレミアムインジケーターとトップノッチの機能を1つの取引戦略に組み合わせ、すべてのタイプのトレーダーにとって汎用性のある選択肢にします。 デイリートレーディングとスキャルピング戦略:高速で正確なデイトレーディングおよび短期トレード
TPSpro TRENDPRO  - is a trend indicator that automatically analyzes the market and provides information about the trend and each of its changes, as well as giving signals for entering trades without redrawing! The indicator uses each candle, analyzing them separately. referring to different impulses - up or down impulse. Exact entry points into transactions for currencies, crypto, metals, stocks, indices!  -  Version MT5               DETAILED DESCRIPTION        /       TRADING SETUPS           
ご紹介   クォンタム トレンド スナイパー インジケーターは 、トレンド反転を特定して取引する方法を変革する画期的な MQL5 インジケーターです。 13年以上の取引経験を持つ経験豊富なトレーダーのチームによって開発されました。     クォンタムトレンドスナイパーインジケーター   は、非常に高い精度でトレンドの反転を識別する革新的な方法で、あなたのトレーディングの旅を新たな高みに押し上げるように設計されています。 ***Quantum Trend Sniper Indicatorを購入すると、Quantum Breakout Indicatorを無料で入手できます!*** クォンタム ブレイクアウト インジケーターは、トレンドの反転を特定するとアラートを発し、矢印を示し、3 つのテイクプロフィットレベルを提案します。 初心者トレーダーにもプロのトレーダーにも適しています。 量子EAチャネル:       ここをクリック MT5のバージョン:       ここをクリック 推奨事項: 期間: すべての時間枠。最良の結果を得るには、
A key element in trading is zones or levels from which decisions to buy or sell a trading instrument are made. Despite attempts by major players to conceal their presence in the market, they inevitably leave traces. Our task was to learn how to identify these traces and interpret them correctly. Reversal First Impulse levels (RFI)   -  Version MT5                INSTRUCTIONS                 RUS                 ENG                                       R ecommended to use with an indicator   -  
現在26%オフ 初心者やエキスパートトレーダーに最適なソリューション! このインジケーターは、独自の機能と新しい計算式を取り入れた、ユニークで高品質、かつ手頃な価格のトレーディングツールです。たった1枚のチャートで28の為替ペアの通貨強度を読み取ることができます。新しいトレンドやスキャルピングチャンスの引き金となるポイントを正確に特定することができるので、あなたのトレードがどのように改善されるか想像してみてください。 ユーザーマニュアルはこちら  https://www.mql5.com/en/blogs/post/697384 これが最初の1本、オリジナルだ! 価値のないクローンを買わないでください。 特別な サブウィンドウの矢印で強い通貨の勢いを表示 GAPがあなたのトレードを導く! 基準通貨や気配値が売られすぎ・買われすぎのゾーン(外相フィボナッチレベル)にあるとき、個別チャートのメインウィンドウに警告表示。 通貨がレンジの外側から反落した場合、プルバック/リバーサルのアラート。 クロスパターンの特別なアラート 複数の時間枠を選択可能で、トレンドを素早く
現在20%OFF! 初心者やエキスパートトレーダーのためのベストソリューション! このダッシュボードソフトウェアは、28の通貨ペアで動作しています。それは私達の主要な指標(高度な通貨の強さ28と高度な通貨インパルス)の2に基づいています。それは全体の外国為替市場の大きい概観を与えます。それは、すべての(9)時間枠で28の外国為替ペアのための高度な通貨の強さの値、通貨の動きの速度と信号を示しています。チャート上で1つのインディケータを使用して市場全体を観察し、トレンドやスキャルピングの機会をピンポイントで見つけることができたら、あなたのトレードがどのように改善されるか想像してみてください。 このインディケータには、強い通貨と弱い通貨の識別、潜在的な取引の識別と確認がより簡単になるような機能が搭載されています。このインディケータは、通貨の強さや弱さが増加しているか減少しているか、また、すべての時間枠でどのように機能しているかをグラフィカルに表示します。 新機能として、現在の市場環境の変化に適応するダイナミックなマーケットフィボナッチレベルが追加され、すでに当社のAdvan
Advanced Supply Demand
Bernhard Schweigert
4.92 (310)
現在33%オフ 初心者にもエキスパートトレーダーにも最適なソリューション このインジケーターは独自の機能と新しい公式を多数内蔵しており、ユニークで高品質かつ手頃な取引ツールです。このアップデートでは、2つの時間枠ゾーンを表示できるようになります。より長いTFだけでなく、チャートTFとより長いTF(ネストゾーンを表示)の両方を表示できます。すべてのSupply Demandトレーダーの皆さんのお気に召すはずです。:) 重要情報の公開 Advanced Supply Demandの可能性を最大化するには、 https://www.mql5.com/ja/blogs/post/720245 にアクセスしてください。   エントリーまたはターゲットの正確なトリガーポイントを正確に特定できれば取引がどのように改善されるか想像してみてください。新しい基盤となるアルゴリズムに基づいて構築されているため、買い手と売り手の間の潜在的な不均衡をさらに簡単に特定できます。これは、最も強い需要と供給のゾーンと、過去のパフォーマンス(古いゾーンを表示)がグラフィカルに表現されるためです。これらの機能は、最適
TrendMaestro
Stefano Frisetti
5 (2)
note: this indicator is for METATRADER4, if you want the version for METATRADER5 this is the link: TRENDMAESTRO recognizes a new TREND in the bud, he never makes mistakes. The certainty of identifying a new TREND is priceless. DESCRIPTION TRENDMAESTRO identifies a new TREND in the bud, this indicator examines the volatility, volumes and momentum to identify the moment in which there is an explosion of one or more of these data and therefore the moment in which prices have strong probability of f
驚異的なFXインジケーター「Miraculous」をご紹介します。完璧な結果を得るための1時間足を含むすべてのタイムフレームで効果的に機能する、最強の強力な特殊MT4フォレックスインジケーターです。 すべてのタイムフレームで優れた結果を提供する最高のFXインジケーターを探し続けるのに疲れましたか?これ以上探す必要はありません!「Miraculous」フォレックスインジケーターをご紹介します。このインジケーターは、トレーディングの経験を変革し、収益を新たなレベルに引き上げるために設計されました。 先進のテクノロジーと長年にわたる緻密な開発に基づいて構築された「Miraculous」フォレックスインジケーターは、FX市場における力と正確さの頂点となります。この素晴らしいツールは、すべてのレベルのトレーダーのニーズを満たすように設計されており、一貫した収益性を追求する上で比類のない優位性を提供します。 「Miraculous」フォレックスインジケーターの他との違いは、その非常に適応性にあります。デイトレーダー、スウィングトレーダーであろうと、長期ポジションを好む方であろうと、このインジケータ
mql5と Telegramの モーニング・ブリーフィングで、詳細とスクリーンショットを含む毎日のマーケット・アップデートをご覧 ください! FX Power MT4 NGは 、長年の人気を誇る通貨強度計FX Powerの次世代モデルです。 この次世代ストレングスメーターは何を提供するのでしょうか?初代FXパワーの魅力すべて プラス GOLD/XAUの強さ分析 より正確な計算結果 個別に設定可能な分析期間 カスタマイズ可能な計算上限値により、さらに優れたパフォーマンスを実現 もっと見たい人のための特別なマルチインスタンス設定 すべてのチャートでお好みの色を無限に設定可能 数え切れないほどの通知オプションにより、重要なことを見逃すことはありません。 Windows 11とmacOSのスタイルで角を丸くした新しいデザイン 魔法のように動くインジケーターパネル FXパワーの主な機能 すべての主要通貨の強さの完全な履歴 すべての時間枠における通貨の強さの履歴 すべてのブローカーとチャートで同一の計算結果 100%信頼できるリアルタイム計算 -> リペイントなし ドロップダウン・リストから
これはMT4のインジケーターで、再描画なしで取引に参入するための正確なシグナルを提供します。 外国為替、暗号通貨、金属、株式、インデックスなど、あらゆる金融資産に適用できます。かなり正確な見積もりを提供し、取引を開始して終了するのに最適な時期を教えてくれます。1つのシグナルを処理しただけでインジケーターの元が取れた例の 動画 (6:22)をご覧ください。Entry PointsPro インジケーターの助けを借りたほとんどのトレーダーの最初の1週間の結果が改善しています。 Telegramグループ に登録してください。Entry Points Proインジケーターのメリットは次の通りです。 再描画のないエントリーシグナル 再描画されるインジケーターでは一度表示されたシグナルが削除されて大きな金銭的損失につながることがありますが、これと異なり、表示されて確認されたシグナルは消えることがありません。 エラーなしの取引開始 インジケーターアルゴリズムによって取引を開始する(資産を売買する)理想的な瞬間を見つけることができます。それを使用するすべてのトレーダーの成功率が向上します。
ご紹介     Quantum Breakout PRO は 、ブレイクアウト ゾーンの取引方法を変革する画期的な MQL5 インジケーターです。 13年以上の取引経験を持つ経験豊富なトレーダーのチームによって開発された Quantum Breakout PROは 、革新的でダイナミックなブレイクアウトゾーン戦略により、あなたの取引の旅を新たな高みに押し上げるように設計されています。 クォンタム ブレイクアウト インジケーターは、5 つの利益ターゲット ゾーンを備えたブレイクアウト ゾーン上のシグナル矢印と、ブレイクアウト ボックスに基づいたストップロスの提案を提供します。 初心者トレーダーにもプロのトレーダーにも適しています。 量子EAチャネル:       ここをクリック MT5バージョン:   ここをクリック 重要!購入後、インストールマニュアルを受け取るためにプライベートメッセージを送ってください。 推奨事項: 時間枠: M15 通貨ペア: GBPJPY、EURJPY、USDJPY、NZDUSD、XAUUSD アカウントの種類: ECN、Raw、また
SALE NOW! Limited Time Offer! An exclusive indicator that utilizes an innovative algorithm to swiftly and accurately determine the market trend. The indicator automatically calculates opening, closing, and profit levels, providing detailed trading statistics. With these features, you can choose the most appropriate trading instrument for the current market conditions. Additionally, you can easily integrate your own arrow indicators into Scalper Inside Pro to quickly evaluate their statistics and
FX Volume
Daniel Stein
4.6 (35)
mql5と Telegramの モーニング・ブリーフィングで、詳細とスクリーンショットを含む毎日のマーケット・アップデートをご覧 ください! FX Volumeは、ブローカーの視点から市場のセンチメントをリアルに洞察する、最初で唯一の出来高インジケーターです。 ブローカーのような機関投資家が外国為替市場でどのようなポジションをとっているか、COTレポートよりもはるかに速く、素晴らしい洞察を提供します。 この情報をチャート上で直接見ることは、あなたの取引にとって真のゲームチェンジャーであり、画期的なソリューションです。 以下のようなユニークなマーケットデータ洞察から利益を得てください。 比率は 、通貨のロングポジションとショートポジションの比率をパーセントで表示します。 比率の変化は 、選択した期間内のロング比率とその変化率を表示します。 Volumes Totalは 、通貨の取引量(ロングとショート)の合計をロット単位で表示します。 Volumes Long :全通貨のロングポジションの取引量を表示します。 Volumes(ショート )は、全通貨のショートポジションの取引量を表示
Cycle Sniper
Elmira Memish
4.41 (34)
NEW YEAR SALE PRICE FOR LIMITED TIME!!! Please contact us after your purchase and we will send you the complimentary indicators to complete the system Cycle Sniper is not a holy grail but when you use it in a system which is explained in the videos, you will feel the difference. If you are not willing to focus on the charts designed with Cycle Sniper and other free tools we provide, we recommend not buying this indicator. We recommend watching the videos about the indiactor and system before pu
このインジケータは、手動および自動的な方法でチャートに描かれたハーモニックパターンを検出します。ユーザーマニュアルは、このリンクから参照できます: あなたのレビューを追加し、入手するために私たちに連絡してください。 この製品をmt4で試すための無料版があります。 GartleyおよびNenstarパターンを検出するために使用できます。 https://www.mql5.com/en/market/product/30181 完全なMT4バージョンを購入するには、次の場所から購入できます。 https://www.mql5.com/en/market/product/15212 注 インジケータにはコントロールパネルがあり、すべての(チャート&時間枠)設定が保存されます。チャート上でスペースをより多く確保するために、最小化することができ、他の分析ツールで作業する場合は、すべてのインジケータデータを非表示にするために閉じるボタンを押すことができます。 このインジケータを使用して設定を変更し、移動平均やボリンジャーバンドなどのインジケータを追加すると、編集のテンプレートが自動的に保存され、必
TakePropips Donchian Trend Pro
Eric John Pajarillaga Aldana
4.82 (17)
TakePropips Donchian Trend Pro   (MT4) は、ドンチャン チャネルを使用してトレンドの方向を自動的に検出し、エントリーとエグジットの取引シグナルを提供する強力で効果的なツールです! この多機能インジケーターには、トレンド スキャナー、取引シグナル、統計パネル、スクリーナー、取引セッション、およびアラート履歴ダッシュボードが含まれます。取引シグナルを提供し、チャートを分析する時間を節約するように設計されています! ユーザー マニュアルとインストール ガイドは、ブログ投稿 (   https://www.mql5.com/en/blogs/post/751368   ) からダウンロードできます。 今日は 50% オフ! 98ドルから49ドルに値下げ! このインジケーターは、ストラテジー テスターでテストできます (ビジュアル モードを有効にします)。ライブ チャートでテストしたい場合は、7 日間の試用版を入手するようにメッセージを送ることもできます。 詳細については、説明の下にあるビデオ チュートリアルも利用できます。 ご不明な点やサポートが必
今、147ドル(いくつかの更新後に499ドルに増加します) - 無制限のアカウント(PCSまたはMac) RelicusRoad ユーザー マニュアル + トレーニング ビデオ + プライベート Discord グループへのアクセス + VIP ステータス 市場の新しい見方 RelicusRoad は、外国為替、先物、暗号通貨、株式、および指数の世界で最も強力な取引インジケーターであり、トレーダーに収益を維持するために必要なすべての情報とツールを提供します。初心者から上級者まで、すべてのトレーダーが成功するためのテクニカル分析と取引計画を提供します。これは、将来の市場を予測するのに十分な情報を提供する重要な取引指標です。意味をなさないチャート上のいくつかの異なる指標ではなく、完全な解決策を信じています.これは、信号、矢印 + 価格アクション情報を表示するオールインワンのインジケーターで、他に類を見ない非常に正確です。 強力な AI に基づいて、RelicusRoad は不足している情報とツールを提供して、あなたを教育し、トレーディングのプロ、成功したトレーダーにします。
Step into the realm of Forex trading with confidence and precision using XQ, a cutting-edge Forex indicator designed to elevate your trading game to unprecedented heights. Whether you're a seasoned trader or just stepping into the world of currency exchange,   XQ Forex Indicator   empowers you with the insights and signals needed to make informed trading decisions. The signal conditions are a combination of three indicators, and XQ Forex Indicator only display  medium and long-term trends . The
ON Trade Waves Patterns Harmonic Elliot Wolfeをご紹介します。これは手動および自動の方法を使用して市場のさまざまなパターンを検出するために設計された高度なインジケーターです。以下はその動作方法です: ハーモニックパターン: このインジケーターは、チャートに表示されるハーモニックパターンを識別できます。これらのパターンは、Scott Carneyの「Harmonic Trading vol 1および2」で説明されているように、ハーモニックトレーディング理論を実践するトレーダーにとって重要です。手動で描画するか、自動検出に頼るかにかかわらず、ON Trade Waves Patternsがお手伝いします。 コントロールパネル: このインジケーターはユーザーフレンドリーなコントロールパネルを備えています。チャートと時間枠の設定を保存し、異なる構成間をスムーズに切り替えることができます。チャートスペースを最大限に活用するために最小化することもできます。他の分析ツールで作業することを好む場合、閉じるボタンをクリックするだけで、すべてのインジケーターデ
Thise indicator is up down v6  comes with tradingwiev version. purchased people, after installed on terminal ,contact me on mql5  to get BONUS  TradingView version. up-down indicator is no repaint and works all pairs and lower than weekly time frames charts. it is suitable also 1 m charts for all pairs. and hold long way to signal. dont gives too many signals. when red histogram cross trigger line that is up signal.and price probably will down when blue histogram cross trigger line that is dow
の紹介     Quantum平均足PRO チャート 市場のトレンドに対する明確な洞察を提供するように設計された平均足キャンドルは、ノイズを除去し、誤ったシグナルを排除する能力で知られています。混乱を招く価格変動に別れを告げ、よりスムーズで信頼性の高いチャート表現を導入しましょう。 Quantum Heiken Ashi PRO を真にユニークなものにしているのは、従来のローソク足データを読みやすい色のバーに変換する革新的なフォーミュラです。赤と緑のバーはそれぞれ弱気トレンドと強気トレンドをエレガントに強調し、潜在的なエントリーポイントとエグジットポイントを驚くほど正確に見つけることができます。 量子EAチャネル:       ここをクリック MT5のバージョン:       ここをクリック この注目すべき指標には、いくつかの重要な利点があります。 明確性の向上: 価格変動を平滑化することで、平均足バーは市場トレンドをより明確に表現し、有利な取引機会を特定しやすくします。 ノイズの削減: 誤ったシグナルを引き起こすことが多い不安定な価格変動に別れを告げます。 Quan
現在20%OFF! 初心者やエキスパートトレーダーに最適なソリューションです。 このインディケータは、エキゾチックペア・コモディティ・インデックス・先物など、あらゆるシンボルの通貨の強さを表示することに特化したインディケータです。金、銀、原油、DAX、US30、MXN、TRY、CNHなどの通貨の強さを表示するために、9行目にどのシンボルでも追加することができます。独自の機能を多数搭載し、新しい計算式を採用したため、ユニークで高品質、かつ手頃な価格のトレーディングツールとなっています。新しいトレンドやスキャルピングチャンスのトリガーポイントを正確に把握することができるため、あなたのトレードがどのように改善されるか想像してみてください。 ユーザーマニュアル:ここをクリック   https://www.mql5.com/en/blogs/post/708876 すべての時間枠に対応します。あなたはすぐにトレンドを見ることができるようになります! 新しいアルゴリズムに基づいて設計されているため、潜在的な取引の特定と確認がより簡単になります。これは、8つの主要通貨と1つのシンボ
まず最初に、このトレーディングシステムがリペイントされず、再描画されず、遅延しないことを強調する価値があります。これにより、プロのトレーディングに最適な状態になります。 「スマートサポートアンドレジスタンストレーディングシステム」は、新規および経験豊富なトレーダー向けにカスタマイズされた高度なインジケーターです。この包括的なシステムは、7以上の戦略、10のインジケーター、およびデイトレード戦略、スイングトレード戦略、サポートおよびレジスタンス戦略、ローソク足パターン戦略、VWAP戦略、マルチタイムフレームトレンド戦略など、さまざまなトレーディングアプローチを組み合わせています。これは、矢印信号、エントリーポイント、出口ポイント、トレードアラート、より高い時間枠のトレンド分析、リアルタイムのトレードモニタリング、そして洞察力のあるトレンドとボリュームキャンドルの着色を提供します。自動的なサポートとレジスタンスの検出により、さまざまな市況下でトレーダーが的確な決定を下すのを支援する多面的なインジケーターとなっています。 スマートサポートアンドレジスタンストレーディングシステムは、
Th3Eng PipFinite PRO Indicator This product is distinct from the Th3Eng PipFinite Original, utilizing a different logic and algorithms. The Th3Eng PipFinite Pro indicator offers analysis of trend directions using custom algorithms. It provides indications of trend direction, entry points, a stop loss point, and three take profit points. The indicator also displays pivot points, dynamic support and resistance channels, and a side-box with detailed current signal information. How to Trade with
This Indicator does not repaint itself at all, it's identifies a new TREND in the bud, this indicator examines the volatility, volumes and momentum to identify the moment in which there is an explosion of one or more of these data and therefore the moment in which prices have strong probability of following a new TREND. CandleBarColorate never misses a beat, he always identifies a new TREND in the bud without error. This indicator facilitates the reading of charts on METATRADER; on a single wi
Ultimate Sniper Dashboard
Hispraise Chinedum Abraham
4.84 (25)
299ドルで割引中! 今後値上げの可能性あり! 下の説明を読んでください! 究極のスナイパーダッシュボードのための最高のエントリーシステム。究極のダイナミックレベル。(私の製品をチェックしてください) 究極のスナイパーダッシュボードはMT4多通貨テスト制限のため、ライブマーケットでのみ作動します。 究極のスナイパーダッシュボードをご紹介します。HA-Sniper、MA-Sniper、その他多くの特別なモードが含まれる最高の製品です。究極のスナイパーダッシュボードは絶対的な獣です! 初心者やエキスパートトレーダーにとって最高のソリューションです。もう二度と動きを見逃さない! シンプルさとピップを愛するトレーダーのために、特別な製品をご用意しました。シンプルでありながら、ダッシュボードは複数のカスタムアルゴリズムに基づき28の通貨ペアを監視し、すべての作業を行います。たった一つのチャートで、プロのように市場を読み解くことができます。もし、為替ペアが動き出したときに、その方向性を正確に特定することができれば、あなたの取引はどれほど改善されることでしょう。   当社のシ
A top and bottom indicator that can intuitively identify the trend of the band. It is the best choice for manual trading, without redrawing or drifting. How to get this indicator for free: Learn more Price increase of $20 every 3 days, price increase process: 79--> 99 --> 119...... Up to a target price of $1000. For any novice and programming trading friend, you can write the signal into the EA to play freely. Array 3 and array 4, for example, 3>4 turns green, 3<4 turns red. If you don't underst
もちろんです。以下は、提供いただいたテキストの日本語への翻訳です: MT4用の天文学指標をご紹介します:究極の天体トレーディングコンパニオン トレーディング体験を天空の高みに高める準備はできていますか?私たちの革命的なMT4用の天文学指標をご紹介します。この革新的なツールは、複雑なアルゴリズムの力を借りて、類まれなる天文学的洞察と精密な計算を提供します。 あなたの指先で宇宙の情報を: 宝のような天文学的データが明らかになる包括的なパネルをご覧ください。惑星の地理的/太陽中心座標、太陽と地球の距離、星の大きさ、伸び、星座、黄道座標および赤道座標、さらには水平座標まで、それぞれが綿密に計算され美しく表示されています。指標によって生成される垂直線は時間値に対応し、トレーディングの旅に宇宙の視点を提供します。 惑星のラインと関係: グラフを飾る惑星のラインの魔法を体験し、スケールと角度をカスタマイズできます。直感的なコントロールパネルを介して各惑星のラインの表示を簡単に切り替えることができます。指定された時刻範囲内での合会、六分会、四分会、三分会、対会、逆行の指標で天体の関係の芸術を発見してく
Was: $249  Now: $99   Market Profile defines a number of day types that can help the trader to determine market behaviour. A key feature is the Value Area, representing the range of price action where 70% of trading took place. Understanding the Value Area can give traders valuable insight into market direction and establish the higher odds trade. It is an excellent addition to any system you may be using. Blahtech Limited presents their Market Profile indicator for the MetaTrader community. Ins
作者のその他のプロダクト
Draws Daily, Weekly and Monthly pivots and the respective supports and resistances levels (S1, S2, S3, R1, R2, R3). Ideal for placing stop losses and/or using as a break-out strategy. Features Unlike other pivot indicators in market you get very clean charts. Pivot levels are plotted irrespective of timeframe, on which you trade, i.e. M1, M5, M15, M30, H1,H4 or Daily timeframes. Pivot levels do not change when you change timeframe. Fully customizable options.    If you are looking at Fibonacci
FREE
Non-proprietary study of Joe Dinapoli used for trend analysis. The indicator gives trend signals when the fast line penetrates the slow line. These signals remain intact until another penetration occurs. The signal is confirmed at the close of the period. It is applicable for all timeframes.   Inputs lnpPeriod: Period of moving average. lnpSmoothK: %K period. lnpSmoothD: %D period.                                    ********************************************************************************
FREE
Non-proprietary study of Joe Dinapoli used for trend analysis. The indicator gives trend signals when the fast line penetrates the slow line. These signals remain intact until another penetration occurs. The signal is confirmed at the close of the period. It is applicable for all timeframes.   Parameters Fast EMA: period of the fast moving average. Slow EMA: period of the slow moving average. Signal EMA: period of the signal line.                              ************************************
FREE
Non-proprietary study of Joe Dinapoli used for overbought/oversold evaluation.   Uses of Detrended Oscillator indicator Profit taking. Filter for market entry technics. Stop placement. Part of volatility breakout pattern. Determining major trend changes. Part of Dinapoli Stretch pattern.   Inputs lnpPeriod: Perid of moving average Method: Calculation method                           ********************************************************************************* If you want to know market Overb
FREE
Non-proprietary study of Joe Dinapoli used for trend analysis. The indicator gives trend signals when the fast line penetrates the slow line. These signals remain intact until another penetration occurs. The signal is confirmed at the close of the period. It is applicable for all timeframes.   Inputs lnpPeriod: Period of moving average. lnpSmoothK: %K period. lnpSmoothD: %D period.                                       *****************************************************************************
FREE
Very special indicator of Joe Dinapoli which is a derivative from traditional MACD indicator. It shows the precise price, at which MACD will show line crossing and trend shifting. Also, this level is known one period ahead of time.You can constantly reassess your current position by looking at this studying a variety of timeframes. When you are in a trade, you have a feel for how much time you have for the trade to go your way by looking at the distance between the MACD Predictor line and the
Very special indicator of Joe Dinapoli which is a derivative  of a Detrended Oscillator. Through a set of parametric equations, a predicting oscillator is created that forecasts, one period ahead of time, overbought and oversold conditions. The resulting predictor values are expressed as bands on the bar chart, both above and below the market. It may be mistaken as a Bollinger Band but has no resemblance to it whatsoever. The Predictor bands may be used in a variety of ways to aid in entering an
All in One package includes the  Oscillator Predictor ,  MACD Predictor ,  Thrust Scanner  and  Advanced Fibonacci  indicators which are mandatory for applying  Dinapoli  trade plans.  Please visit below links for detailed explanations of indicators. Advanced Fibonacci Indicator =>  https://www.mql5.com/en/market/product/52834 Thrust Scanner Indicator => https://www.mql5.com/en/market/product/52830 Overbought /Oversold Predictor indicator => https://www.mql5.com/en/market/product/52621 Macd
The indicator determines a special pattern of Joe Dinapoli. It gives very high probability buy and sell signals. Indicator does not repaint. Indicator Usage Buy Signal ''B'' Entry : Market buy order at signal bar close Stop : Low of signal bar Take Profit : First swing high Sell Signal ''S'' Entry : Market sell order at signal bar close Stop : High of signal bar Take Profit : First swing low Indicator Parameters Fast EMA : External Parameter (should be kept as default) Slow EMA: External Param
The Squat is a function of the range of a given price bar and the volume, or TIC volume, that occurs while that range is being created. The basic idea is that high volume and little price movement indicate substantial support or resistance. The idea behind the approach to this indicator is to first look for likely Fibonacci support and resistance and then see if Squat manifests when that point is reached. The indicator determines one of the high probability patterns of DiNapoli. It does not re
The indicator monitors the MACD trend in multiple timeframes for a specific market. No more shifting in between charts to check the trend direction while trading. Key Features Indicator can be used for all markets Monitors every timeframe, from M1 to MN Able to move display label on chart by single click Indicator Usage The dashboard appears to the left and upper part of the chart when attached. The shell encapsulating a timeframe goes red on a down trend, green on an up trend. If the defaul
The indicator monitors the Dinapoli MACD trend in multiple timeframes for the all markets filtered and shows the results on Dashboard. Key Features Indicator can be used for all markets Monitors every timeframe, from 1 Min to Monthly Parameters UseMarketWatch: Set true to copy all symbols available in market watch MarketWatchCount : Set the number of symbols that you want to copy from the market watch list. CustomSymbols: Enter the custom symbols that you want to be available in dashboard.
The indicator scans for Dinapoli thrust pattern in multiple timeframes for a specific market. Key Features Indicator can be used for all markets It can scan for thrust pattern on W1, D1, H4, H1, M30, M15 and M5 timeframes Ability to choose number of bars required above/below displaced moving average to define thrust Able to move display label on chart by single click Parameters Minimum Bars: Least amount of bars to account for Thrust DMA Period: Moving average period DMA Shift: Number or bars re
The indicator scans for Dinapoli thrust pattern in multiple timeframes for the all markets filtered and shows the results on Dashboard. Key Features Dashboard can be used for all markets It can scan for thrust pattern on MN1, W1, D1, H4, H1, M30, M15 ,M5, M1 timeframes Ability to choose number of bars required above/below displaced moving average to define thrust Parameters UseMarketWatch: Set true to copy all symbols available in market watch MarketWatchCount : Set the number of symbols that
The indicator is the advanced form of the MetaTrader 4 standard Fibonacci tool. It is unique and very reasonable for serious Fibonacci traders. Key Features Drawing of Fibonacci retracement and expansion levels in a few seconds by using hotkeys. Auto adjusting of retracement levels once the market makes new highs/lows. Ability to edit/remove any retracement & expansion levels on chart. Auto snap to exact high and low of bars while plotting on chart. Getting very clear charts even though many ret
TD Combo is better when you have sharp directional moves, because it requires only thirteen price bars from start to finish compared to TD Sequential which needs at least 22 bars. The criteria for a Setup within TD Combo are the same with those required for a Setup within TD Sequential. The difference is that the count starts at bar 1 of the setup and not from bar 9 and TD Combo requires four conditions to be satisfied simultaneously. Requirements for a TD Combo Buy Countdown - Close lower
The indicator scans for TD Combo signals in multiple timeframes for the all markets filtered and shows the results on Dashboard. Key Features Dashboard can be used for all markets It can scan for signals on MN1, W1, D1, H4, H1, M30, M15 ,M5, M1 timeframes Parameters UseMarketWatch: Set true to copy all symbols available in market watch MarketWatchCount : Set the number of symbols that you want to copy from the market watch list. CustomSymbols: Enter the custom symbols that you want to be availa
T D Sequential indicator consist of two components. TD Setup is the first one and it is a prerequisite for the TD Countdown – the second component.   TD Setup TD Setup compares the current close with the corresponding close four bars earlier. There must be nine consecutive closes higher/lower than the close four bars earlier. 1- TD Buy Setup                       - Prerequisite is a bearish price flip, which indicates a switch from positive to negative momentum.                        – Af
The indicator scans for TD Sequential signals in multiple timeframes for the all markets filtered and shows the results on Dashboard. Key Features Dashboard can be used for all markets It can scan for signals on MN1, W1, D1, H4, H1, M30, M15 ,M5, M1 timeframes Parameters UseMarketWatch: Set true to copy all symbols available in market watch MarketWatchCount : Set the number of symbols that you want to copy from the market watch list. CustomSymbols: Enter the custom symbols that you want to be a
The indicator is the advanced form of the MetaTrader 4 standard Fibonacci tool. It is unique and very reasonable for serious Fibonacci traders. Key Features Drawing of Fibonacci retracement and expansion levels in a few seconds by using hotkeys. Auto adjusting of retracement levels once the market makes new highs/lows. Ability to edit/remove any retracement & expansion levels on chart. Auto snap to exact high and low of bars while plotting on chart. Getting very clear charts even though man
Very special indicator of Joe Dinapoli which is a derivative from traditional MACD indicator. It shows the precise price, at which MACD will show line crossing and trend shifting. Also, this level is known one period ahead of time.You can constantly reassess your current position by looking at this studying a variety of timeframes. When you are in a trade, you have a feel for how much time you have for the trade to go your way by looking at the distance between the MACD Predictor line and the
Very special indicator of Joe Dinapoli which is a derivative  of a Detrended Oscillator. Through a set of parametric equations, a predicting oscillator is created that forecasts, one period ahead of time, overbought and oversold conditions. The resulting predictor values are expressed as bands on the bar chart, both above and below the market. It may be mistaken as a Bollinger Band but has no resemblance to it whatsoever. The Predictor bands may be used in a variety of ways to aid in entering an
All in One package includes the  Oscillator Predictor ,  MACD Predictor ,  Thrust Scanner  and  Advanced Fibonacci  indicators which are mandatory for applying  Dinapoli  trade plans.  Please visit below links for detailed explanations of indicators. Advanced Fibonacci Indicator =>  https://www.mql5.com/en/market/product/107933 Thrust Scanner Indicator =>  https://www.mql5.com/en/market/product/52829 Overbought /Oversold Predictor indicator => https://www.mql5.com/en/market/product/52628 Macd
The indicator determines a special pattern of Joe Dinapoli. It gives very high probability buy and sell signals. Indicator does not repaint. Indicator Usage Buy Signal ''B'' Entry : Market buy order at signal bar close Stop : Low of signal bar Take Profit : First swing high Sell Signal ''S'' Entry : Market sell order at signal bar close Stop : High of signal bar Take Profit : First swing low Indicator Parameters Fast EMA : External Parameter (should be kept as default) Slow EMA: External Param
The Squat is a function of the range of a given price bar and the volume, or TIC volume, that occurs while that range is being created. The basic idea is that high volume and little price movement indicate substantial support or resistance. The idea behind the approach to this indicator is to first look for likely Fibonacci support and resistance and then see if Squat manifests when that point is reached. The indicator determines one of the high probability patterns of DiNapoli. It does not re
The indicator monitors the Dinapoli MACD trend in multiple timeframes for the all markets filtered and shows the results on Dashboard. Key Features Indicator can be used for all markets Monitors every timeframe, from 1 Min to Monthly Parameters UseMarketWatch: Set true to copy all symbols available in market watch MarketWatchCount : Set the number of symbols that you want to copy from the market watch list. CustomSymbols: Enter the custom symbols that you want to be available in dashboard.
The indicator scans for Dinapoli thrust pattern in multiple timeframes for a specific market. Key Features Indicator can be used for all markets It can scan for thrust pattern on W1, D1, H4, H1, M30, M15 and M5 timeframes Ability to choose number of bars required above/below displaced moving average to define thrust Able to move display label on chart by single click Parameters Minimum Bars: Least amount of bars to account for Thrust DMA Period: Moving average period DMA Shift: Number or bars re
The indicator scans for Dinapoli thrust pattern in multiple timeframes for the all markets filtered and shows the results on Dashboard. Key Features Dashboard can be used for all markets It can scan for thrust pattern on MN1, W1, D1, H4, H1, M30, M15 ,M5, M1 timeframes Ability to choose number of bars required above/below displaced moving average to define thrust Parameters UseMarketWatch: Set true to copy all symbols available in market watch MarketWatchCount : Set the number of symbols that
フィルタ:
Bambina
324
Bambina 2020.09.20 09:19 
 

ユーザーは評価に対して何もコメントを残しませんでした

Xmichelx
324
Xmichelx 2020.09.20 07:56 
 

ユーザーは評価に対して何もコメントを残しませんでした

Goprox
344
Goprox 2020.09.19 19:23 
 

ユーザーは評価に対して何もコメントを残しませんでした

TrevorZLM01
344
TrevorZLM01 2020.09.19 16:54 
 

ユーザーは評価に対して何もコメントを残しませんでした

fxtrader102
334
fxtrader102 2020.09.19 13:26 
 

ユーザーは評価に対して何もコメントを残しませんでした

レビューに返信
バージョン 1.1 2020.09.19
Version chnage only