バージョン 9.46
2024.01.28
bro & brd という名前のオブジェクトに傾向線の太さと色に関するオプション (入力パラメータ) を追加しました。
バージョン 9.45
2023.02.19
精度とパフォーマンスの向上。
バージョン 9.45 にアップグレードすることをお勧めします。
敬具。
バージョン 9.43
2022.12.24
AUDUSD/NZDUSD 機能のアップデートを修正
- バージョン 9.41 でタイプミスを見つけました
* 重要度: 高。
ノート。
A2SR は、長期的にトレード シグナルで実証されています。
-- Artificial Intelligence Invincible EA --
バージョン 9.41
2022.12.17
AUDUSD と NZDUSD の特別な取引機会を得るための特定の機能 (純正) を追加しました。
- - -
デフォルトのオプション:
AUDUSD = true
NZDUSD = true。
- - -
バージョン 9.41 で追加された新機能を含め、A2SR パッケージもシグナルでデモされています。
「Artificial Intelligence Invincible EA」。
* この取引システムは、EA が A2SR パッケージに存在するすべての最高の取引管理を取得するまで開発され続けます。
バージョン 9.36
2022.12.04
Added new features to MCS :
1. Short-term (conditions during economic news events)
2. Session
3. Today
バージョン 9.35
2022.09.14
Update for developers using A2SR as a data source.
Developers can confirm the existence of A2SR whether it has been installed on the chart or not.
バージョン 9.34
2022.05.11
1.アプリケーションのベースとしてA2SRを使用する開発者向けのアップデート。
2.オブジェクトの削除に関するマイナーな修正。
バージョン 9.33
2021.11.20
パフォーマンスに関する重要な更新。
バージョン 9.31
2021.03.16
私の大切なお客様からのリクエスト。
追加されたオプション:
-ユーザーは、S/Rトレンドラインと水平ラインの一方または両方を選択できます。
バージョン 9.30
2021.02.07
新機能を追加しました。
(私の大切なお客様からのリクエスト)
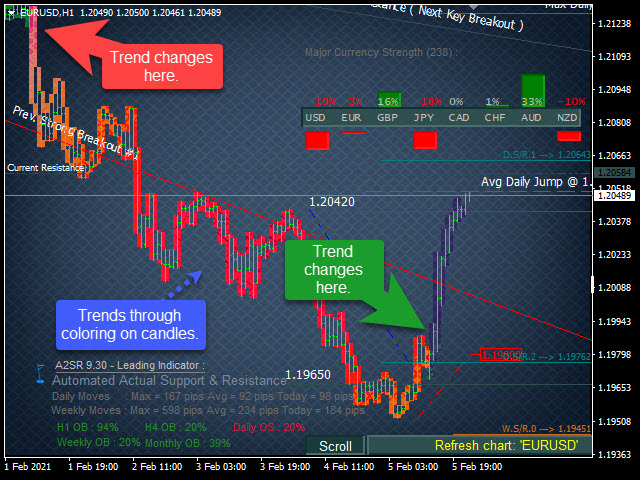
トレンド#2を表示する:
-キャンドルのカラーリングによるトレンド。
-短期。 それはあなたの時間枠に依存します。
バージョン 9.21
2020.10.04
私の大切なお客様からのリクエスト:
線の太さに関する機能を追加しました。
バージョン 9.20
2020.09.09
テキストラベルを表示するオプションを追加しました。
-私の大切なお客様からのリクエスト。
---------------------------
テキストラベルを持つオブジェクトには、ラベルを表示するかどうかのオプションが追加されました。
また、A2SRのタイトルには無効にするオプションがあります。
-デフォルトは「true」です
軽微な修正
1.早休みのオプション「ray」。
2.チャートにインジケーターを配置するときに、記号を読んでコメントします。
バージョン 9.19
2020.08.31
1. Expert A2SR Readerをサポートするためのマイナーな修正。
2.進行状況をパーセンテージで表示します(グラフデータを更新する場合)。
ありがとうございました。
バージョン 9.18
2020.08.16
Expert A2SR Readerをサポートするためのマイナーな修正。
----------------------------------------
アップデートを受け取るために必要なユーザー:バージョン9.18
-----------------------------------------
ありがとうございました。
バージョン 9.17
2020.07.26
1. An important update to service the upcoming EA.
- a. A2SR will not display all instruments while on 1 chart together with the EA.
- b. A2SR and the EA can now communicate with each other better.
- c. A description of the feature and how it works will be written in the next pages (blog).
2. Requested by my respected users:
- a. Early Sign Breakout/Down has option "Ray - true/false" to extend the dashed line.
- b. Push Notification has additional options.
- c. Email alerts have a specific subject/title.
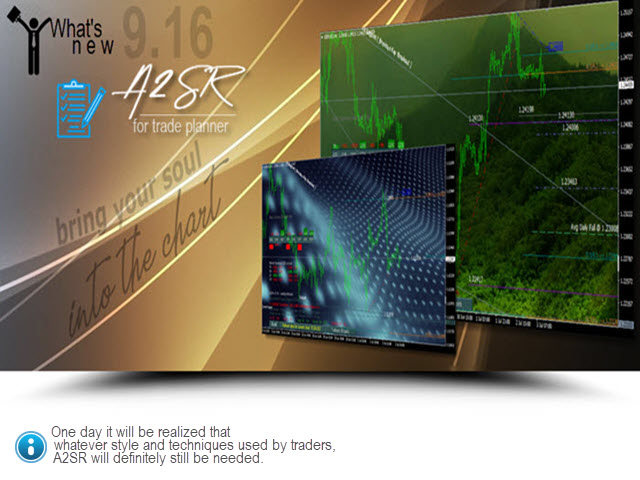
バージョン 9.16
2020.07.04
Add new features:
1. A2SR has been prepared to be read by the upcoming EA.
---
2. (v.9.16) Auto select: suffix currency pair - default is " true "
Note.
Generally, every account has the same suffix currency.
but if one trading account is still separated by other suffix currencies,
then you can choose the option: false, and fill in the suffix manually.
* A2SR first checks the required 30 currency pairs and prepares them on the market watch.
- It is useful for the MCS and MS processes
---
3. Trader can use a picture as chart background
-- default file name is " wall-01 " - user can change it in the option.
-- (v.9.16) Chart Background: file *.bmp = wall-01
Note.
-- The file type is * .bmp which is placed in the installed MT4 - folder " Images "
-- Click File => Open Data Folder => MQL4 => Images
-- Use a picture that has the same resolution size as your computer monitor.
---
4. Add new button for refresh data.
-- (v.9.16) Enable button: Refresh data for all pairs - default is " false "
-- select " true " if you want to show the buttons.
Description.
In the current version of MT4, historical data in the same computer is
still separated based on each installation and each trading account.
* even in the same broker, the data is still separated by account number.
That is why completing the data to be read on the chart is very important
to be prepared by right-click on the chart and select " refresh " for each time frame.
---
In the following conditions we must prepare complete historical data,
or at least by select ‘Refresh’ on chart for all time frames :
1. When installing a new MT4 on any devices,
2. When using a new trading account,
3. * or an old trading account that is using in the new MT4 installation.
Each pair in the chart has 9 time frames: M1, M5, M15, M30, H1, H4, D1, W1 and MN
For 28 pairs that are commonly needed, traders must ensure data completeness:
==> 28 x 9 = 252 times to refresh the data.
By this feature then you will get complete data instantly,
and you will save much time.
---
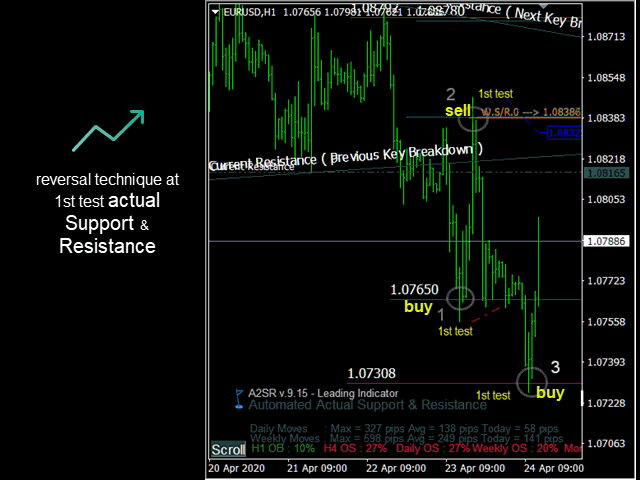
バージョン 9.15
2020.05.01
1. Minor fix in displaying W.S/R & D.S/R
2. Display the status of the last reversal (based on MCS)
- - into the object name "revstatus", then your EA can read it.
バージョン 9.14
2020.03.21
A. Add new option.
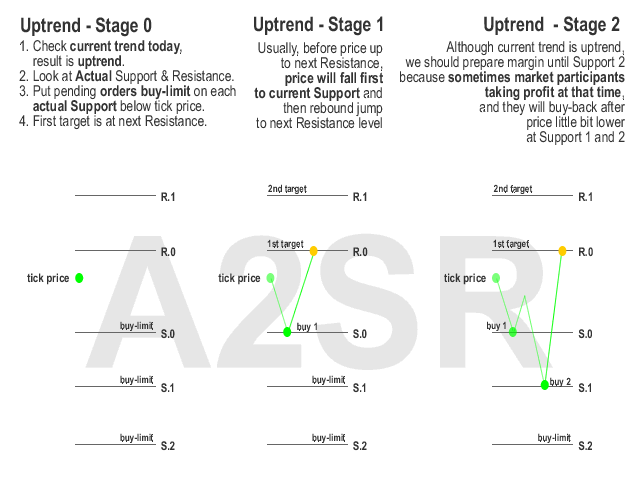
1. Automatic select trading style of actual SR
-- A2SR will select actual SR automatically for your trading style based on time frame you use.
Example :
At the time if A2SR found 17 actual SR that available in the chart,
and then A2SR will automatically select them according to your current time frame:
-- H1, then A2SR will select style for short-term (Day trading), eg. 8 actual SR will displayed on chart.
-- H4 and above, then A2SR will only display 4 stronger actual SR for Swing style.
-- When you use M5 and below, then A2SR will display all of 17 actual SR because of them are able to use for scalping.
2. Added options for the type of SR that will be displayed based on trading style
-- Swing, day trading (short-term) and scalping.
-- Will be applied when you set Automatic = "false" (see A.1)
3. Added option to change color - Early Sign Breakout/down
B. Special update:
-- Improve performance significantly.
バージョン 9.12
2020.02.12
Important improvements.
Added balance value analysis in major currencies to increase accuracy of OB/OS based on MCS
-- see update version 9.10
バージョン 9.11
2020.02.10
Minor fix :
-- restore MCS graph from marking after OB/OS has ended.
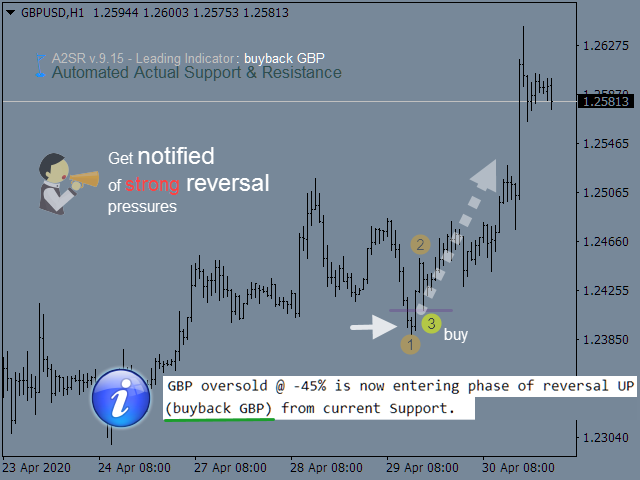
バージョン 9.10
2020.02.09
Add new feature.
The original technique for getting overbought and oversold (OB/OS)
for trade opportunities based on MCS (Major Curency Strength)
A2SR will immediately send you a notification at the time a currency reach OB/OS level.
Default is 45, and bigger number will be much better.
A2SR will also mark this situation on the MCS graph.
1. Sell.
-- When a currency rises high to reach the overbought MCS level,
-- then A2SR will immediately send you a notification preparing to sellback a currency at the nearest Resistance.
2. Buy.
-- Vice versa, when a currency falls and gets lower, reaching the oversold MCS level,
-- then A2SR will immediately send you a notification preparing to buyback a currency at the nearest Support.
Knowledge.
When a currency is overvalued. or vice versa is too cheap,
-- then usually the central bank will act to intervene in the market by reversing transactions.
Why? Because actually, a country's central bank wants stability,
-- that is the value of a currency that only moves within a certain range.
We must realize that the central bank and the state must make a lot of planning,
budgeting, payment of trade debts, price competition for products and services, and so on.
Even if the value of the currency is forced by market participants to keep going up,
-- the central bank will try to stabilize it again.
That's why there are more sideways (ranging) than the number of price rallies.
Even if the value of the currency before the rally breakouts,
-- it will start with the sideways first in the several periods.
Note.
A2SR uses all time frames and all currency pairs to get its performance.
Unfortunately the tester cannot provide the multiple data needed at the same time.
Important features in A2SR that cannot be presented properly in tester are
1. Major Currency Strength (MCS) and
2. Market Sentiment (MS).
It is recommended that A2SR not be used in a tester
-- due to the limited availability of data that must be processed in the same time.
バージョン 9.0
2019.12.07
Minor update on objects deletion.
バージョン 8.99
2019.05.30
Requested by users.
-- Send notification to email (true/false)
-- Default : false.
バージョン 8.98
2019.04.17
Requested by user.
-- Add new option : Show Object Description
バージョン 8.97
2019.04.09
Requested by users.
Add option:
-- Display description for trendline (true/false)
-- Default is true.
バージョン 8.96
2019.03.19
Minor fixes
1. Allow user to use their own Fibonacci.
-- (requested by user)
2. Increase performance.
バージョン 8.95
2019.03.14
Add new feature for trendline type :
1. Swing
-- Traders prefer to use reversal techniques.
2. Aggressive
-- Traders prefer also to use breakout and breakdown techniques in lower time frames.
バージョン 8.94
2019.01.07
Important update.
1. Fix MCS algorithm on push notification.
2. Duration (5M, 15M, 30M, 1H) is now included in text.
バージョン 8.93
2019.01.06
Add new feature:
Push notification (alert) at the time MCS catch new trend for each major currency.
Description:
1. Activate on 1 chart in the most up-to-date pair currency: e.g EURUSD
-- by set "true" in the option "Alert (Push Notification) for MCS"
2. Select the duration of checking trend changes.
-- Available option : 5, 15, 30 minutes and 1 hour.
3. We can activate this feature on any time frame.
-- A2SR will always read MCS at every new bar/candle according the duration in the option (number 2).
Note.
After that it is recommended not to change the graph scale or other options,
-- because MT4 will re-read the basic function OnInit () which causes the previous MCS trend value to return null,
-- and we must wait for the next duration to get the trend movement on MCS.
バージョン 8.92
2019.01.02
Final fixes to display objects on 4K Screen Monitor.
1. New option "Space between object" as a decimal number.
2. A2SR will arrange the position of the object automatically in the chart.
3. Default value 1 for screen resolution 1366 x 768
4. For user who use higher resolution (1920 x 1080 or above) can set with any decimal number in the option
-- e.g : 1.50, 2.5, 3.30 and so on to fit your screen resolution.
バージョン 8.91
2018.12.26
Fix update.
Displaying MCS and MS objects for
-- 4K Screen Monitor.
Note :
1. Default resolution is good at 125%.
2. When user use higher resolution at 250%
-- then please reduce font size in option to make objects fits on screen.
バージョン 8.90
2018.12.20
Update for Major Currency Strength (MCS).
New available option:
1. Display MCS onto chart (for non 4K screen).
2. -- or as a comments on the top left corner.
Number 2 is a temporary solution for users who use 4K screen.
-- A2SR development is still continuing.
バージョン 8.89
2018.12.16
Minor fixes in displaying MCS (Major Currency Strength)
バージョン 8.88
2018.12.16
Add new features:
1. Major Currency Strength.
-- Assistance for choosing a best currency pair today.
2. Button to scroll the chart.
Through the button, we can scroll the chart up or down,
and the size of the chart remains proportional.
-- Makes it easy to place pending orders (buy-limit, sell limit) on each actual Support/Resistance.
バージョン 8.87
2018.11.24
Minor fixes.
1. Updating for Daily Jump/Fall level and Weekly Moves.
2. Improve performance.
バージョン 8.86
2018.11.19
1. Minor fixes to improve performance.
2. Draw an object when price meet conditions for OB/OS.
--- to remind you visually.
バージョン 8.85
2018.11.18
New alert for Overbought and Oversold.
Wherever you open the time frame, A2SR will send you
a push notification for OB/OS H4 and Daily
to catch opportunity on price correction at next SR.
OB = wait for next Resistance.
OS = wait for next Support.
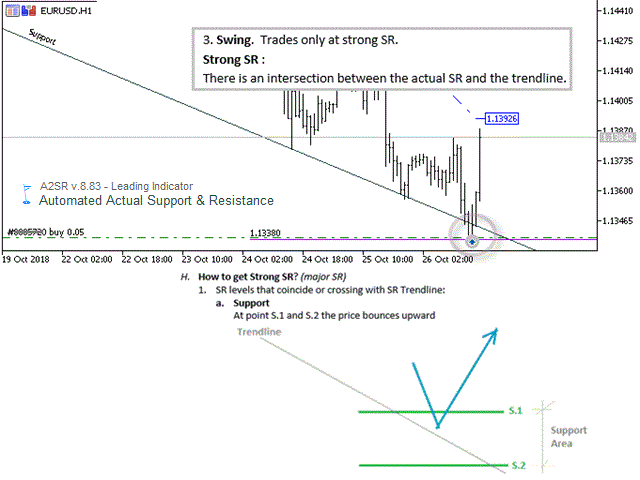
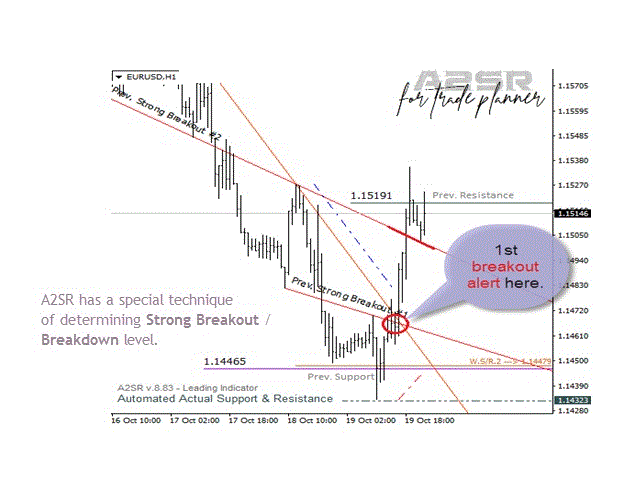
バージョン 8.83
2018.10.21
-- New feature --
Strong Breakout and Strong Breakdown with Push Notification alert.
On this pattern then price rally could be expected.
バージョン 8.82
2018.10.20
Minor fixes :
Display Market Sentiment option for 4K screen.
1. Users can adjust the font size.
2. The layout of letters and numbers will be adjusted automatically.
バージョン 8.81
2018.10.08
Minor fixes to maintain zoom level (chart scale)
that have been determined by the user.
バージョン 8.80
2018.09.25
Minor fixes for deletion object rectangle.
バージョン 8.79
2018.09.10
* Urgently needed by user who use large screen resolution.
+ Add new option for title and text size for Market Sentiment and other text information at bottom left.
バージョン 8.78
2018.05.03
Push Notification can be selected for:
1. Arrow only.
2. SR level and break only.
3. All.
バージョン 8.77
2018.02.22
A2SR v. 8.77
1. New Actual SR: dashed line with text price in the middle of line.
2. Arrows to remind us that the price is close to Strong SR (H4 only).
3. New trendline breakout/breakdown taken from actual SR.
4. Alert for Push Notification and screen ~ when price is reached important level.
eg. Key breakout/breakdown, actual SR, Daily Jump/Fall on news/speech, etc.
5. Minor fixes:
a. Rectangle as sideways area to prepare next breakout/breakdown.
b. Users can choose whether to use a bar chart or other.
-----
1, 2, 3, 4, 5.a : no lagging and no repaint.
バージョン 8.73
2017.09.18
New option for trading style.
SR Style :
1 for Swing,
2 for Short-Term.
Default is 2.
------------------------------------------------
A2SR will auto select the SR level according to your trading style.
Even though you are changing the time frame but the SR level will remain on its position.
Because the actual SR is not obtained from the time frame you use.
バージョン 8.6
2017.06.29
Minor fixes, and update feature:
- Suffix currency,
- Early sign for breakout/down,
- Initial Asian's range today, to prepare breakout in Session Europe & U.S
バージョン 8.3
2016.08.09
SR placement level has been improved,
so that new users can more easily understand.
バージョン 8.2
2016.07.06
A2SR Version 8.2
SR level value from level 1, 2 and 3 can be adjusted.
Higher value will be stronger for determining Support and Resistance.
It will also useful for :
CFD - Indices, Equities,
and more benefit for Swing traders.
バージョン 8.1
2016.06.20
Version 8.1
A2SR makes selection for stronger S/R automatically.
++ Only strong S/R that will be displayed on a chart.
This version is able to support trade in any style, Swing and Scalping (Intraday).
1. Display the stronger S/R.
2. Display power index USD versus EUR scaling in timeframe H1, H4, D1 and W1.
(Make sure USDSEK and EURSEK are available in your MT4)
3. Display the trend that available today.
4. OB/OS scaling in timeframe H1, H4, D1, W1 and MN
5. Automated Fibonacci scaling in timeframe H1, H4, D1, W1 and MN
6. Leveling price jump/fall - especially for breaking news
7. Display average moves (pips) for H4, Daily and Weekly, and remaining pips as room for next moves.
8. Automated trendline for breakout and breakdown signal.
バージョン 5.8
2014.09.30
Update:
- USDx and EURx
- Jump/Fall levels.
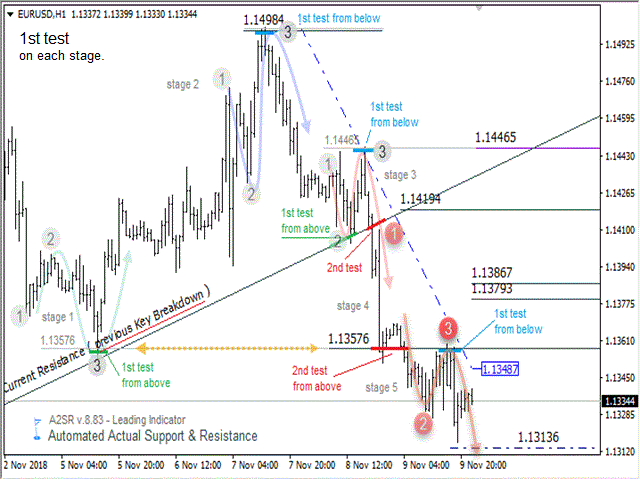
バージョン 5.7
2014.08.04
1. Trend line is useful for detecting a pattern, which is intended for the triangle pattern, Support & Resistance lines, and as a breakout up or down line.
2. The trend lines are formed first before the price of the pair reaches it. So, it does not repaint.
3. Each line has a description, such as Support, Resistance, Current-Support as key breakout down, and Current-Resistance as a key breakout up.
4. Each broke out line turns into a new support or resistance line. These changes run automatically and in real-time.
5. S/R horizontal lines nearest to the trend line are strong S/R levels.
バージョン 5.6
2014.07.31
The performance of the process is significantly increased.
バージョン 5.5
2014.07.28
1. Displays the total movement pips maximum/average on each scale of H4, Daily and Weekly. Displayed in counted pips and limit lines on the graph.
2. Showing recommendation for placing pending orders based on the current daily trend.
3. A2SR displays boundaries Support & Resistance levels in real time along with the recommendation for mileage price.
With A2SR then you will have a lot more free time for things that are more useful than just busy drawing on your chart that would look too crowded and dirty :)


Hello, I am a customer from China and have run out of activation times. Can you provide me with a version without activation restrictions? I bought the A2SR indicator, 250USD