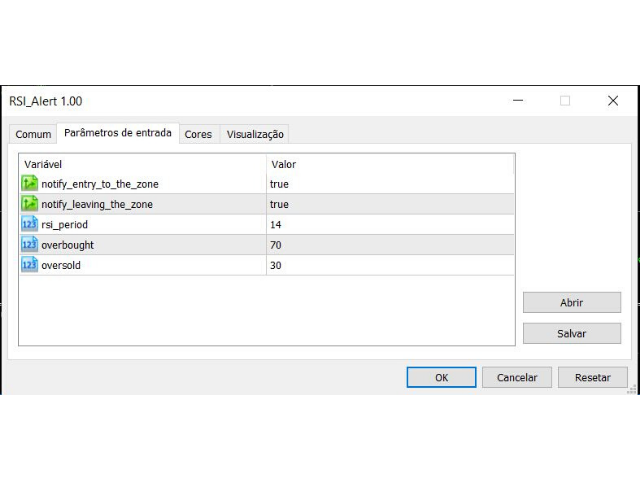
RSI Zone Alert
- インディケータ
- Aurelio Miguel Machado Da Silva
- バージョン: 1.0
It would be useful if you can add push notification, because now I still have to monitor my computer screen, to get a notification that I am watching...

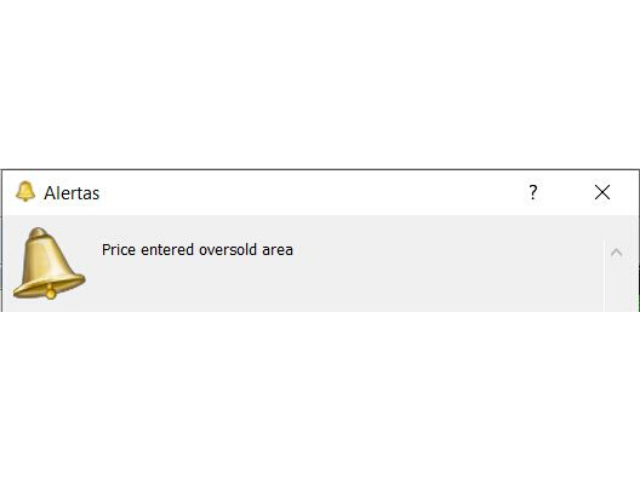
Super usefull, it's what I need for not be watching the screen all day, only when the market arrives the zone that I'm interested on.
Super usefull, it's what I need for not be watching the screen all day, only when the market arrives the zone that I'm interested on.