• 概要
  • レビュー
  • コメント (7)

Two Pairs Square Hedge Meter

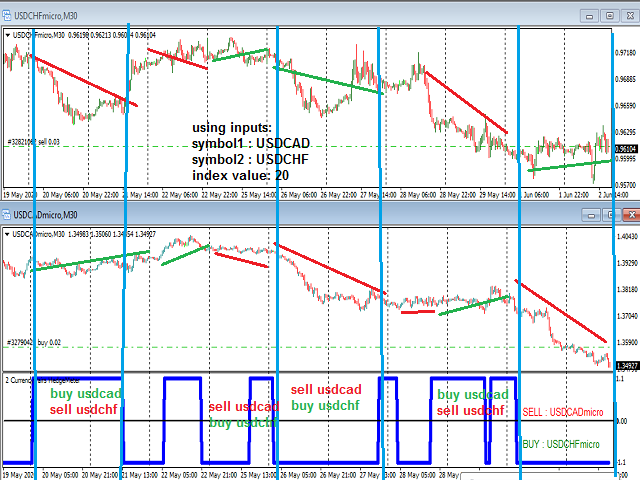
TWO PAIRS SQUARE HEDGE METER INDICATOR

Try this brilliant 2 pairs square indicator

It draws a square wave of the relation between your two inputs symbols

when square wave indicates -1 then it is very great opportunity to SELL pair1 and BUY Pair2

when square wave indicates +1 then it is very great opportunity to BUY pair1 and SELL Pair2

the inputs are : 2 pairs of symbols

        then index value : i use 20 for M30 charts ( you can try other values : 40/50 for M15 , : 30 for M30 , : 10 for H1 , : 300 for M1 .....) 

       starting points : numbers of bars for indicators drawn history : 100 ....1000

Alerts when indicator shift from -1 to 1 or from 1 to -1 (to end old positions and enters new opposite positions)


おすすめのプロダクト
Noize Absorption Index - is the manual trading system that measures the difference of pressure between bears forces and bulls forces. Green line - is a noize free index that showing curent situation. Zero value of index shows totally choppy/flat market.Values above zero level shows how powerfull bullish wave is and values below zero measures bearish forces.Up arrow appears on bearish market when it's ready to reverse, dn arrow appears on weak bullish market, as a result of reverse expectation. S
199 USD
これは、キャンドルの終値を予測する指標です。 このインジケータは、主にD1チャートでの使用を目的としていますが. この指標は、従来の外国為替取引とバイナリオプション取引の両方に適しています。 インジケーターは、スタンドアロンのトレーディングシステムとして使用することも、既存のトレーディングシステムへの追加として機能させることもできます。 このインジケーターは、現在のキャンドルを分析し、キャンドル自体の内部の特定の強度係数と、前のキャンドルのパラメーターを計算します。 したがって、この指標は、市場の動きのさらなる方向性と現在のキャンドルの終値を予測します。 この方法のおかげで、この指標は、短期の日中取引だけでなく、中期および長期の取引にも適しています。 インジケーターを使用すると、市場の状況の分析中にインジケーターが生成する潜在的な信号の数を設定できます。 インジケーターの設定には、このための特別なパラメーターがあります。 また、インジケーターは、チャート上のメッセージの形式で、電子メールで、およびPUSH通知の形式で、新しい信号について通知することができます。 購入後は必ず私に書いて
65 USD
Forex Indicator   INSIDE Bar   Pattern for MT4 Indicator  " INSIDE Bar "  is very powerful indicator for Price Action trading Indicator detects INSIDE Bar patterns on chart: Bullish  INSIDE Bar - Blue arrow signal on chart (see pictures) Bearish  INSIDE Bar - Red arrow signal on chart (see pictures) No repaint; No delays; High R/R ratio (reward/risk);   PC, Mobile & Email alerts   are included Indicator  "   INSIDE Bar   Pattern"  is excellent to combine with   Support/Resistance  Levels:    htt
39.99 USD
Accuracy of correct predictions 83%! This indicator was tested on the basis of real statistics for all market indicators according to indicators for 3 months of trading. 83% of correct trade forecasts for usd / jpy on the m30 time frame were received on our statistics! if you have any questions, please contact us in private messages or in discussions under this indicator and we will figure it out and help any questions will arise personal messages or in discussions under this indicator As soon
100 USD
Requirements Optimized to work with   EURUSD-EURCHF-USDJPY, AUDUSD-CADJPY-AUDNZD, CHFJPY-NZDJPY-NZDUSD For timeframe 4H. *(Minimum recommended deposit is $300 for each Pair) for initial lot set to 0.10, My favorite Pair are (CHFJPY-NZDJPY-EURUSD-AUDNZD-USDJPY) Warning it will be SALE only 5 Copys at 60$ Then it will be update up to 200$  You can use it the way it is, For new Set Files will be add on (Comments) ECN broker with low spread is recommended to get better results. Setup is
60 USD
The indicator displays the data of the Stochastic oscillator from a higher timeframe on the chart. The main and signal lines are displayed in a separate window. The stepped response is not smoothed. The indicator is useful for practicing "manual" forex trading strategies, which use the data from several screens with different timeframes of a single symbol. The indicator uses the settings that are identical to the standard ones, and a drop-down list for selecting the timeframe. Indicator Parame
30 USD
Trade with Gann on your side!! MASTER CIRCLE 360 CIRCLE CHART, originally created by Gann admitted that this is “The Mother of all charts”. It is one of the last studies that this great trader left for us. The numeric tab le is apparently quite simple like all the tables and is based on square numbers, the SQUARE OF 12 and is by evolution, one of the most important square numbers. Here we can find CYCLE, PRICE AND TIME thanks to angles and grades, to show past and future support and resistance.
149.99 USD
インディケータは、フィボナッチのサポートとレジスタンスのレベルを自動的に計算してプロットします。これは、市場分析に最も効果的なツールの1つです。 計算では、選択した期間と時間枠の平均価格データが使用されます。この期間の最小値と最大値は、移動の開始と終了と見なされます。 フィボナッチレベルを使用すると、価格の動きが遅くなったり逆転したりする可能性のある潜在的な参照ポイントを確認できます。つまり、フィボナッチレベルは、さらなる動きを予測したり、ストップ注文や指値注文を行うために使用されます。 パラメーター: PartsShow-現在のバーから表示された履歴レベルの数 CalcPeriod-価格平均期間 SmoothingMethod-価格平均化方法(26オプション) TF-計算に使用される時間枠 LevelColor-レベルラインの色 ZeroLevelColor-ゼロレベルの色 ShowVerticalLine-レベル間の垂直線の表示を有効/無効にします VLineStyle-垂直線のスタイル VLineColor-垂直線の色 ShowInfo-レベルパーセンテージの値に関する情報をラベ
30 USD
Fibonacci retracements is a popular instrument used by technical analysts to determine support and resistance areas. In technical analysis, this tool is created by taking two extreme points (usually a peak and a minimum) on the chart and dividing the vertical distance by the key Fibonacci coefficients equal to 23.6%, 38.2%, 50%, 61.8%, and 100%. Once these levels are defined, horizontal lines are then drawn and used to determine possible support and resistance levels. When using the Auto Fibonac
30 USD
An indicator of pattern #31 ("Long Island") from Encyclopedia of Chart Patterns by Thomas N. Bulkowski. The second gap is in the opposite direction. Parameters: Alerts - show alert when an arrow appears   Push - send a push notification when an arrow appears (requires configuration in the terminal) GapSize - minimum gap size in points ArrowType - a symbol from 1 to 17 ArrowVShift - vertical shift of arrows in points   ShowLevels - show levels ColUp - color of an upward line ColDn - color of
30 USD
Strong Retracement Points Pro demo edition! SRP (Strong Retracement/Reversal Points) is a powerful and unique support and resistance indicator. It displays the closest important levels which we expect the price retracement/reversal! If all level are broken from one side, it recalculates and draws new support and resistance levels, so the levels might be valid for several days depending on the market! If you are still hesitating to start using this wonderful tool, you can check this link to see h
100 USD
This is a new strategy for SUPPLY DEMAND areas It is based on a calculation using the tick volume to detect the big price action in market for both bear /bull actions this smart volume action candles are used to determine the supply and demand areas prices in between main supply and demand lines indicate sideway market  up arrows will be shown when prices moves above the main supply and the secondary supply lines Down arrows will be shown when prices moves below the main demand and the secondary
30 USD
This unique multi-currency strategy simultaneously determines the strength of trends and market entry points, visualizing this using histograms on the chart. The indicator is optimally adapted for trading on the timeframes М5, М15, М30, Н1. For the convenience of users, the indicator renders the entry point (in the form of an arrow), recommended take profit levels (TP1, TP2 with text labels) and the recommended Stop Loss level. The take profit levels (TP1, TP2) are automatically calculated for
79 USD
Laguerre SuperTrend Clouds adds an Adaptive Laguerre averaging algorithm and alerts to the widely popular SuperTrend indicator. As the name suggests, Laguerre SuperTrend Clouds (LSC) is a trending indicator which works best in trendy (not choppy) markets. The SuperTrend is an extremely popular indicator for intraday and daily trading, and can be used on any timeframe. Incorporating Laguerre's equation to this can facilitate more robust trend detection and smoother filters. The LSC uses the impro
30 USD
The Th3Eng PipFinite indicator is based on a very excellent analysis of the right trend direction with perfect custom algorithms. It show the true direction and the best point to start trading. With StopLoss point and Three Take Profit points. Also it show the right pivot of the price and small points to order to replace the dynamic support and resistance channel, Which surrounds the price. And Finally it draws a very helpful Box on the left side on the chart includes (take profits and Stop loss
89 USD
You can change the time period of the chart at the touch of a button. You can also change multiple charts at the touch of a button. You can also change multiple charts at the touch of a button, saving you the trouble of changing time periods. We are live-streaming the actual operation of the system. https://www.youtube.com/@ganesha_forex We do not guarantee your investment results. Investments should be made at your own risk. We sharll not be liable for any disadvantage or damage caused by
30 USD
VR Cub
Vladimir Pastushak
VR Cub は、質の高いエントリーポイントを獲得するためのインジケーターです。このインジケーターは、数学的計算を容易にし、ポジションへのエントリーポイントの検索を簡素化するために開発されました。このインジケーターが作成されたトレーディング戦略は、長年にわたってその有効性が証明されてきました。取引戦略のシンプルさはその大きな利点であり、初心者のトレーダーでもうまく取引することができます。 VR Cub はポジション開始ポイントとテイクプロフィットとストップロスのターゲットレベルを計算し、効率と使いやすさを大幅に向上させます。取引の簡単なルールを理解するには、以下の戦略を使用した取引のスクリーンショットを見てください。 設定、設定ファイル、デモ版、説明書、問題解決方法は、以下から入手できます。 [ブログ] レビューを読んだり書いたりすることができます。 [リンク] のバージョン [MetaTrader 5] エントリーポイントの計算ルール ポジションをオープンする エントリーポイントを計算するには、VR Cub ツールを最後の高値から最後の安値までストレッチする必要があります。
34 USD
This scanner shows any monitored wave on your selected symbols. Wide range of alerts and other parameters, you immediately know when and how to trade, post-purchase support is a matter of course, so do not hesitate to contact me  Alert Settings  Alert Bid Price Cross High/Low Alert Percent Reached Percent Value Use Popup Alerts? Use Notification Alerts? Use Email Alerts?
400 USD
The RTrends indicator does two things: first, it automatically draws the layout of the price chart by plotting trend lines and, secondly, it produces bearish and bullish signals. The layout reflects the fractal nature of the market. Trends from different time horizons are applied simultaneously on the chart. Thus, from a single chart a trader can see trend lines of higher timeframes. The lines, depending on the horizon, differ in color and width: the older the horizon, the thicker the line is. T
60 USD
Owl smart levels
Sergey Ermolov
4.76 (41)
MT5版  |  インストールする方法?   |   FAQ Owl Smart Levels Indicator   は、 Bill Williams   の高度なフラクタル、市場の正しい波構造を構築する Valable ZigZag、エントリの正確なレベルをマークする Fibonacci レベルなどの一般的な市場分析ツールを含む 1 つのインジケーター内の完全な取引システムです。 利益を得るために市場と場所に。 戦略の詳細な説明 インジケータを操作するための指示 顧問-取引助手 プライベートユーザーチャット ->購入後に私に書いて、私はプライベートチャットにあなたを追加し、あなたはそこにすべてのボーナスをダウンロードすることができます 力はシンプルさにあります! Owl Smart Levels   取引システムは非常に使いやすいので、専門家にも、市場を勉強し始めて自分で取引戦略を選択し始めたばかりの人にも適しています。 戦略と指標に秘密の数式や計算方法が隠されているわけではなく、すべての戦略指標は公開されています。 Owl Smart Levels を使用すると、取引を開始す
72.75 USD
無限からの通貨の強さを測定するためのこの革新的な指標は、長い間取引されているダフ屋やトレーダーにとって不可欠な助手です。 通貨の強さ/弱さを分析するためのシステムは、世界の主要なトレーダーによって市場で長い間知られており、使用されてきました。 任意の裁定取引は、この分析なしでは完全ではありません。 私たちの指標は、互いに関連して基本通貨の強さを簡単に決定します。 これは、インスタント分析を可能にし、最強のエントリポイントを検索し、すべてまたは現在の通貨ペアの折れ線グラフが表示されます。 インジケータは直感的で、すぐに見つけて任意のペアに切り替えることができ、地下室とメインチャートの両方に配置できるモバイルパネルがあります。 通貨の強さの変化の通知のタイマーモードは、トレーダーに電話で通知を受け取る機会を与えます。  通貨パワーメーターインフィニティ指標を使用するためのいくつかの戦略: 1. 通貨の強さの線形表示のチャートを使用して、交差点を新興トレンドの信号として検索します 2. トレンド反転信号が表示された後、強い通貨の方向に頭皮 3. 通貨の強さの発散分析を使用して、
49 USD
All Symbols   AND  All Time frames Scan                                                                                                                 Document Introduction   The ABCD is a basic harmonic pattern. The ABCD pattern is a visual, geometric chart pattern comprised of three consecutive price swings. It looks like a diagonal lightning bolt and can indicate an upcoming trading opp
30 USD
To get access to MT5 version please click here . - This is the exact conversion from TradingView: "Stochastic Momentum Index" By "UCSgears". - This is a popular version of stochastic oscillator on tradingview. - This is a light-load processing and non-repaint indicator. - Buffers are available for the lines on chart. - You can message in private chat for further changes you need. Thanks for downloading
40 USD
MT4インジケーター。 3つのレベルのフィボナッチサポートとレジスタンスレベルが自動的に描画されます。 彼らです: 月レベル:ミディアムオーキッド ウィークリーレベル:オレンジレッド デイラインレベル:ターコイズ 色はパラメータで調整できます。 MT5 Version: https://www.mql5.com/EN/market/product/80068 この指標は主に、より良いトレード分析のために将来のサポートとレジスタンスレベルを分析するために使用されます。 サポートレベルが何度も効果的にサポートされている場合、市場は以前の最高点を突破し、効果的なトレンドブレイクアウトは長くなります。 下降後、市場は何度も圧力レベルを超えることはできず、その後下降して以前の低価格を再び突破し、効果的なトレンドはショートポジションを突破します。 市場が過去の高値または安値の領域に達すると、チャートには2レベルのFibonacii線のみが描画され、インジケーターは市場の特定のスペースを待つ必要があるため、通常のレベルのプロンプトは表示されません。描画する前
40 USD
の紹介     Quantum平均足PRO チャート 市場のトレンドに対する明確な洞察を提供するように設計された平均足キャンドルは、ノイズを除去し、誤ったシグナルを排除する能力で知られています。混乱を招く価格変動に別れを告げ、よりスムーズで信頼性の高いチャート表現を導入しましょう。 Quantum Heiken Ashi PRO を真にユニークなものにしているのは、従来のローソク足データを読みやすい色のバーに変換する革新的なフォーミュラです。赤と緑のバーはそれぞれ弱気トレンドと強気トレンドをエレガントに強調し、潜在的なエントリーポイントとエグジットポイントを驚くほど正確に見つけることができます。 量子EAチャネル:       ここをクリック MT5のバージョン:       ここをクリック この注目すべき指標には、いくつかの重要な利点があります。 明確性の向上: 価格変動を平滑化することで、平均足バーは市場トレンドをより明確に表現し、有利な取引機会を特定しやすくします。 ノイズの削減: 誤ったシグナルを引き起こすことが多い不安定な価格変動に別れを告げます。 Quan
99.99 USD
Forex Gump
Andrey Kozak
2.83 (6)
Forex Gump is a fully finished semi-automatic trading system. In the form of arrows, signals are displayed on the screen for opening and closing deals. All you need is to follow the instructions of the indicator. When the indicator shows a blue arrow, you need to open a buy order. When the indicator shows a red arrow, you need to open a sell order. Close orders when the indicator draws a yellow cross. In order to get the most effective result, we recommend using the timeframes H1, H4, D1. There
69 USD
The Bollinger Band is a strategy that has become one of the most useful tools for spotlighting extreme short-term price moves. Bollinger Bands consist of a centerline and two price channels or bands above and below it. The centerline is typically a   simple moving average   while the price channels are the standard deviations of the stock being studied. The bands expand and contract as the   price action   of an issue becomes volatile (expansion) or becomes bound into a tight trading pattern (c
30 USD
Gold Bricks FX USES THE TREND WAVE INDICATOR AND IT CAN IDENTIFY THE BEGINNING AND THE END OF A NEW WAVE TREND MOVEMENT. AS AN OSCILLATOR, THE INDICATOR IDENTIFIES THE OVERBOUGHT AND OVERSOLD ZONES. IT WORKS GREAT TO CATCH THE SHORT TERM PRICE REVERSALS AND USES A MARTINGALE STRATEGY TO CLOSE ALL TRADES IN PROFIT. USE DEFAULT SETTINGS ON H1 OR HIGHER TIME FRAME ON ANY PAIR FOR MORE ACCURATE TRADES WHY THIS EA : Smart entries calculated by 4 great strategies The EA can be run on even a
45 USD
"The trend is your friend" is one of the best known sayings in investing, because capturing large trendy price movements can be extremely profitable. However, trading with the trend is often easier said than done, because many indicators are based on price reversals not trends. These aren't very effective at identifying trendy periods, or predicting whether trends will continue. We developed the Trendiness Index to help address this problem by indicating the strength and direction of price trend
49 USD
このプロダクトを購入した人は以下も購入しています
Gold Stuff
Vasiliy Strukov
4.88 (222)
Gold Stuff は、金専用に設計されたトレンド指標であり、あらゆる金融商品にも使用できます。 インジケーターは再描画せず、遅れません。 推奨時間枠 H1. それインディケータでフルオートExpert Advisor EA Gold Stuffが動作します。 あなたは私のプロフィールでそれを見つけることができます. 設定と個人的なボーナスを得るために、購入後すぐに私に連絡してください!   設定 矢印を描く - オンオフ。 チャートに矢印を描く。 アラート - 可聴アラートのオンオフ。 メール通知 - オンオフ。 電子メール通知。 プチ通知 - オンオフ。 プッシュ通知。 次に、色域を調整します。 Gold Stuff は、金専用に設計されたトレンド指標であり、あらゆる金融商品にも使用できます。 インジケーターは再描画せず、遅れません。 推奨時間枠 H1. それインディケータでフルオートExpert Advisor EA Gold Stuffが動作します。 あなたは私のプロフィールでそれを見つけることができます. 設定と個人的なボーナスを得るために、購入後
30 USD
現在26%オフ 初心者やエキスパートトレーダーに最適なソリューション! このインジケーターは、独自の機能と新しい計算式を取り入れた、ユニークで高品質、かつ手頃な価格のトレーディングツールです。たった1枚のチャートで28の為替ペアの通貨強度を読み取ることができます。新しいトレンドやスキャルピングチャンスの引き金となるポイントを正確に特定することができるので、あなたのトレードがどのように改善されるか想像してみてください。 ユーザーマニュアルはこちら  https://www.mql5.com/en/blogs/post/697384 これが最初の1本、オリジナルだ! 価値のないクローンを買わないでください。 特別な サブウィンドウの矢印で強い通貨の勢いを表示 GAPがあなたのトレードを導く! 基準通貨や気配値が売られすぎ・買われすぎのゾーン(外相フィボナッチレベル)にあるとき、個別チャートのメインウィンドウに警告表示。 通貨がレンジの外側から反落した場合、プルバック/リバーサルのアラート。 クロスパターンの特別なアラート 複数の時間枠を選択可能で、トレンドを素早く
148 USD
Trend Screener
STE S.S.COMPANY
4.81 (73)
トレンドインジケーター、1つのツールに組み込まれたすべての重要なトレンド機能を備えたトレンドトレーディングとフィルタリングのための画期的なユニークなソリューション! これは、すべてのシンボル/商品(外国為替、商品、暗号通貨、インデックス、株式)で使用できる100%再描画されていないマルチタイムフレームおよびマルチ通貨インジケーターです。 トレンドスクリーナーは、チャート内のドットで矢印トレンドシグナルを提供するインジケーターに続く効率的なインジケーターです。 トレンド分析インジケーターで使用できる機能: 1.トレンドスキャナー。 2.最大利益分析を備えたトレンドライン。 3.トレンド通貨強度メーター。 4.アラート付きのトレンド反転ドット。 5.アラート付きの強いトレンドドット。 6.トレンド矢印 毎日の分析例、毎日のシグナルパフォーマンス...など、トレンドスクリーナーインジケーターを使用して、ここで見つけることができます: ここをクリックしてください 期間限定オファー:トレンドスクリーナーインジケーターは、50ドルと生涯でのみご利用いただけます。 (元の価格125 $) MQ
50 USD
ご紹介     Quantum Breakout PRO は 、ブレイクアウト ゾーンの取引方法を変革する画期的な MQL5 インジケーターです。 13年以上の取引経験を持つ経験豊富なトレーダーのチームによって開発された Quantum Breakout PROは 、革新的でダイナミックなブレイクアウトゾーン戦略により、あなたの取引の旅を新たな高みに押し上げるように設計されています。 クォンタム ブレイクアウト インジケーターは、5 つの利益ターゲット ゾーンを備えたブレイクアウト ゾーン上のシグナル矢印と、ブレイクアウト ボックスに基づいたストップロスの提案を提供します。 初心者トレーダーにもプロのトレーダーにも適しています。 量子EAチャネル:       ここをクリック MT5バージョン:   ここをクリック 推奨事項: 時間枠: M15 通貨ペア: GBPJPY、EURJPY、USDJPY、NZDUSD、XAUUSD アカウントの種類: ECN、Raw、またはスプレッドが非常に低い Razor ブローカー時間: GMT +3 ブローカー : IC
99.99 USD
Advanced Supply Demand
Bernhard Schweigert
4.93 (304)
現在33%オフ 初心者にもエキスパートトレーダーにも最適なソリューション このインジケーターは独自の機能と新しい公式を多数内蔵しており、ユニークで高品質かつ手頃な取引ツールです。このアップデートでは、2つの時間枠ゾーンを表示できるようになります。より長いTFだけでなく、チャートTFとより長いTF(ネストゾーンを表示)の両方を表示できます。すべてのSupply Demandトレーダーの皆さんのお気に召すはずです。:) 重要情報の公開 Advanced Supply Demandの可能性を最大化するには、 https://www.mql5.com/ja/blogs/post/720245 にアクセスしてください。   エントリーまたはターゲットの正確なトリガーポイントを正確に特定できれば取引がどのように改善されるか想像してみてください。新しい基盤となるアルゴリズムに基づいて構築されているため、買い手と売り手の間の潜在的な不均衡をさらに簡単に特定できます。これは、最も強い需要と供給のゾーンと、過去のパフォーマンス(古いゾーンを表示)がグラフィカルに表現されるためです。これらの機能は、最適
148 USD
ブレーカートレーダーになり、価格が反転すると市場構造からの利益が変化します。 注文ブロックブレーカーインジケーターは、トレンドまたは価格の動きが枯渇に近づいており、逆転の準備ができていることを識別します。通常、反転または大規模なプルバックが発生しようとしているときに発生する市場構造の変化について警告します。 この指標は、ブレイクアウトと価格の勢いを識別する独自の計算を使用します。使い果たされる可能性のあるポイントの近くで新しい高値が形成されるたびに、インディケーターはその高値の作成を担当する最後の注文ブロックを描きます。次に、移動する価格とともに注文ブロックを追跡します。その後、価格が反対方向にシフトし、その注文ブロックを突破すると、新しい市場構造を作成し、トレンドまたは大きな後退の可能性のある反転の開始を警告します。 注文ブロックは、高値/安値が作成される前の最後の反対色のろうそくであり、価格がこれらの重要な領域を下抜けすると、トレンドの短期的ま​​たは長期的な反転の兆候です。 特徴 重要な枯渇点での市場構造の変化を警告します 価格が使い果たされるレベルに近づくと、
49 USD
mql5と Telegramの モーニング・ブリーフィングで、詳細とスクリーンショットを含む毎日のマーケット・アップデートをご覧 ください! FX Power MT4 NGは 、長年の人気を誇る通貨強度計FX Powerの次世代モデルです。 この次世代ストレングスメーターは何を提供するのでしょうか?初代FXパワーの魅力すべて プラス GOLD/XAUの強さ分析 より正確な計算結果 個別に設定可能な分析期間 カスタマイズ可能な計算上限値により、さらに優れたパフォーマンスを実現 もっと見たい人のための特別なマルチインスタンス設定 すべてのチャートでお好みの色を無限に設定可能 数え切れないほどの通知オプションにより、重要なことを見逃すことはありません。 Windows 11とmacOSのスタイルで角を丸くした新しいデザイン 魔法のように動くインジケーターパネル FXパワーの主な機能 すべての主要通貨の強さの完全な履歴 すべての時間枠における通貨の強さの履歴 すべてのブローカーとチャートで同一の計算結果 100%信頼できるリアルタイム計算 -> リペイントなし ドロップダウン・リストから
169 USD
TrendMaestro
Stefano Frisetti
5 (1)
note: this indicator is for METATRADER4, if you want the version for METATRADER5 this is the link: TRENDMAESTRO recognizes a new TREND in the bud, he never makes mistakes. The certainty of identifying a new TREND is priceless. DESCRIPTION TRENDMAESTRO identifies a new TREND in the bud, this indicator examines the volatility, volumes and momentum to identify the moment in which there is an explosion of one or more of these data and therefore the moment in which prices have strong probability of f
397 USD
現在20%OFF! 初心者やエキスパートトレーダーのためのベストソリューション! このダッシュボードソフトウェアは、28の通貨ペアで動作しています。それは私達の主要な指標(高度な通貨の強さ28と高度な通貨インパルス)の2に基づいています。それは全体の外国為替市場の大きい概観を与えます。それは、すべての(9)時間枠で28の外国為替ペアのための高度な通貨の強さの値、通貨の動きの速度と信号を示しています。チャート上で1つのインディケータを使用して市場全体を観察し、トレンドやスキャルピングの機会をピンポイントで見つけることができたら、あなたのトレードがどのように改善されるか想像してみてください。 このインディケータには、強い通貨と弱い通貨の識別、潜在的な取引の識別と確認がより簡単になるような機能が搭載されています。このインディケータは、通貨の強さや弱さが増加しているか減少しているか、また、すべての時間枠でどのように機能しているかをグラフィカルに表示します。 新機能として、現在の市場環境の変化に適応するダイナミックなマーケットフィボナッチレベルが追加され、すでに当社のAdvan
199 USD
支持線と抵抗線、そしてローソク足のギャップをチャート上に自動的に表示するため、価格が次に向かう可能性のある場所や反転する可能性のある場所を確認することができます。 このインジケーターは、私のウェブサイト(The Market Structure Trader)で教えているポジショントレード手法の一部として使用するように設計されており、ターゲットとエントリーの可能性のための重要な情報を表示します。 このインジケーターには、2つのコア機能と4つの追加機能があります: コア機能1 - 日足、週足、月足のサポートラインとレジスタンスラインの自動表示 このインジケーターは、直近2日間、最大6週間前、数ヶ月前のサポートレベルとレジスタンスレベルを自動的に引き込みます。これらのレベルの見た目は完全にカスタマイズすることができ、いくつ表示されるかを表示することもできます。これらの重要な水準は、しばしば主要な支持線と抵抗線として機能し、価格が転換して引き戻されたり反転したりする場所です。また、価格が向かうターゲットでもあるため、価格が転換する前に、取引に利用できる潜在的な距離を素早く確認するこ
49 USD
今、147ドル(いくつかの更新後に499ドルに増加します) - 無制限のアカウント(PCSまたはMac) RelicusRoad ユーザー マニュアル + トレーニング ビデオ + プライベート Discord グループへのアクセス + VIP ステータス 市場の新しい見方 RelicusRoad は、外国為替、先物、暗号通貨、株式、および指数の世界で最も強力な取引インジケーターであり、トレーダーに収益を維持するために必要なすべての情報とツールを提供します。初心者から上級者まで、すべてのトレーダーが成功するためのテクニカル分析と取引計画を提供します。これは、将来の市場を予測するのに十分な情報を提供する重要な取引指標です。意味をなさないチャート上のいくつかの異なる指標ではなく、完全な解決策を信じています.これは、信号、矢印 + 価格アクション情報を表示するオールインワンのインジケーターで、他に類を見ない非常に正確です。 強力な AI に基づいて、RelicusRoad は不足している情報とツールを提供して、あなたを教育し、トレーディングのプロ、成功したトレーダーにします。
147 USD
TPSpro TRENDPRO - is a trend indicator that automatically analyzes the market and provides information about the trend and each of its changes, as well as giving signals for entering trades without redrawing! The indicator uses each candle, analyzing them separately. referring to different impulses - up or down impulse. Exact entry points into transactions for currencies, crypto, metals, stocks, indices!  - To maximize the potential of TPSpro TREND PRO, read the full description   -  https://w
125 USD
RSI / TDIアラートダッシュボードを使用すると、取引するすべての主要ペアでRSIを一度に(ユーザーが選択可能に)監視できます。 次の2つの方法で使用できます。 1.複数の時間枠を選択すると、通常の取引条件を超えて延長された複数の時間枠がある場合にダッシュが表示されます。複数の時間枠にわたって買われ過ぎまたは売られ過ぎのレベルを達成したため、価格が最近激しく押し上げられたため、引き戻しまたは逆転が間もなく行われることを示す優れた指標です。 2. 1つの時間枠(トレードするのが好き)と複数のRSIレベルを使用して、その時間枠でのRSIの延長の強さを示します。これは、価格が一方向に非常に長く押し込まれ、市場が利益を得ることになっている場合に、平均回帰取引を行うための優れた戦略です。スクリーンショットの例では、H4 RSIが25レベルを超えて2ペアで拡張されていることがわかります。これは、通常の価格アクションよりもはるかに遠いため、長く行く良い機会です。 ダッシュボードは、選択した時間枠でろうそくが閉じたときに、選択したレベルでの延長された状態(買われ過ぎと売られ過
49 USD
Description: First of all Its worth emphasizing here that this Trading Tool is Non-Repainting, Non-Redrawing and Non-Lagging Indicator, Which makes it ideal for professional trading and expert advisers. For limited time only 40% OFF,  Now 60$ only. 4 purchases left & the price increases to 100$ Attention, the application might not work in the strategy tester,  Try Demo here before you buy:  here . The Smart Price Action Concepts Indicator is a very powerful tool for both new and experienced tr
60 USD
現在31%オフ! 初心者やエキスパートトレーダーに最適なソリューション! このインジケータは、独自の機能と秘密の数式を組み込んだ、ユニークで高品質かつ手頃な価格のトレーディングツールです。たった1枚のチャートで28の通貨ペアのアラートを表示します。新しいトレンドやスキャルピングチャンスの引き金となるポイントを正確に把握することができるので、あなたのトレードがどのように改善されるか想像してみてください! 新しい基本的なアルゴリズムに基づいて構築されているため、潜在的な取引の特定と確認がより簡単になります。これは、通貨の強さや弱さが加速しているかどうかをグラフィカルに表示し、その加速のスピードを測定するためです。加速すると物事は明らかに速く進みますが、これはFX市場でも同じです。つまり、反対方向に加速している通貨をペアにすれば、利益を生む可能性のある取引を特定することができるのです。 通貨の勢いを示す縦の線と矢印は、あなたの取引の指針となるでしょう。 ダイナミックマーケットフィボナッチ23レベルはアラートトリガーとして使用され、市場の動きに適応します。もしインパルスが黄色
88 USD
ご紹介   クォンタム トレンド スナイパー インジケーターは 、トレンド反転を特定して取引する方法を変革する画期的な MQL5 インジケーターです。 13年以上の取引経験を持つ経験豊富なトレーダーのチームによって開発されました。     クォンタムトレンドスナイパーインジケーター   は、非常に高い精度でトレンドの反転を識別する革新的な方法で、あなたのトレーディングの旅を新たな高みに押し上げるように設計されています。 ***Quantum Trend Sniper Indicatorを購入すると、Quantum Breakout Indicatorを無料で入手できます!*** クォンタム ブレイクアウト インジケーターは、トレンドの反転を特定するとアラートを発し、矢印を示し、3 つのテイクプロフィットレベルを提案します。 初心者トレーダーにもプロのトレーダーにも適しています。 量子EAチャネル:       ここをクリック MT5のバージョン:       ここをクリック 推奨事項: 期間: すべての時間枠。最良の結果を得るには、
99.99 USD
このダッシュボードは、市場構造反転インジケーターで使用するためのアラートツールです。主な目的は、特定の時間枠での取消の機会と、インジケーターと同様にアラートの再テスト(確認)についてアラートを出すことです。ダッシュボードは、それ自体でチャート上に配置され、バックグラウンドで動作して、選択したペアと時間枠でアラートを送信するように設計されています。多くの人々が1つのMT4の複数のチャートで市場反転インジケーターを実行するのではなく、一度に複数のペアと時間枠を監視するためにダッシュを要求した後に開発されました。 M5、M15、M30、H1、H4、およびD1の時間枠でアラートを出します。もちろん、取引の場合と同様に、より高い時間枠が最も効果的です。 このダッシュボードは、市場構造反転インジケーターのアドオンとして設計されています。それは独立して機能し、マーケットリバーサルアラートインジケーターによって与えられたパターンと信号にアラートを出します。 ここでマーケットリバーサルアラートインジケーターを取得します:https:// www.mql5.com/en/market/produ
49 USD
トレンド スキャナーは、マルチシンボルおよびマルチタイム フレームから市場トレンドをスキャンし、チャート上の可動パネルに表示します。分析にはゴールド スタッフ インジケーターを使用します。機能には、アラート、電子メール、およびプッシュ通知が含まれます。 トレーダーは、自分が選んだペアを複数選択して表示できます。 トレンド スキャナーは、トレンドの方向性を確認するための優れたツールであり、トレンドに従って売買注文のみを許可することで、手動取引または EA 取引に使用できます。 機能には、アラート、電子メール、およびプッシュ通知が含まれます。 トレーダーは、自分が選んだペアを複数選択して表示できます。 トレンド スキャナーは、トレンドの方向性を確認するための優れたツールであり、トレンドに従って売買注文のみを許可することで、手動取引または EA 取引に使用できま リアルタイム結果はこちらからご覧いただけます。 設定と個人的なボーナスを得るために、購入後すぐに私に連絡してください!
30 USD
ICT Template Indicator visualizes and automatically updates all important ICT elements for Scalpers, Day and Swing traders. It allows you too keep your chart clean and bring any elements by just one click to the side buttons. Thanks to mobile notifications on external liquidity levels, you will not miss any opportunity and you don't have to sit behind the screens whole day. Each element has fully customizable colours, width, line types, max timeframe to be shown etc... so you can really tweak y
49 USD
Cycle Sniper
Elmira Memish
4.41 (34)
NEW YEAR SALE PRICE FOR LIMITED TIME!!! Please contact us after your purchase and we will send you the complimentary indicators to complete the system . Cycle Sniper is not a holy grail but when you use it in a system which is explained in the videos, you will feel the difference. If you are not willing to focus on the charts designed with Cycle Sniper and other free tools we provide, we recommend not buying this indicator. We recommend watching the videos about the indiactor and system befor
199 USD
Gann Made Easy は、ミスター・ギャンの理論を使用した取引の最良の原則に基づいた、プロフェッショナルで使いやすい外国為替取引システムです。 W・D・ガン。このインジケーターは、ストップロスとテイクプロフィットレベルを含む正確な買いと売りのシグナルを提供します。 PUSH通知を利用して外出先でも取引可能です。 購入後はご連絡ください!私の取引のヒントと素晴らしいボーナスインジケーターを無料で共有します! おそらく、ギャンの取引手法についてはすでに何度も聞いたことがあるでしょう。通常、ギャンの理論は初心者のトレーダーだけでなく、すでにある程度の取引経験がある人にとっても非常に複雑なものです。なぜなら、ギャンの取引手法は理論的にはそれほど簡単に適用できるものではないからです。私はその知識を磨き、最良の原則を私の外国為替インジケーターに組み込むために数年を費やしました。 このインジケーターは非常に簡単に適用できます。必要なのは、それをチャートに添付し、簡単な取引推奨事項に従うだけです。このインジケーターは常に市場分析の仕事を行い、取引の機会を探します。適切なエントリーポイントを検出
55 USD
FX Volume
Daniel Stein
4.59 (34)
mql5と Telegramの モーニング・ブリーフィングで、詳細とスクリーンショットを含む毎日のマーケット・アップデートをご覧 ください! FX Volumeは、ブローカーの視点から市場のセンチメントをリアルに洞察する、最初で唯一の出来高インジケーターです。 ブローカーのような機関投資家が外国為替市場でどのようなポジションをとっているか、COTレポートよりもはるかに速く、素晴らしい洞察を提供します。 この情報をチャート上で直接見ることは、あなたの取引にとって真のゲームチェンジャーであり、画期的なソリューションです。 以下のようなユニークなマーケットデータ洞察から利益を得てください。 比率は 、通貨のロングポジションとショートポジションの比率をパーセントで表示します。 比率の変化は 、選択した期間内のロング比率とその変化率を表示します。 Volumes Totalは 、通貨の取引量(ロングとショート)の合計をロット単位で表示します。 Volumes Long :全通貨のロングポジションの取引量を表示します。 Volumes(ショート )は、全通貨のショートポジションの取引量を表示
249 USD
ADR反転インジケーターは、通常の1日の平均レンジに関連して価格が現在取引されている場所を一目で示します。価格が選択した平均範囲とレベルを超えると、ポップアップ、電子メール、またはプッシュを介して即座にアラートを受け取るため、プルバックと逆転にすばやくジャンプできます。インディケータは、チャート上に1日の平均レンジの極値で水平線を描画し、それらを超える価格の数学的確率が付加されているレベルを超える延長も描画します。詳細については、以下をご覧ください... インジケーターとモニターを補完するADRアラートダッシュボードここでも利用可能なすべてのペア:https:// www.mql5.com/en/market/product/62756 MT5バージョンはこちらからも入手できます:https:// www.mql5.com/en/market/product/64477/ 通常の1日平均レンジ(ADR)内で価格が取引され、これらのレベルを上回っている時間の約60%は、通常、その後の引き戻し(利益確定)の動きを伴う急激な価格の動きの指標です。毎日の範囲の上部または下部からの
49 USD
BUY INDICATOR AND GET EA FOR FREE AS A BONUS + SOME OTHER GIFTS! ITALO TRIANGLE INDICATOR  is the best triangle indicator ever created, and why is that? Using Geometry and Fibonacci the Indicator works on all time-frames and assets, indicator built after 7 years of experience on forex and many other markets. You know many triangle indicators around the internet are not complete, does not help, and it's difficult to trade, but the   Italo Triangle Indicator is different , the Italo Triangle Indi
65 USD
PRO Renko Systemは、特別にRENKOチャートを取引するために設計された高精度の取引システムです。 これは、様々な取引商品に適用することができる普遍的なシステムです。 システムは効果的に正確な逆転信号へのアクセスを与えるいわゆる市場の騒音を中和する。 表示器は非常に使いやすく、信号の生成に責任がある1つの変数だけがあります。 あなたは簡単にお好みの任意の取引ツールとレンコバーのサイズにツールを適応させることができます。 私はいつもあなたが私のソフトウェアで収益性の高い取引を支援するために余分なサポートを提供する準備ができています! 私はあなたに幸せで収益性の高い取引をしたいです! ご購入後にご連絡ください! 私はあなたに私のレンコチャートジェネレータを送信します。 私はまた、私の個人的な推奨事項やシステムの他のモジュールを無料で共有します!
75 USD
AW Trend Predictor
AW Trading Software Limited
4.71 (35)
1 つのシステムでのトレンド レベルとブレイクダウン レベルの組み合わせ。高度なインジケーター アルゴリズムは、市場のノイズをフィルター処理し、トレンド、エントリー ポイント、および可能なエグジット レベルを決定します。インジケーターシグナルは統計モジュールに記録されるため、最適なツールを選択してシグナル履歴の有効性を示すことができます。この指標は、テイクプロフィットとストップロスのマークを計算します。 マニュアル・説明書→   こちら / MT5版→   こちら インジケーターで取引する方法: Trend Predictor での取引は、たった 3 つの簡単なステップです。 ステップ 1 - ポジションを開く 70% 以上の成功率で買いシグナルが受信されました ステップ 2 - ストップロスの決定 逆信号でトランクを選択 ステップ 3 - テイクプロフィット戦略の定義 戦略 1: TP1 に到達したらポジション全体をクローズする 戦略 2: TP1 に達した時点でポジションの 50% をクローズし、TP2 に達した時点で残りの 50% をクローズします。 戦略 3: トレンドの反転で
55 USD
通貨強さウィザードは、取引を成功させるためのオールインワン ソリューションを提供する非常に強力な指標です。このインジケーターは、複数の時間枠のすべての通貨のデータを使用して、このまたはその外国為替ペアのパワーを計算します。このデータは、使いやすい通貨インデックスと通貨パワーラインの形式で表され、特定の通貨のパワーを確認するために使用できます。 必要なのは、取引したいチャートにインジケーターを接続することだけです。インジケーターは、取引する通貨の実際の強さを示します。このインジケーターは、トレンドに合わせて取引するときに有利に利用できる売買高の圧力の極値も示します。このインジケーターには、フィボナッチに基づく可能なターゲットも表示されます。 このインジケーターは、PUSH 通知を含むあらゆるタイプのアラートを提供します。 購入後ご連絡下さい。私の取引のヒントをあなたと共有し、素晴らしいボーナスインジケーターを無料で提供します! 幸せで有益な取引をお祈りします。
65 USD
サポートと抵抗のレベルは、長い間、市場分析のための強力なツールとなっています。 強力なサポート指標は、現地価格の最小値に基づいてサポートレベルをプロットし、現地価格の最大値に基づいて抵抗レベルをプロットします。  私の他の開発はここで見ることができます これは、トレンドに応じて取引し、同時に統合またはトレンド反転のゾーンを決定し、ストップロスを設定し、サポートと抵抗レベルで利益を取ることがで 設定と個人的なボーナスを受け取るために購入後すぐに私に連絡してください!  受信パラメータ - インジケータは複雑な設定を必要とせず、主なパラメータはカラースケールの調整です。 サポートと抵抗のレベルは、長い間、市場分析のための強力なツールとなっています。 強力なサポート指標は、現地価格の最小値に基づいてサポートレベルをプロットし、現地価格の最大値に基づいて抵抗レベルをプロットします。  私の他の開発はここで見ることができます これは、トレンドに応じて取引し、同時に統合またはトレンド反転のゾーンを決定し、ストップロスを設定し、サポートと抵抗レベルで利益を取るこ
30 USD
ADRアラートダッシュボードは、価格が通常の1日の平均範囲に関連して現在取引されている場所を一目で示します。価格が選択した平均範囲とレベルを超えると、ポップアップ、電子メール、またはプッシュを介して即座にアラートを受け取るため、プルバックと逆転にすばやくジャンプできます。ダッシュは空白のチャートに配置されるように設計されており、バックグラウンドに座ってレベルに達したときに警告を発するので、座って見たり、まったく見たりする必要はありません。 ここで利用可能なMT5バージョン:https:// www.mql5.com/en/market/product/66316 NEW:毎週と毎月の平均範囲とそれらへのアラートも表示されるようになりました! ここでチャートのレベルを下げるADRリバースインジケーターを入手してください:https:// www.mql5.com/en/market/product/62757 通常の1日平均レンジ(ADR)内で価格が取引され、これらのレベルを上回っている時間の約60%は、通常、その後の引き戻し(利益確定)の動きを伴う急激な価格の動きの指標で
49 USD
トレンドラインマップインジケーターは、トレンドスクリーナーインジケーターのアドオンです。トレンドスクリーナー(トレンドラインシグナル)によって生成されたすべてのシグナルのスキャナーとして機能します。 これは、トレンドスクリーナーインジケーターに基づくトレンドラインスキャナーです。 Trend Screener Pro インジケーターがない場合、Trend Line Map Proは機能しません。 ブログにアクセスすると、トレンドラインマップインジケーターの無料バージョンをダウンロードできます。 Metatrader Testerの制限なしで、購入する前に試してみてください。 :    ここをクリック 1.簡単になる利点 通貨と時間枠に基づいて売買シグナルを表示します。 チャートに矢印が表示されてから価格が増減したピップ数を評価します。 (トレンドスクリーナーインジケーター矢印) 信号のタイミングを表示します。 アラートを売買するための複数の時間枠と複数の通貨のアラートを取得します。 2.トレンドラインマップの使用方法 売買シグナルダッシュボードを表示す
50 USD
作者のその他のプロダクト
Multi Strategies Single Combined   Select from up to 6 Strategies solo or Combine different strategies for signal generation  (Combining more than 2 strategies may LIMIT a lot the number of signals)! ALL inputs and Strategies selection From Chart !!! Also Inputs editing from Chart !!! Push your strategy bottom (one strategy) OR Combine signal from as may strategies (up to 6) : Selected and enabled strategies will be in GREEN !!! 1- BUY SELL areas 2- Support resistance break signal 3- Elliot wave
25 USD
YOU DON'T HAVE TO SHIFT ON ALL TIME FRAMES FOR EACH CURRENCY PAIR TO CONCLUDE ITS TREND AND ITS POWER YOU HAVE IT ALL IN ONE TABLE , 20 CURRENCY PAIR WITH 5 TIME FRAMES ALSO , COMPARE BETWEEN CURRENCIES STRENGTH AND ALERTS THE STRONGER /WEAKER PAIR BASED ON 5 TIMEFRAMES CALCULATIONS The Power meter currencies table is a very helpful tool to indicate the TREND strength of up to 20 currencies pairs  using 5 time frames M5 M30 H1 H4 and D1 ( latest version You SELECT you own 5 timeframes from M1 t
22 USD
Automatic redrawing of Trend Supports and resistances levels and Possible Wedge pattern formation to indicate price breaking of Rising Wedge (signal SELL) or price breaking of falling Wedge (signal BUY) Very simple and smart indicator  ALERTS AND MOBILE NOTIFICATIONS availavle !!! you can edit the calculation bars of the bars count for formation of the trend lines and the initial shift from current price  Smaller values for bars /shift inputs when using Higher Time frames (D1-H4) and the reverse
11 USD
SYMBOL POWER based on inputted 5 time frames and Compared to 20 Other Symbols !! Great Indicator YOU DON'T HAVE TO SHIFT ON ALL TIME FRAMES FOR EACH CURRENCY PAIR TO CONCLUDE ITS TREND AND ITS POWER YOU HAVE IT ALL IN ONE TABLE , 20 CURRENCY PAIR WITH 5 TIME FRAMES ALSO , COMPARE BETWEEN CURRENCIES STRENGTH AND ALERTS THE STRONGER /WEAKER PAIR BASED ON 5 TIMEFRAMES CALCULATIONS ALEERTS enable /disable using 5 time frames M5 M30 H1 H4 and D1     ( latest version You SELECT you own 5 timeframes fr
12 USD
SMOOTH STRENGTH METER INDICATOR (SMOOTH LINE) it draws Currencies TREND Volatility Power / Strength lines : -       Detects the 2 highly TRENDED Volatile pairs  ( will be the Bold Lines ) - A very Helpful Indicator - It draws smooth lines for up to 20 currencies pairs representing Volatility  strength and power - First it indicates the most powerful trended direction pairs : Strongest / Weaker -       MAIN FUNCTION  :it gives indication of the       UP trend most Volatile Line  and the      DOWN
11 USD
HEDGING  MASTER line indicator    It compares the power/strength lines of two user input symbols and create a SMOOTHED line that indicates the degree of deviation of the 2 symbols Strategy#1- FOLLOW THE INDICATOR THICK LINE when CROSSING O LEVEL DOWN --- TRADE ON INDICATOR THICK LINE (TREND FRIENDLY) !! Strategy#2- TRADE INDICATOR PEAKS (Follow indicator Reversal PEAKS Levels)!! you input - the index of calculation ( 10/20/30....)                 - the indicator Drawing start point (indicator hi
10 USD
Automatic redrawing of Trend Supports and resistances levels and Possible Wedge pattern formation to indicate price breaking of Rising Wedge (signal SELL) or price breaking of falling Wedge (signal BUY) Very simple and smart indicator  ALERTS AND MOBILE NOTIFICATIONS availavle !!! you can edit the calculation bars of the bars count for formation of the trend lines and the initial shift from current price  Smaller values for bars /shift inputs when using Higher Time frames (D1-H4) and the reverse
30 USD
:::: It is programmed to work on any M5 Chat windows !! Used to determine the Strongest currency pairs and the Weakest pairs also detect the peak of deviation of currencies strength  IT CAN BE USED FOR INDICES AND STOCKS TOO !! Strategy one : It can be used in to BUY Strongest pair and SELL Weakest one Strategy two: It can be used on Daily basis to Hedge BUY Strongest pair with high % (ex: +1%) and BUY Weakest one with % lower(ex: -0.7%) the same with SELL  Strategy three: on 3days  or above ca
10 USD
Auto redrawn Pivot support resistance horizontal lines  with signal of Buy/Sell possibilities with SL level and with trend support resistance lines too used for all symbols and time frames  you can adjust inputs parameters (only 2) and test it on various symbols and time frames input number of bars for calculation and moving average for signal accuracy example : use it on M30 time frame with input 200 for bars count and 100 for MA
11 USD
Price Predictor is an indicator that shows precise price reversals taking into account a higher time frame and a lower time frame candle patterns calculations it is great for scalping and swing trading  . Buy and sell arrows are shown on the chart as for entry signals.  BIG Arrows indicates the trend - SMALL Arrows signal a trade (BUY/SELL)   - A Green BIG UP Arrow with a support green line indicates a Bull Market : wait for buy signal       - A Green SMALL Up Arrow after a BIG green arrow is
10 USD
A simple Approach to Elliot waves patterns Signal generated on trend continuation when breaking the "5" level or on corrective direction after 1-5 waves detected 1-5 labeled points arrows used for signal UP/DOWN direction Chaotic patterns in Blue are drawn all times until  a 1-5 Elliot wave pattern detected  1-5 Red pattern in Bull Market : UP arrow in BULL trend continuation OR DOWN arrow  as a reversal DOWN direction as pattern correction 1-5 Green pattern in Bear Market :DOWN arrow in BEAR tr
10 USD
Auto redrawn Pivot support resistance horizontal lines  with signal of Buy/Sell possibilities with SL level and with trend support resistance lines too used for all symbols and time frames  you can adjust inputs parameters (only 2) and test it on various symbols and time frames input number of bars for calculation and moving average for signal accuracy example : use it on M30 time frame with input 200 for bars count and 100 for MA
22 USD
Smart and simple Indicator based on wolves waves reversal pattern also near to falling and rising wedge and butterfly patterns with Stoploss and entry signal preferred time frame M30 : with parameters bars count used for calculation = 200 and moving average for accuracy = 100; you can try it for other higher or lower parameters and try your own set of inputs higher timeframe = lower input !!! important note ::: Indicator don't back draw when first installed on Chart  once installed wait for new
10 USD
This Indicator provides Buy/Sell Signal based on calculations on Higher frame (Trend) and Lower frame(Entry signals) * You should select the higher and lower frame for indicator calculations * You select the Trend line colors as you prefer * Enable or disable Alerts! Trend lines UP/Down are drawn when a trend is detected Wait for small arrows for entry : *Normally an UP arrow in an UP Trend is a BUY signal : ---you Close the BUY position IF a Reverse DOWN Trend signal appears Or when Up trend li
11 USD
Simple moving trend lines with support and resistance moving levels  used on any time frame on any symbols input: # of bars for trend lines (10-20- 50-100-200----) as per your time frame and your strategy  and     moving period ( 10-20 -50-100-200----) as per your time frame and your strategy Direction Arrows : UP and DOWN are drawn when breaking the trend lines ALerts available at Arrows appearance...  
22 USD
Simple indicator for BUY / Sell Zones moving Buy and Sell zones : Closest zone is wide and clear : Red for Sell zone , Green for Buy zone >>> old far zones are in bold lines :::BUY Zones (GREEN) appear only in UP Trend and disappear in DOWN Trend :::SELL Zones (RED) appear only in DOWN Trend and disappear in UP Trend input parameters ::: index bars : bars range for zone calculation levels : number of zones  Up move/Down move arrows mail and message Alerts !! used on any symbol used on any timefr
22 USD
Crazy Dancing moving RES/SUP Levels Automatic redrawing of moving Supports and resistances levels  to indicate price breaking supports (signal SELL)  or breaking resistance levels (signal BUY) Very simple appearing indicator but very clever and smart too !!!! Main Inputs: # of bars for the support and resistances levels + the initial shift from start + moving average for filter signaling Smaller values for bars /shift inputs when using Higher Time frames (D1-H4) and the reverse higher values for
22 USD
Select from up to 6 Strategies solo or Combine different strategies for signal generation  (Combining more than 2 strategies may LIMIT a lot the number of signals)! ALL From Chart !!! Also Inputs editing from Chart !!! Push your strategy bottom (one strategy) OR Combine signal from as may strategies (up to 6) : Selected and enabled strategies will be in GREEN !!! 1- BUY SELL areas 2- Support resistance break signal 3- Elliot wave continuation /reversal signal 4- Advanced Moving averages 5- Tren
12 USD
SMOOTH DEVIATION line indicator for 2 symbols   It compares the power/strength lines of two user input symbols and create a SMOOTHED line that indicates the degree of deviation of the 2 symbols Strategy#1- FOLLOW THE INDICATOR THICK LINE when CROSSING O LEVEL DOWN --- TRADE ON INDICATOR THICK LINE (TREND FRIENDLY) !! Strategy#2- TRADE INDICATOR PEAKS (Follow indicator Reversal PEAKS Levels)!! you input - the index of calculation ( 10/20/30....)                 - the indicator Drawing start point
12 USD
Simple 3 Moving  supports and resistance levels (Your Review /comment and feedback is important  !! Thanks) Signal UP and Down possibilities created on crossing the multi supports/resistance levels supports all time frames Adjusted inputs for area covered for generating the levels and the shifts needed to cover 3 areas supports /resistances levels for example you may use main parameters in M30 time frames: extern int ShiftFromStart=20;  extern int barsCount=20; extern int sequenceShifts=50;  in
12 USD
Trend Whale
Mohamed yehia Osman
Smart EA based on Trend and Support Resistance Levels with SL results given on EURUSD  H1 for last 10 months IF AUTOLOT enabled: **if LotRisk =1- 3 ---- Profit up to 50%  DD up to 17% **if LotRisk > 5 /10 /20 --- HIGH RISK --- HIGH Profit up to 1600 % or More but High DD up to 40% tested also on other symbols GBPUSD with positive results *** used parameters on H1 timeframe  bars 25  shift 4 ma index 0.85 for lower time frames Inputs will me doubled or tripled ...  for higher time frames inputs
10 USD
Trend Bar Balance Indicator Simple indicator based on trend detection and support resistance breakage  It detects the major trend and the minor support and resistance levels *** a signal for UP /BUY is detected and alerted in a BULL trend and a resistance level break *** a signal for DOWN /SELL is detected and alerted  in a Bear trend and a support level break THE POWER OF THIS INDICATOR I USE IT WHEN YOU COMBINE ITS DAILY SIGNALS FROM DIFFERENT CHART SYMBOLS AT SAME TIME AND CLOSE ALL ORDERS BY
30 USD
SYMBOL POWER based on inputted 5 time frames and Compared to 20 Other Symbols !! Great Indicator YOU DON'T HAVE TO SHIFT ON ALL TIME FRAMES FOR EACH CURRENCY PAIR TO CONCLUDE ITS TREND AND ITS POWER YOU HAVE IT ALL IN ONE TABLE , 20 CURRENCY PAIR WITH 5 TIME FRAMES ALSO , COMPARE BETWEEN CURRENCIES STRENGTH AND ALERTS THE STRONGER /WEAKER PAIR BASED ON 5 TIMEFRAMES CALCULATIONS ALEERTS enable /disable using 5 time frames M5 M30 H1 H4 and D1   ( latest version You SELECT you own 5 timeframes from
30 USD
Buy Sell Zones   Simple indicator for BUY / Sell Zones moving Buy and Sell zones : Closest zone is wide and clear : Red for Sell zone , Green for Buy zone >>> old far zones are in bold lines :::BUY Zones (GREEN) appear only in UP Trend and disappear in DOWN Trend :::SELL Zones (RED) appear only in DOWN Trend and disappear in UP Trend input parameters ::: index bars : bars range for zone calculation levels : number of zones  Up move/Down move arrows mail and message Alerts !! used on any symbol u
12 USD
Trend Lines Signal   This Indicator provides Buy/Sell Signal based on calculations on Higher frame (Trend) and Lower frame(Entry signals) * You should select the higher and lower frame for indicator calculations * You select the Trend line colors as you prefer * Enable or disable Alerts! Trend lines UP/Down are drawn when a trend is detected Wait for small arrows for entry : *Normally an UP arrow in an UP Trend is a BUY signal : ---you Close the BUY position IF a Reverse DOWN Trend signal appear
30 USD
Multi Strategies Combined Signal All in One   Multi Strategies Single Combined   Select from up to 6 Strategies solo or Combine different strategies for signal generation  (Combining more than 2 strategies may LIMIT a lot the number of signals)! ALL inputs and Strategies selection From Chart !!! Also Inputs editing from Chart !!! Push your strategy bottom (one strategy) OR Combine signal from as may strategies (up to 6) : Selected and enabled strategies will be in GREEN !!! 1- BUY SELL areas 2-
12 USD
TWO SYMBOLS CORRELATION  line indicator    It compares the power/strength lines of two user input symbols and create a SMOOTHED line that indicates the degree of deviation of the 2 symbols Strategy#1- FOLLOW THE INDICATOR THICK LINE when CROSSING O LEVEL DOWN --- TRADE ON INDICATOR THICK LINE (TREND FRIENDLY) !! Strategy#2- TRADE INDICATOR PEAKS (Follow indicator Reversal PEAKS Levels)!! you input - the index of calculation ( 10/20/30....)                 - the indicator Drawing start point (ind
12 USD
Symbols Strength meter Graph  :::: It is programmed to work on any M5 Chat windows !! Used to determine the Strongest currency pairs and the Weakest pairs also detect the peak of deviation of currencies strength  IT CAN BE USED FOR INDICES AND STOCKS TOO !! Strategy one : It can be used in to BUY Strongest pair and SELL Weakest one Strategy two: It can be used on Daily basis to Hedge BUY Strongest pair with high % (ex: +1%) and BUY Weakest one with % lower(ex: -0.7%) the same with SELL  Strateg
12 USD
Trend Follower and Reversal Trend handler * EA opens X Lot position (calculated according to Lot risk value) with trend with indicated TP if Trend reversal occurs * EA opens 5 X Lot (if input " Reversal Lot scaling" = 5     ) position with reversal trend with indicated TP and same SL for old trend position * Increasing LOT risk value + Increasing Reversal Lot scaling value = High Risk and High Profit and High DD * Decreasing LOT risk value + Decreasing Reversal Lot scaling = Low Risk and Low Pr
12 USD
フィルタ:
レビューなし
レビューに返信