XP Moving Average MT5
- インディケータ
- Ahmed Soliman
- バージョン: 1.1
- アップデート済み: 26 6月 2020
- アクティベーション: 10
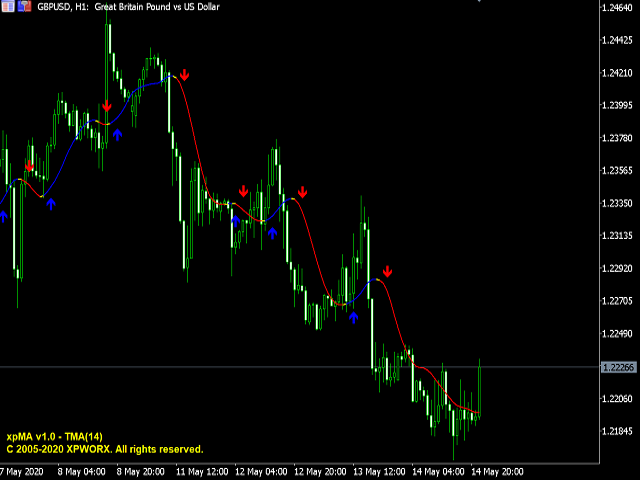
Get all the moving averages in one indicator.
Simple moving average, Exponential moving average, Smoothed moving average, Linear weighted moving average, Double Exponential Moving Average, Triple Exponential Moving Average, T3 Moving Average and MORE.
Find in the comments a Free Expert Advisor that uses the XPMA. It will show you how easy to make an EA based on the XPMA (XP MOVING AVERAGE).
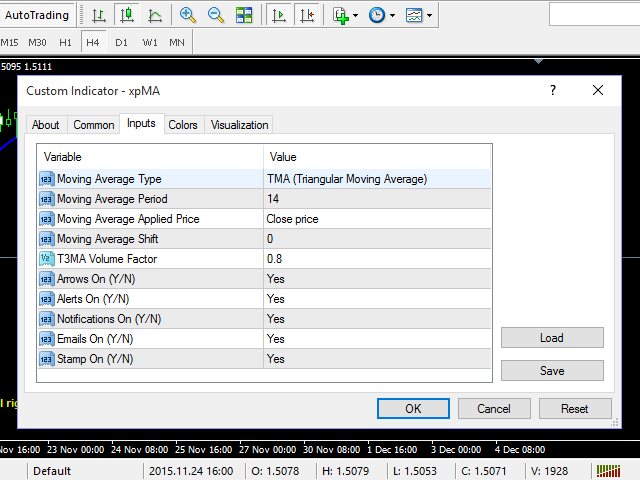
Settings:
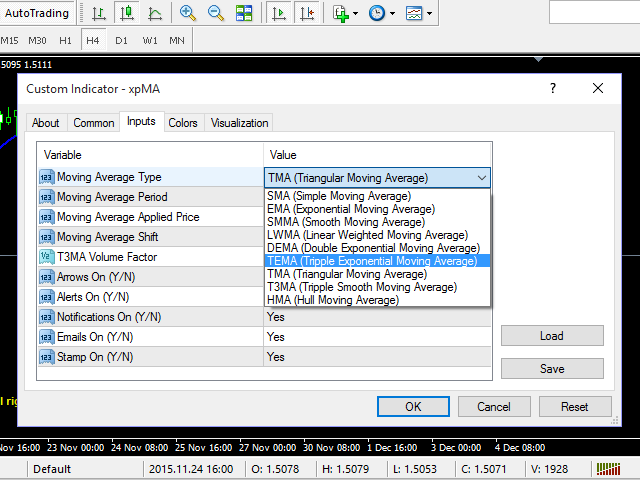
- Moving Average Type: The Moving Average Type. It can be one of these types:
- SMA (Simple Moving Average)
- EMA (Exponential Moving Average)
- SMMA (Smooth Moving Average)
- LWMA (Linear Weighted Moving Average)
- DEMA (Double Exponential Moving Average)
- TEMA (Tripple Exponential Moving Average)
- TMA (Triangular Moving Average)
- T3MA (Tripple Smooth Moving Average)
- HMA (Hull Moving Average)
- Moving Average Period: The Moving Average Period
- Moving Average Applied Price: The Moving Average Applied Price. It can be one of the these types:
- Close price
- Open price
- High price
- Low price
- Median price, (high + low)/2
- Typical price, (high + low + close)/3
- Weighted close price, (high + low + close + close)/4
- Moving Average Shift: The Moving Average Shift.
- T3MA Volume Factor: The T3MA Moving Average Volume Factor.
- Arrows On (Y/N): Show Arrows or not.
- Alerts On (Y/N): Enable or Disable the Alerts.
- Notifications On (Y/N): Send Mobile Notifications or not.
- Emails On (Y/N): Send Emails Notifications or not.
- Stamp On (Y/N): Show company logo or not.