News Clock
- インディケータ
- Victor Klenov
- バージョン: 1.0
- アクティベーション: 5
The professional browser of News and Trading Sessions is now available in MetaTrader 5.
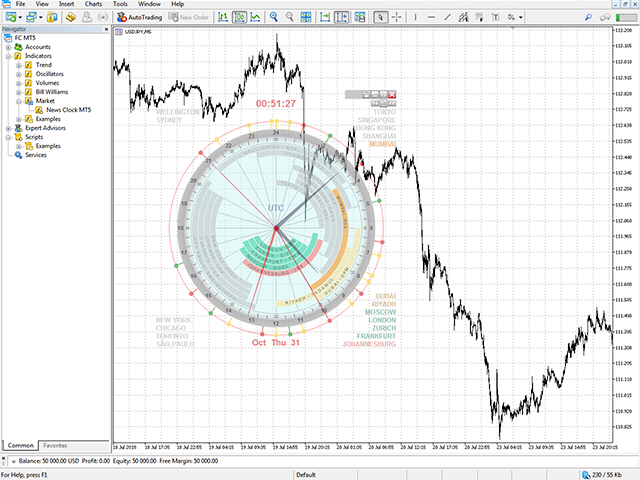
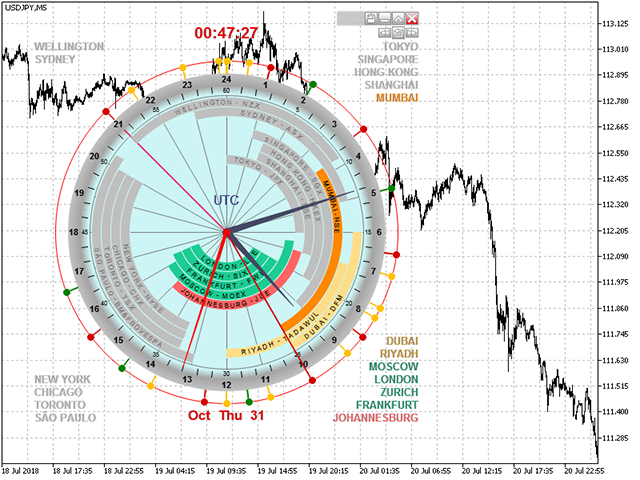
Now all the most important market information is collected on one dial!
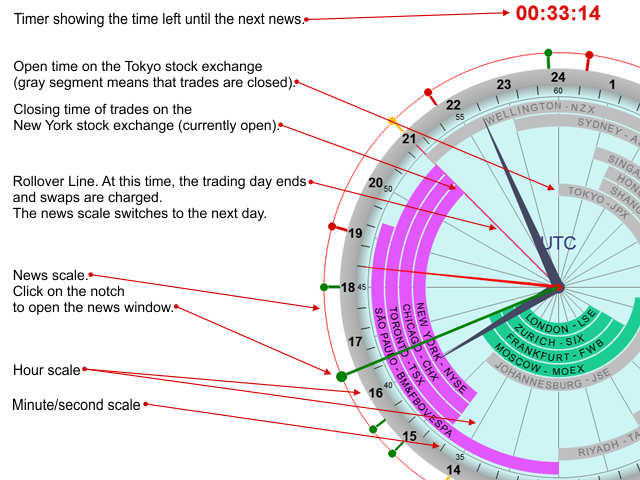
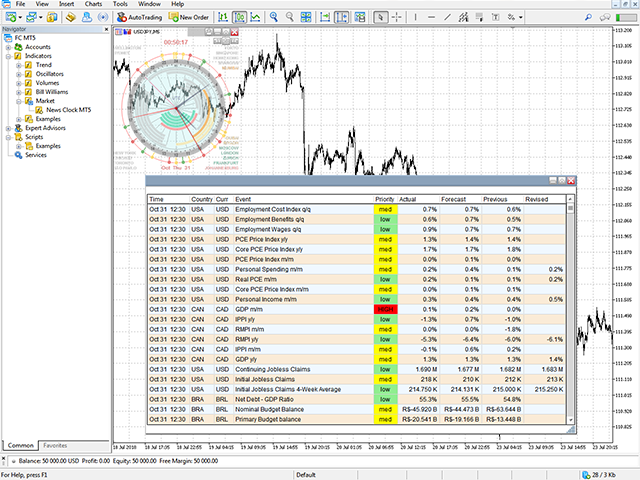
News located on the Time scale.
Planning your working time has never been so easy and convenient ...
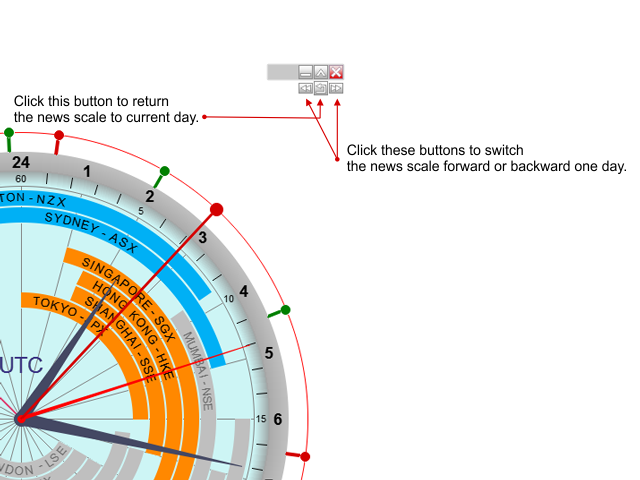
The news scale can be switched a day, two, a week, a month forward or backward (see the details in the short video).
All news updates in real time.
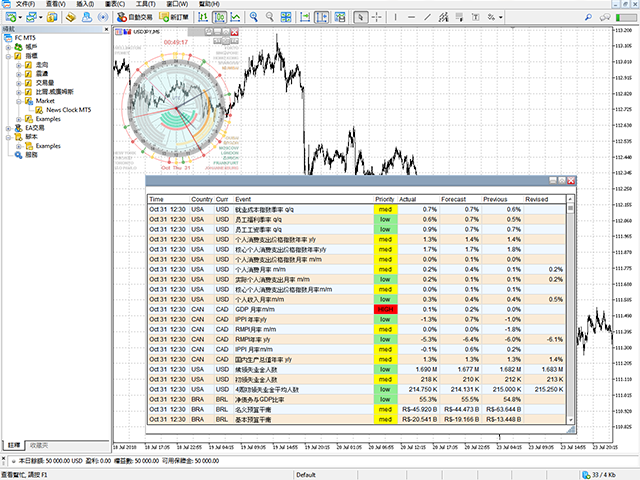
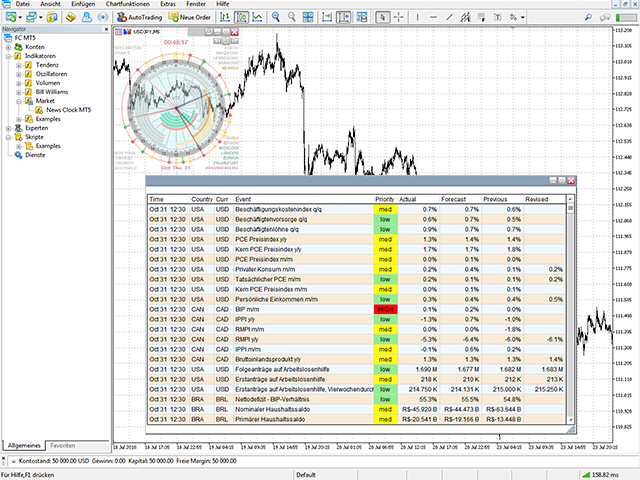
Thanks to the built-in filters, you can configure the display of news by importance, country or currency.
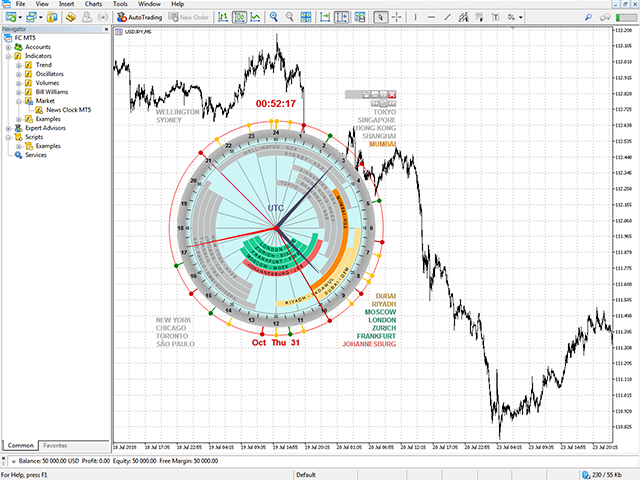
Opening hours of the 18 largest stock exchanges in the world.
This makes it possible to trace the characteristic movement of the market at the appropriate time of day.
Thanks to sound and push notifications,
You will never miss another news or start trading on the next exchange!
The operating time of each exchange is taken from its official site.
The indicator takes into account the transition of exchanges to summer / winter time, as well as weekends.
The program supports 7 languages (English, Russian , 中文, Español, Português, 日本語, Deutsch).
It's no secret that time plays an important role in Forex trading.
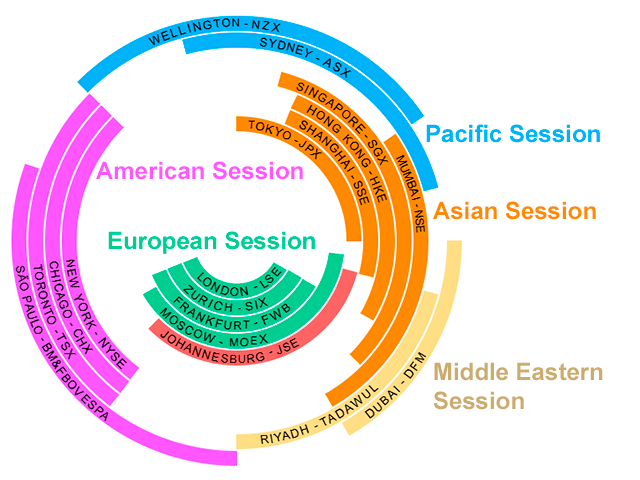
As you know, trading is conducted in accordance with the so-called sessions of Forex. There are four of them: Asian , European , American and Pacific , following each other. Some stock watches are characterized by increased volatility, which is explained by the introduction of two trading sessions to the market at once.
The highest trading volume is noted during the European session , but the most aggressive trading takes place during the american hours . The Pacific session is the least active. The Asian session is considered calm, but no less productive.
Knowing the schedule of Forex trading sessions will help you allocate resources efficiently, as well as build a trading strategy taking into account the features of each trading session.
You can now monitor the status of Forex trading sessions and the Output of News, without looking up from the schedule.
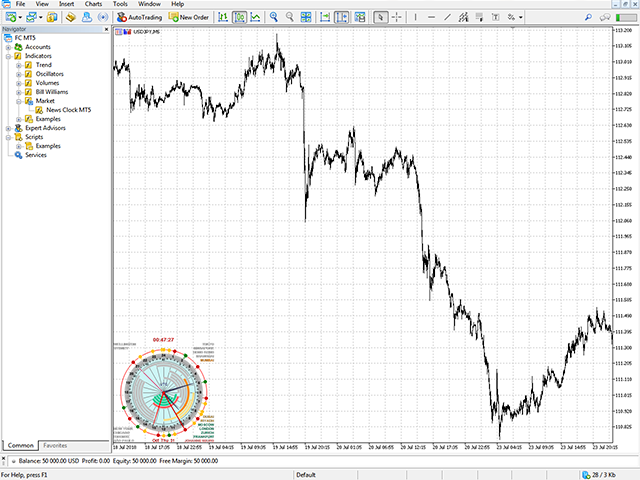
The indicator is designed as a clock with a twenty four hour scale. The watches are oriented according to universal coordinated time (UTC). The UTC time was chosen as the most convenient for the Stock hours and the stock exchanges were calculated in accordance with it.
Due to the great possibilities of adjustment, the indicator takes up minimal space on the chart.
Input parameters: